Peripheral Blood Immune Landscape in Progressive Idiopathic Pulmonary Fibrosis: Insights from Single-Cell RNA Sequencing
Single-cell RNA sequencing of peripheral blood from individuals with Idiopathic Pulmonary Fibrosis (IPF) reveals significant immune dysregulation, particularly in progressive disease. Key findings include shifts in T cell and innate lymphoid cell populations, distinct cell-cell communication networks involving PGE2 and immune checkpoints, and widespread activation of pro-inflammatory pathways in myeloid and lymphoid cells. These systemic alterations suggest active immune contributions to disease progression and highlight potential biomarkers and therapeutic targets.
Contents
- Dataset overview
- UMAP Visualization of Single-Cell RNA-seq Data by Condition, Sample, and Cell Type Hierarchies
- Major Cell Type Score Visualization on UMAP
- Overall Celltype_subset Marker Expression Profile
- Peripheral Blood Minor Cell Type Population Analysis in IPF
- T cell Subtype Population Analysis in IPF
- T Cell Subset Population Proportions in IPF Conditions
- Myeloid Cell Subpopulation Analysis in Blood Across IPF Conditions
- Condition-Specific Cell-Cell Interaction Analysis in Blood
- Condition-Specific Cell-Cell Interaction Patterns in Peripheral Blood of Idiopathic Pulmonary Fibrosis
- Monocyte Condition-Specific Surfaceome Markers in Idiopathic Pulmonary Fibrosis
- T cell CD4+ Condition-Specific Surfaceome Marker Analysis: TIGIT Expression in IPF
- Gene Set Enrichment Analysis Reveals Distinct Immunological Signatures in Progressive IPF Blood Cells
- Discussion
- Query List
0. Dataset overview
Dataset Summary
- This dataset is an AnnData object containing single-cell RNA-seq data from human blood tissue.
- It includes 89,619 cells and 21,249 genes.
- Key observational metadata (obs columns) include sample, condition (progressive_ipf, stable_ipf, control), tissue, and celltype annotations at major, minor, and subset levels.
- celltype_major categories include Myeloid cell, T cell, B cell, and Megakaryocytic cell.
- celltype_minor includes Monocyte, T cell CD8+, NK cell, and Plasma cell.
- celltype_subset provides finer granularity such as Monocyte, T cell (Cytotoxic), and B cell (Follicular).
- Precomputed results stored in uns include Cell-Cell Interaction (CCI), Differential Expression Gene (DEG), Gene Set Enrichment Analysis (GSEA), and Gene Ontology (GSA) results.
- These analyses are available per celltype_minor and often compare one condition versus the rest.
1. UMAP Visualization of Single-Cell RNA-seq Data by Condition, Sample, and Cell Type Hierarchies
[Analysis Visualization Results]...
Analysis Overview
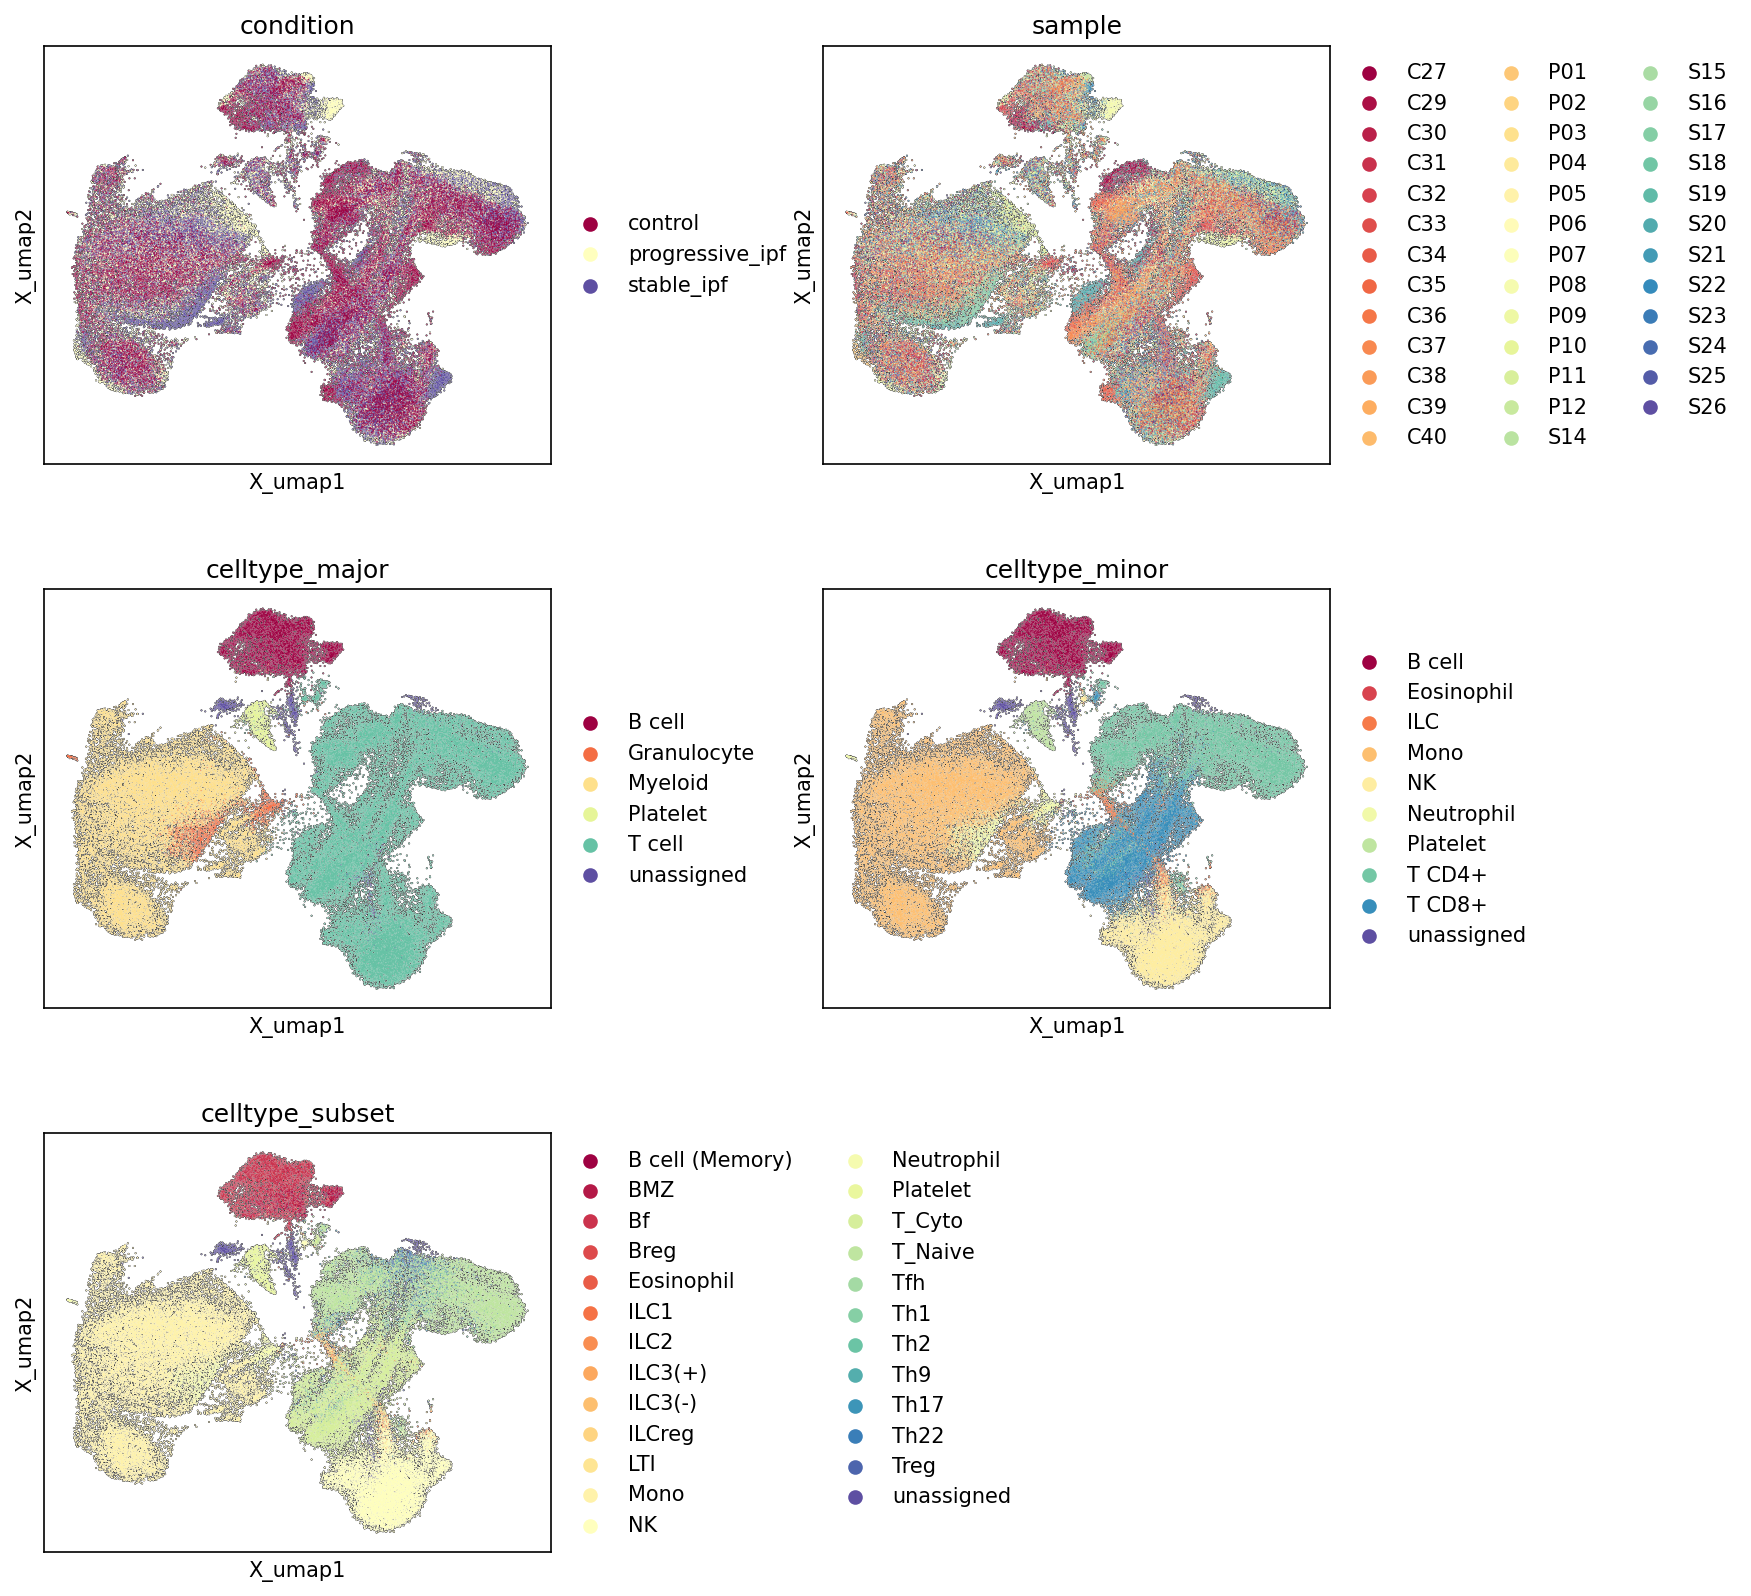
This analysis provides a dimensionality reduction (UMAP) visualization of 89,619 cells from single-cell RNA-seq data, originating from human blood samples. The UMAP plots are colored by condition (control, progressive_ipf, stable_ipf), individual sample identifiers, celltype_major, celltype_minor, and celltype_subset. The purpose is to explore the overall structure of the dataset, assess the quality of cell type annotations, and identify any condition- or sample-specific clustering patterns.
Visual Summary
Condition-based UMAP
The UMAP colored by condition reveals distinct but overlapping distributions. Control cells (dark red) appear broadly distributed across the UMAP space, forming the core of several large clusters. Progressive_ipf (yellow) and stable_ipf (dark blue) cells are also broadly distributed but show regions of enrichment or depletion compared to controls. Specifically, progressive_ipf appears to be slightly more concentrated in certain areas, particularly a distinct, smaller cluster on the right side of the main "body" of cells, suggesting potential condition-specific cell states or populations. There's significant mixing of cells from all three conditions across many regions, indicating shared cell types, but also areas of differential enrichment.
Sample-based UMAP
The sample UMAP displays a high degree of intermixing of different sample IDs (represented by various colors) across most of the UMAP landscape. This extensive mixing indicates that there are no strong, overt batch effects causing individual samples to cluster entirely separately from others, which is desirable for downstream comparative analyses. While some smaller sub-clusters might show a slight enrichment for one or two samples, the overall impression is one of good integration across samples.
Cell Type-based UMAPs (Major, Minor, Subset)
The hierarchical cell type annotations (major, minor, subset) demonstrate a robust and consistent clustering structure:
- Celltype_major: Cells group into clearly distinct major populations. B cell (dark red) forms a prominent cluster in the upper left. Myeloid cell (light green) and T cell (purple) occupy large, well-separated regions. Megakaryocytic cell (orange) forms a smaller, distinct cluster. The unassigned cells (dark blue/purple) are visible but do not form a single compact cluster, rather appearing somewhat dispersed or at the edges of defined clusters.
- Celltype_minor: This level provides further granularity, with well-resolved clusters for most cell types. Monocyte (orange) forms a large, coherent cluster within the myeloid cell region. T cell CD4+ (light green) and T cell CD8+ (blue) clearly delineate the major T cell cluster. Other cell types like NK cell (yellow), Plasma cell (light green), Granulocyte (red), ILC (dark red), and Platelet (light blue) also form distinct, well-defined clusters. The unassigned cells (dark blue) continue to be present, spread across different regions.
- Celltype_subset: At the most granular level, the UMAP shows further sub-divisions within the celltype_minor clusters. For example, the Monocyte cluster remains largely coherent, while the T cell populations resolve into subsets such as T cell (Cytotoxic) (light green), T cell (Naive) (green), T cell (Treg) (dark blue), and others, each occupying distinct, yet sometimes overlapping, territories within the broader T cell space. Similarly, B cell (Memory) (dark red) and B cell (Follicular) (red, likely 'Bf') further refine the B cell compartment. The unassigned cells (dark blue) are still present, generally scattered, which may indicate cells with ambiguous transcriptomic profiles or rare cell populations that could not be assigned confidently.
Biological Interpretation
The UMAP visualizations demonstrate that the single-cell RNA-seq data from blood samples are well-structured and reflect known immune cell heterogeneity. The clear separation of major and minor immune cell types, like T cells, B cells, and Myeloid cells, into distinct clusters indicates successful cell type identification and annotation. The subsequent resolution into subsets (e.g., T cell helper subsets, B cell memory vs. follicular) confirms the depth of annotation, allowing for detailed investigation of immune cell populations.
The observation that control, progressive_ipf, and stable_ipf conditions show both shared and differentially enriched regions in the UMAP is biologically significant. It suggests that while the basic composition of circulating immune cells might be similar across conditions, there are likely condition-specific shifts in the proportions of certain cell types, or alterations in their activation states, particularly in progressive_ipf. This warrants further investigation through differential abundance analysis or differential gene expression within specific cell types to pinpoint the exact cellular mechanisms driving disease progression or stability in IPF.
The presence of unassigned cells at all annotation levels, without forming a single compact cluster, suggests they might represent:
- Rare cell populations: Cells that are genuinely rare and lack clear markers for existing annotation schemes.
- Transitional states: Cells caught in intermediate differentiation or activation states, making definitive assignment difficult.
- Ambiguous profiles: Cells with mixed or low-quality transcriptomes, or those with expression profiles overlapping multiple known cell types.
Further work, such as manual inspection of marker genes in these unassigned clusters or iterative re-clustering, could help resolve some of these cells.
Clinical or Translational Implications
The robust cell type annotation and visualization lay a strong foundation for understanding the immune landscape in Idiopathic Pulmonary Fibrosis (IPF) progression. The subtle yet observable differences in cell distribution between progressive_ipf, stable_ipf, and control conditions highlight the potential for identifying circulating immune cell biomarkers of disease activity or progression. For instance, if specific immune cell subsets are uniquely enriched or depleted in progressive_ipf, these could serve as diagnostic or prognostic markers, or even as targets for therapeutic intervention aimed at modulating the immune response in IPF. The high confidence in cell type assignment also facilitates downstream analyses, such as differential gene expression and cell-cell interaction analyses, to identify specific pathways or communication networks dysregulated in IPF.
2. Major Cell Type Score Visualization on UMAP
[Analysis Visualization Results]...
Analysis Overview
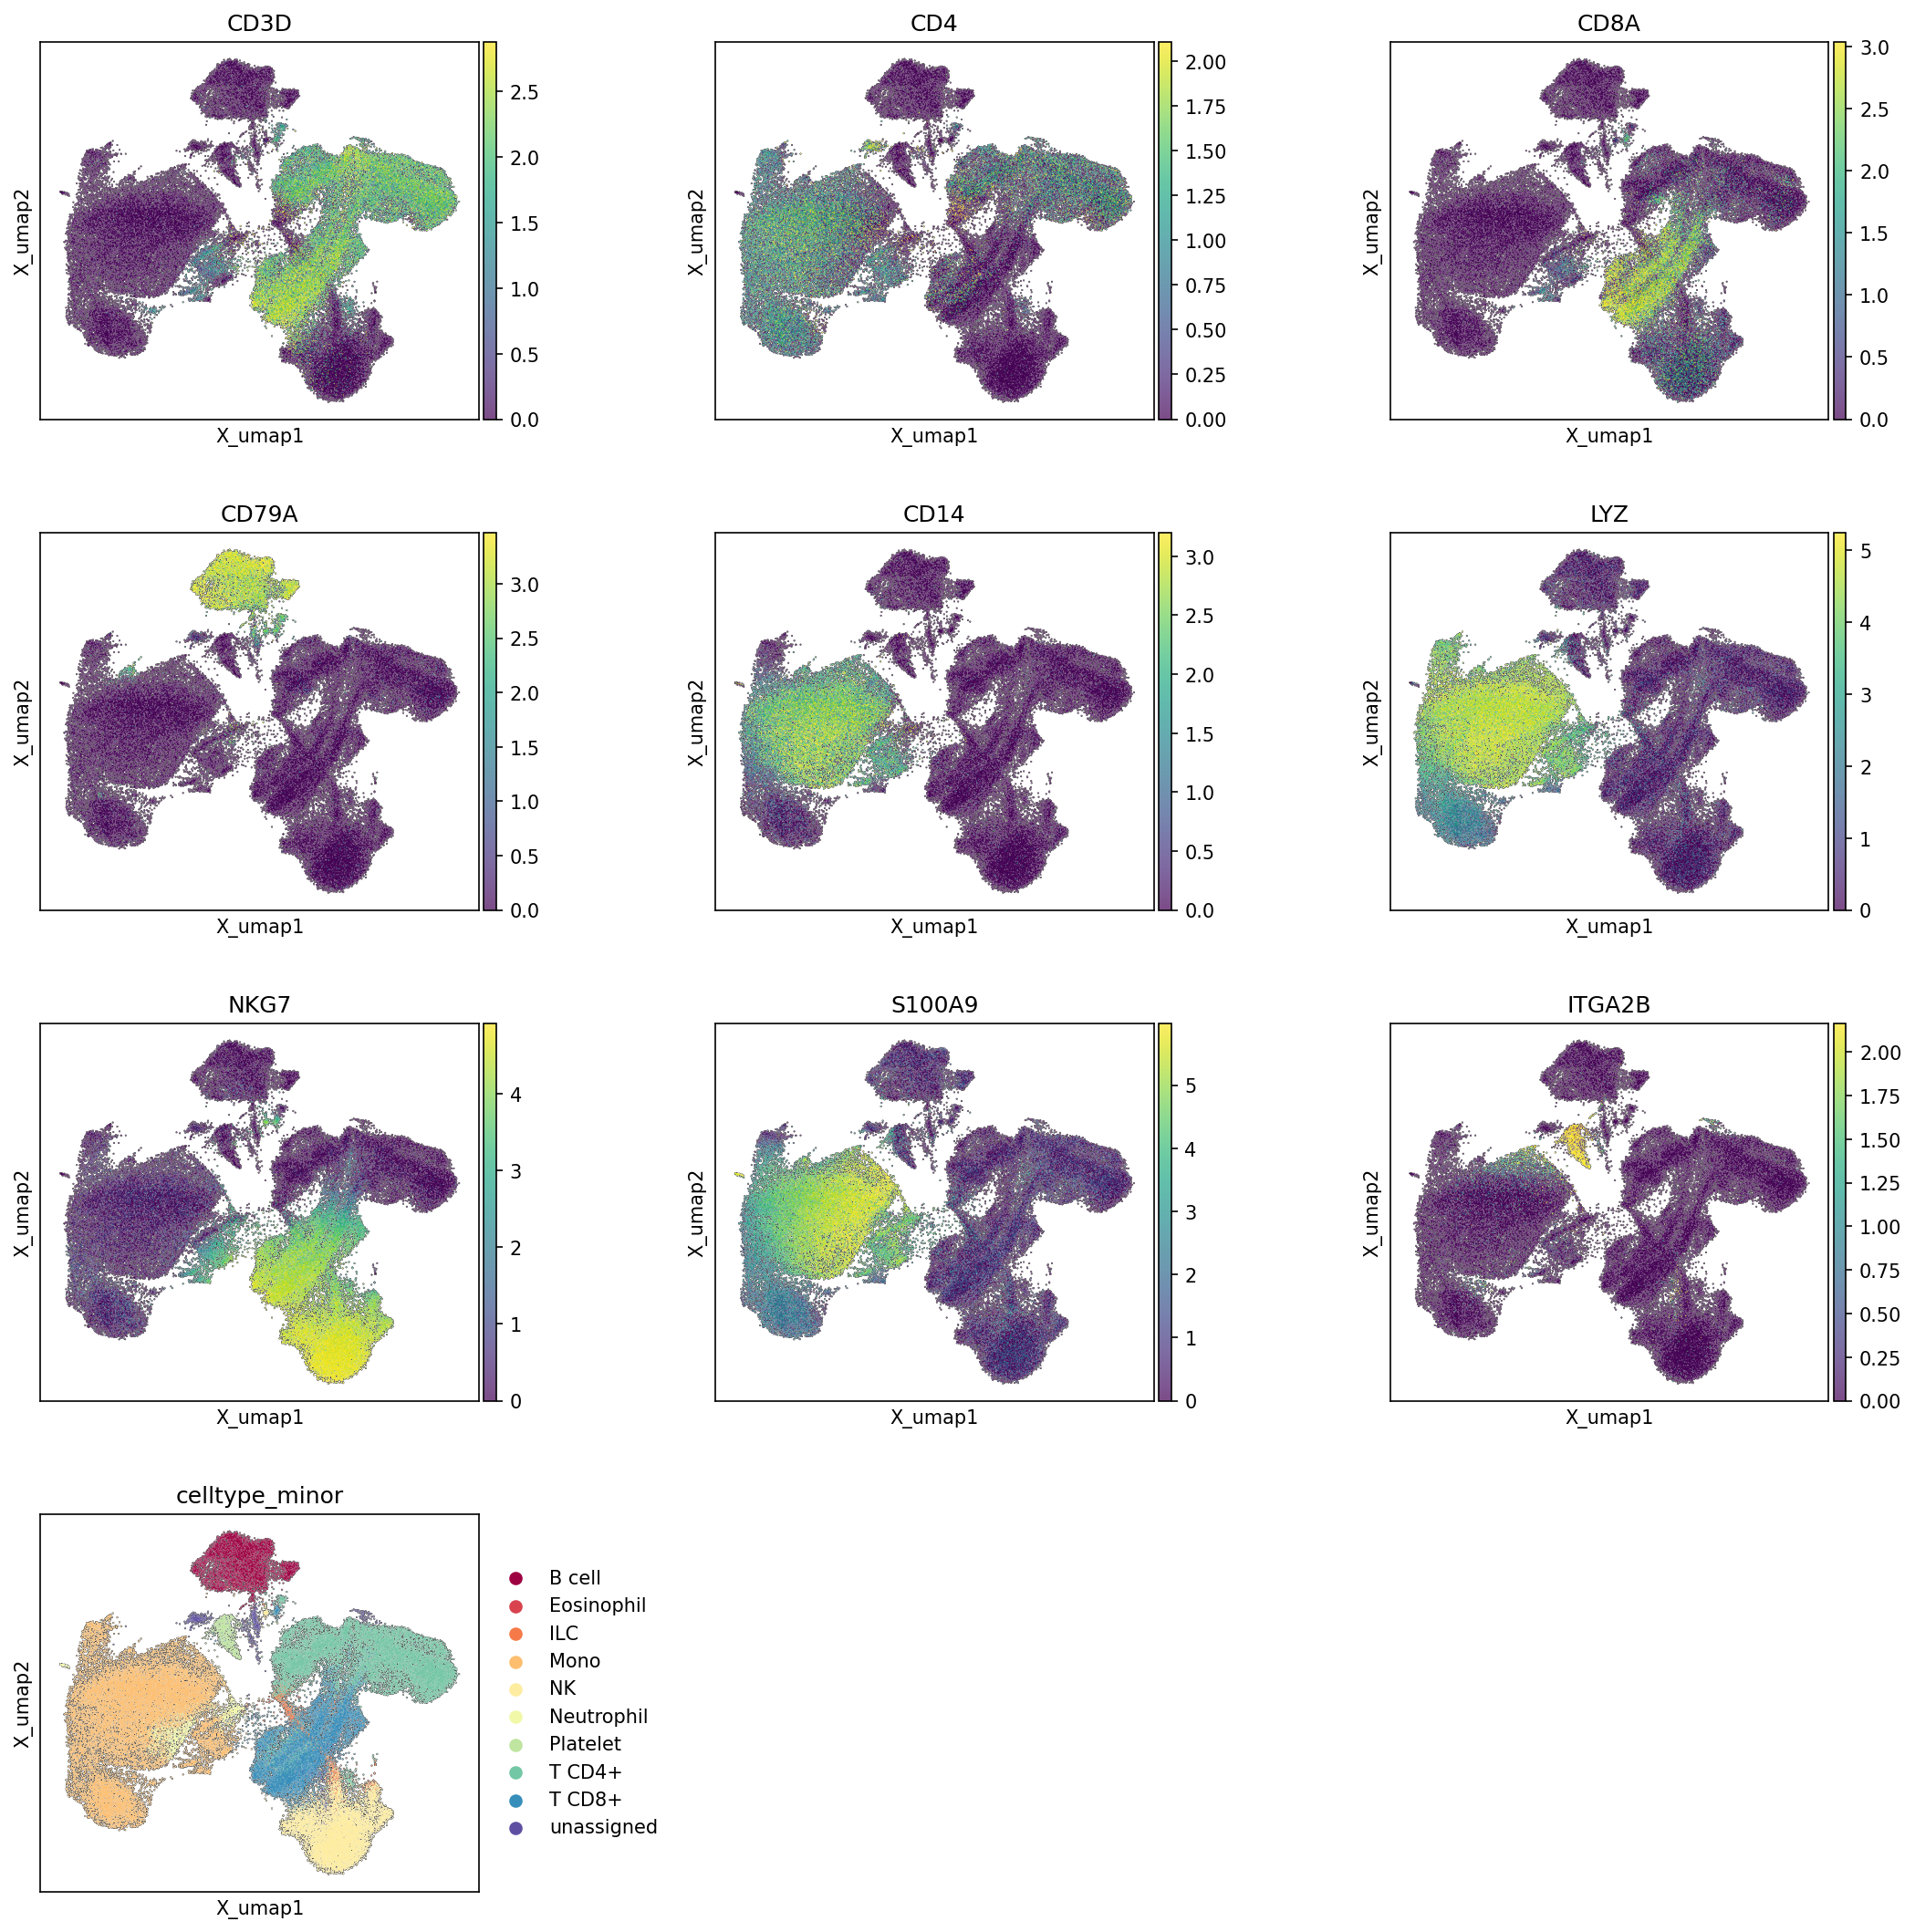
This analysis visualizes the distribution of major cell type scores across the UMAP embedding, alongside the final celltype_major annotations. The purpose is to assess the fidelity of cell type assignments by examining how well the computationally derived scores for specific major cell types align with distinct clusters in the UMAP and the pre-existing celltype_major labels. This serves as a critical quality control step for cell identity annotation.
Visual Summary
The UMAP plots display the major cell type scores for various cell lineages (T cell, B cell, Myeloid cell, Mast cell, Endothelial cell, Stromal cell, Erythroid cell, Megakaryocytic cell) as a continuous color scale, where warmer colors (yellow/green) indicate higher scores. The final plot shows the discrete celltype_major annotations.
- Concordant Cell Type Scoring: For major immune cell types abundant in blood, such as T cells, B cells, Myeloid cells, and Megakaryocytic cells, the high-score regions on the UMAP are highly localized and show strong concordance with their respective distinct clusters in the celltype_major plot. For instance, the region with high "HiCAT_major_score: T cell" (right side) directly maps to the T cell cluster, and similarly for B cells (top-center), Myeloid cells (left side), and Megakaryocytic cells (center-bottom).
- Rare/Absent Cell Type Scoring: Cell types not typically abundant in peripheral blood, such as Mast cells, Endothelial cells, Stromal cells, and Erythroid cells, consistently show very low scores across the entire UMAP, with only diffuse or faint signals in isolated regions. This indicates a lack of strong gene expression signatures for these cell types in the dataset.
- "unassigned" Cluster: The "unassigned" cluster in the celltype_major plot (dark purple) does not show a dominant high score for any single major cell type, which is expected for cells that could not be confidently assigned to a specific lineage.
Biological Interpretation
The strong agreement between the HiCAT major cell type scores and the clustered populations on the UMAP, as confirmed by the celltype_major annotations, provides robust support for the accuracy and specificity of the cell type assignments for the primary immune cell populations. The distinct spatial separation of high-scoring cells for T cells, B cells, Myeloid cells, and Megakaryocytic cells reflects well-defined transcriptional identities for these lineages.
The low scores observed for Mast, Endothelial, Stromal, and Erythroid cells are biologically consistent with the sample origin, which is peripheral blood.
- Mast cells are primarily tissue-resident and are generally rare in circulation.
- Endothelial cells and Stromal cells form the lining of blood vessels and connective tissues, respectively, and are not expected to be found as free cells in peripheral blood samples.
- While Erythroid cells (red blood cells) are highly abundant in blood, mature erythrocytes lack nuclei and mRNA, making them unsuitable for single-cell RNA-seq. Even immature erythroid precursors are often depleted during sample processing, or their low mRNA content leads to poor representation in typical scRNA-seq datasets.
Annotation Notes
The visualization of major cell type scores on the UMAP serves as an excellent validation of the cell type annotation process. The clear demarcation of high-scoring regions for specific cell types that align precisely with their annotated clusters suggests high confidence in the major cell type assignments. The lack of significant scores for cell types not expected in peripheral blood further strengthens the reliability of the annotation and confirms the biological context of the dataset. This analysis provides a solid foundation for subsequent differential expression, pathway, and cell-cell interaction analyses.
3. Overall Celltype_subset Marker Expression Profile
[Analysis Visualization Results]...
Analysis Overview
This analysis presents a dot plot illustrating the expression of key marker genes across various celltype_subset populations identified in human blood single-cell RNA-seq data. The plot serves as a critical step in validating cell type annotations by demonstrating the specificity and expression levels of characteristic genes for each subset. Dot size represents the fraction of cells within a group expressing a particular gene, while the color intensity indicates the mean expression level of that gene within the group. The analysis was performed using the plot_markers_and_expression_dot tool with default parameters, designed to identify and visualize surfaceome-enriched markers specific to each cell type.
Visual Summary
The dot plot effectively visualizes the distinct gene expression patterns that define each celltype_subset. The presence of strong, cell-type-specific marker expression, particularly highlighted by the red boxes along the diagonal, largely confirms the distinct identity of the annotated cell subsets.
- B cell subsets (Breg, Follicular, MZ, Memory): These subsets show strong expression of pan-B cell markers such as *POU2AF1*, *CD22*, *IGHD*, and *EBF1*. Distinct markers, though sometimes shared across a few B cell subsets, contribute to their refined identification. For instance, *FCRL3* shows higher expression in B cell (Follicular) and (MZ).
- Eosinophils, ILC2, LTI: These distinct populations are characterized by unique marker sets. Eosinophils are marked by *PRG2*. ILC2s show expression of *KLRG1*, *IL1RL1*, and *GATA3*. LTI cells are identified by *CD7* and *IL7R*.
- Monocytes: A highly defined cluster with robust expression of classic monocyte markers including *LYZ*, *S100A4*, *S100A8*, *S100A9*, *CSF1R*, and *CD68*. Several LILR family genes (*LILRA1*, *LILRB1*, *LILRB2*, *LILRB3*, *LILRA2*, *LILRA5*) are also highly expressed, consistent with myeloid cell identity.
- NK cells: These cells are well-defined by markers such as *CD16*, *KLRK1*, and *NCR1*, alongside other NK cell-associated receptors like *LILRB1* and *KLRC1*.
- Neutrophils: Display strong expression of myeloid-specific genes including *NCF1*, *CSF3R*, and *SERPINB1*, and *IL1B*, validating their annotation.
- Plasma cells: Clearly distinguished by key plasma cell transcription factors and immunoglobulin-associated genes like *PRDM1*, *XBP1*, *MZB1*, *JCHAIN*, and *TNFRSF17* (BCMA).
- Platelets: Show a highly specific and extensive set of markers, including *PPBP*, *PF4*, *ITGA2B*, *CD9*, and various other platelet-specific genes, indicating a very distinct and well-resolved cluster.
- T cell subsets (Cytotoxic, Naive, Tfh, Th1, Th17, Th2, Th22, Treg): These show clear differentiation based on canonical T cell subset markers.
- T cell (Cytotoxic): Defined by *CD8A*, *CD8B*, and cytotoxic effector molecules like *GZMB*.
- T cell (Naive): Expresses *LEF1* and *CD5*.
- T cell (Tfh): Characterized by *CD40LG*, *TNFRSF4*, and *SLAMF1*.
- T cell (Th1): Distinguished by *STAT1* and *IFNGR1*.
- T cell (Th17): Identified by *RORA*, *BATF*, and *IL21R*.
- T cell (Th2): Primarily marked by *GATA3*.
- T cell (Treg): Shows robust expression of *FOXP3*, *CTLA4*, and *ITGAE*.
- T cell (Th22): The markers *STAT5A* and *STAT5B* are shown here. While *STAT5A/B* are involved in T cell signaling, they are not as specific for Th22 cells as *AHR* or *IL22*. This might indicate some overlap or the need for more specific Th22 markers to fully delineate this subset.
Biological Interpretation
The strong and specific expression of canonical marker genes across the majority of celltype_subset populations provides compelling biological evidence supporting their distinct identities within the human blood cellular landscape. This comprehensive panel of surfaceome-enriched markers is crucial for delineating these subsets, which play diverse roles in immune responses and homeostasis. For example:
- B cell heterogeneity is reflected by subtle differences in marker expression (e.g., *FCRL3* distribution), indicating functional specialization even within the broader B cell lineage.
- Myeloid cells (Monocytes, Neutrophils) exhibit unique marker profiles, consistent with their roles in innate immunity. The prominent expression of LILR family receptors on monocytes suggests their complex regulatory functions [UniProt: LILR family].
- T cell subsets are crucial for adaptive immunity. The distinct marker sets for cytotoxic, helper (Th1, Th2, Th17, Tfh, Th22), naive, and regulatory T cells (Treg) underscore their specialized functions in orchestrating immune responses and maintaining tolerance [PubMed: T cell differentiation]. For instance, *FOXP3* and *CTLA4* are critical for Treg function in immune suppression [GeneCards: FOXP3, GeneCards: CTLA4].
Annotation Notes
The dot plot strongly validates the current celltype_subset annotations for most populations. The distinct and largely non-overlapping marker expression profiles confirm that these subsets are well-resolved and accurately identified. The presence of red boxes along the diagonal visually reinforces the specificity of the chosen markers for their respective cell types.
However, a slight observation in the T cell (Th22) subset, where *STAT5A* and *STAT5B* are presented as markers, suggests that while these are relevant to T cell signaling, they might not be as uniquely defining for Th22 cells as other canonical Th22 markers (e.g., *AHR*, *IL22*) could be. This could imply a need to explore additional, more specific markers or consider potential functional overlap with other T helper subsets where STAT5 signaling is also active. Nevertheless, for the purpose of general cell identity, the overall annotation quality appears robust across the dataset.
4. Peripheral Blood Minor Cell Type Population Analysis in IPF
[Analysis Visualization Results]...
Analysis Overview
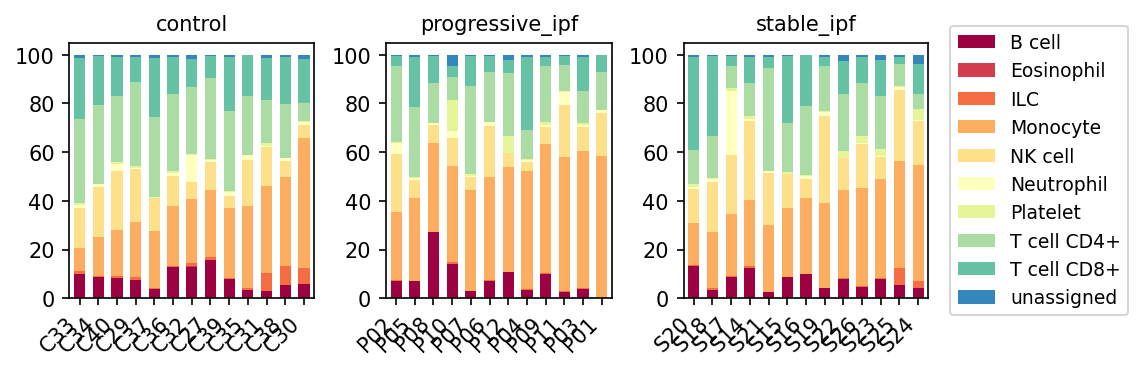
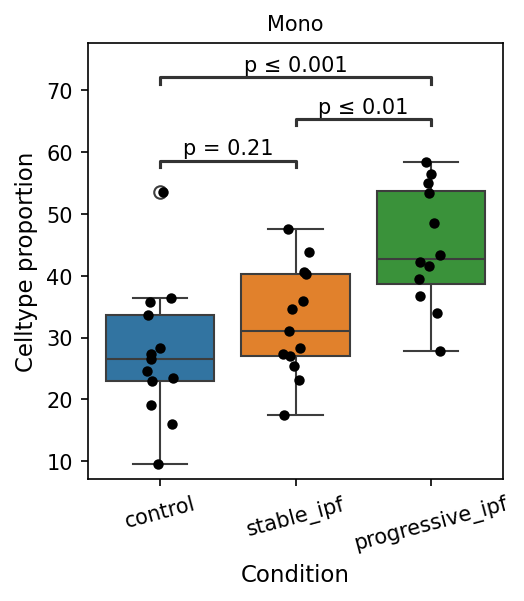
This analysis presents a stacked bar plot visualizing the relative proportions of minor cell types (as defined by celltype_minor) in peripheral blood samples across three conditions: control, progressive_ipf, and stable_ipf. Each bar represents an individual sample, with cell type proportions stacked to sum to 100%. This provides an overview of immune cell landscape shifts in the peripheral blood associated with different stages of Idiopathic Pulmonary Fibrosis (IPF).
Visual Summary
The stacked bar plots illustrate the composition of peripheral blood mononuclear cells across individual samples within each condition.
- Dominant Cell Types: Monocytes (orange) consistently constitute a major proportion of cells across all samples and conditions, often comprising 40-60% or more of the observed minor cell types. T cell CD4+ (light green) and T cell CD8+ (teal) also contribute significantly, though their proportions appear more variable. NK cells (pale yellow) are also a noticeable component.
Condition-Specific Trends
- Monocytes: There appears to be a trend towards increased proportions of Monocytes in both progressive_ipf and stable_ipf conditions compared to control samples. Within progressive_ipf and stable_ipf, Monocytes often represent a larger fraction, sometimes exceeding 60-70% in individual samples.
- T cells (CD4+ and CD8+): Conversely, the proportions of T cell CD4+ and T cell CD8+ generally appear to be relatively lower in progressive_ipf samples compared to control samples. Stable_ipf samples show intermediate or slightly higher T cell proportions than progressive_ipf, but still potentially lower than controls in some instances.
- B cells: B cells (dark red) show a noticeable presence, particularly in some progressive_ipf samples, where their proportion can be higher compared to controls and stable IPF samples. For example, sample P087 in progressive_ipf shows a prominent B cell population.
- NK cells: NK cell (pale yellow) proportions seem variable across samples, with no clear global trend, though some progressive_ipf samples might show a slight reduction.
- Other Cell Types: Granulocytes (red), ILC (orange-red), Plasma cells (lightest yellow), and Platelets (lime green) constitute minor populations across all conditions and samples, generally remaining below 5-10% individually. The 'unassigned' category (blue) is consistently low, indicating good cell type annotation quality.
- Sample Heterogeneity: There is notable inter-sample variability in cell type proportions within each condition, especially visible in Monocyte and T cell fractions, suggesting patient-specific immune responses or disease heterogeneity.
Biological Interpretation
The observed shifts in peripheral blood cell populations provide insights into the systemic immune dysregulation in IPF:
- Monocyte Expansion in IPF: The apparent increase in Monocyte proportions in both progressive_ipf and stable_ipf suggests a heightened systemic inflammatory state. Monocytes are crucial precursors to macrophages, which are well-known to play a central role in the pathogenesis of IPF by promoting inflammation, extracellular matrix deposition, and fibroblast activation in the lung [1]. Their elevated presence in peripheral blood could reflect increased mobilization to the lungs or a generalized myelopoiesis associated with chronic inflammation.
- T cell Dynamics in IPF: The relative decrease in T cell populations, particularly in progressive_ipf, could indicate several phenomena:
- T cell Sequestration/Migration: T cells might be migrating from the peripheral circulation into the fibrotic lung tissue, where they contribute to local inflammation and fibrosis [2].
- Immune Exhaustion or Suppression: Chronic inflammation can lead to T cell exhaustion, reducing their numbers or functionality in the periphery.
- The relatively higher T cell proportions in stable_ipf compared to progressive_ipf could potentially reflect differences in disease activity or immune regulatory mechanisms between these two IPF subgroups.
- B cell Involvement in IPF Progression: The occasional increase in B cell proportions in progressive_ipf samples aligns with emerging evidence suggesting a role for B cells and humoral immunity in IPF pathogenesis. B cells can contribute to fibrosis through autoantibody production, antigen presentation, and cytokine secretion, potentially exacerbating disease progression [3].
- Overall Immune Imbalance: The combined picture points to a general shift in the peripheral immune landscape in IPF patients, characterized by an expansion of myeloid components (Monocytes) and a potential reduction or altered distribution of lymphoid components (T cells), with variable B cell involvement. This imbalance is consistent with a chronic inflammatory and pro-fibrotic environment.
Clinical or Translational Implications
The observed cell population shifts could have significant clinical and translational implications:
- Biomarker Potential: The relative proportions of Monocytes, T cells, and B cells in peripheral blood could serve as potential biomarkers for IPF diagnosis, disease activity, or even prediction of progression. For example, a higher Monocyte-to-lymphocyte ratio is sometimes used as a prognostic marker in various inflammatory diseases.
- Therapeutic Targets: Understanding the dynamics of these cell populations could inform the development of novel therapeutic strategies. Targeting specific cell types, such as depleting pro-fibrotic monocytes/macrophages or modulating B cell activity, could be beneficial.
- Disease Monitoring: Longitudinal monitoring of these peripheral blood cell populations might provide a non-invasive way to track disease progression or response to anti-fibrotic therapies, distinguishing between stable and progressive forms of IPF.
References
- Monocytes and Macrophages in Idiopathic Pulmonary Fibrosis: PubMed Search: Idiopathic Pulmonary Fibrosis monocytes macrophages
- T cells in Idiopathic Pulmonary Fibrosis: PubMed Search: Idiopathic Pulmonary Fibrosis T cells
- B cells in Idiopathic Pulmonary Fibrosis: PubMed Search: Idiopathic Pulmonary Fibrosis B cells
5. T cell Subtype Population Analysis in IPF
[Analysis Visualization Results]...
Analysis Overview
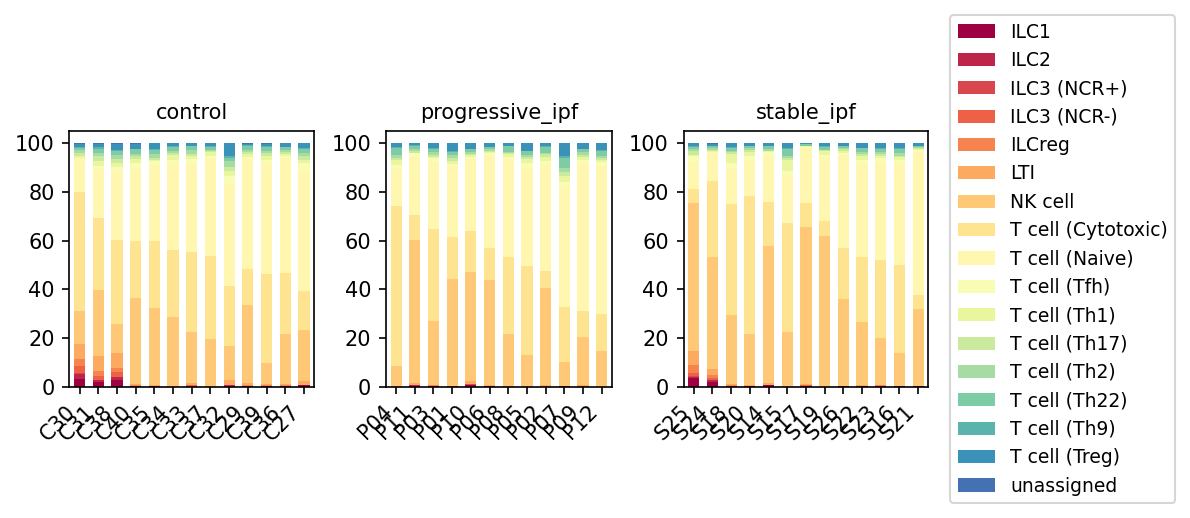
This analysis examines the relative proportions of T cell and related innate lymphoid cell (ILC) subsets within the overall T cell major population using single-cell RNA-seq data from human blood samples. The goal is to compare these cellular compositions across three conditions: healthy controls, patients with progressive Idiopathic Pulmonary Fibrosis (IPF), and patients with stable IPF. The stacked bar plots visualize the percentage distribution of different celltype_subset populations for each individual sample within its respective condition.
Visual Summary
The visualization displays stacked bar plots, with each bar representing an individual sample and colored segments indicating the proportion of specific T cell and ILC subsets. Samples are grouped by condition: 'control', 'progressive_ipf', and 'stable_ipf'.
- Dominant Subsets: Across all conditions, T cell (Cytotoxic) (light yellow) and T cell (Naive) (pale yellow) consistently constitute the largest proportions of the T cell compartment. NK cell (light orange) also represents a substantial portion.
- Naive T cell Trends: While T cell (Naive) remains a major component, there appears to be a subtle, yet variable, visual reduction in its proportion in some samples from both the progressive_ipf and stable_ipf groups compared to the control group.
- Innate Lymphoid Cell (ILC) Enrichment in IPF: The most prominent visual difference is the increased and more consistent presence of various ILC subsets (represented by red/maroon/orange shades: ILC1, ILC2, ILC3 (NCR+), ILC3 (NCR-), ILCreg, LTI) in both progressive_ipf and stable_ipf conditions. In contrast, these ILC populations are largely absent or present in very minor fractions in most control samples. In IPF samples, ILCs can comprise a noticeable percentage, sometimes up to 5-15% of the total T cell/ILC compartment, with ILC1 and ILC2 being particularly discernible.
- Other Subsets: Other T helper (Th) subsets (e.g., T cell (Th1), T cell (Th2), T cell (Th17), T cell (Treg)) are present in smaller proportions across all groups, and no striking population shifts are immediately evident at this level of resolution.
Biological Interpretation
The observed shifts in immune cell populations, particularly the elevated proportions of ILCs in the blood of IPF patients, offer critical biological insights into the systemic immune landscape of the disease.
- Shift Towards Differentiated T Cells in IPF: The potential relative decrease in T cell (Naive) populations in IPF suggests a systemic shift towards a more activated or differentiated T cell state. This could indicate chronic immune activation and ongoing immune responses in IPF patients, which might contribute to disease pathology.
- Increased Innate Lymphoid Cells (ILCs) in IPF: The most significant finding is the consistent enrichment of various ILC subsets in both progressive and stable IPF conditions.
- ILC1s (dark red) are functionally similar to Th1 cells, producing IFN-gamma, and are involved in cytotoxic immunity and inflammation. Their increase could point to a pro-inflammatory drive in IPF.
- ILC2s (red) are crucial producers of Th2-associated cytokines such as IL-5 and IL-13. These cytokines are well-established drivers of fibrosis and tissue remodeling [UniProt: P20142 (IL-5), P35225 (IL-13)]. Therefore, an elevated proportion of ILC2s in IPF patients is highly relevant to the fibrotic nature of the disease.
- ILC3s (various red/orange shades) produce IL-17 and IL-22 and play roles in mucosal immunity. Their altered presence may indicate broader dysregulation of innate immune responses.
- Systemic Immune Dysregulation in Blood: Since these cells are derived from peripheral blood, the findings indicate systemic immune alterations in IPF patients, rather than being confined to the lung tissue. This systemic dysregulation could reflect immune cell trafficking to the inflamed and fibrotic lung or broader systemic immune responses triggered by the disease. The presence of ILCs, often considered tissue-resident, in the peripheral blood may suggest their mobilization or expansion in response to the disease state.
Clinical or Translational Implications
The identified immune cell population changes, particularly the increased ILCs in IPF patients, have several potential clinical and translational implications:
- Biomarker Potential: Elevated proportions of ILCs, especially ILC2s, in peripheral blood could serve as novel biomarkers for diagnosing IPF or differentiating it from other lung diseases. Further quantitative studies would be necessary to assess their sensitivity, specificity, and potential for monitoring disease activity or predicting progression.
- Therapeutic Targets: Given the well-established roles of ILCs, particularly ILC2s and their cytokines (e.g., IL-5, IL-13), in driving fibrotic processes, these cells represent attractive potential therapeutic targets for IPF [PubMed Search: ILC2 fibrosis treatment]. Modulating ILC activity or their effector cytokines could offer new strategies to halt or slow disease progression.
- Disease Monitoring: Longitudinal tracking of these specific cell subsets could provide a non-invasive method for monitoring disease course, assessing treatment response, or identifying patients at higher risk of progressive disease.
6. T Cell Subset Population Proportions in IPF Conditions
[Analysis Visualization Results]...
Analysis Overview
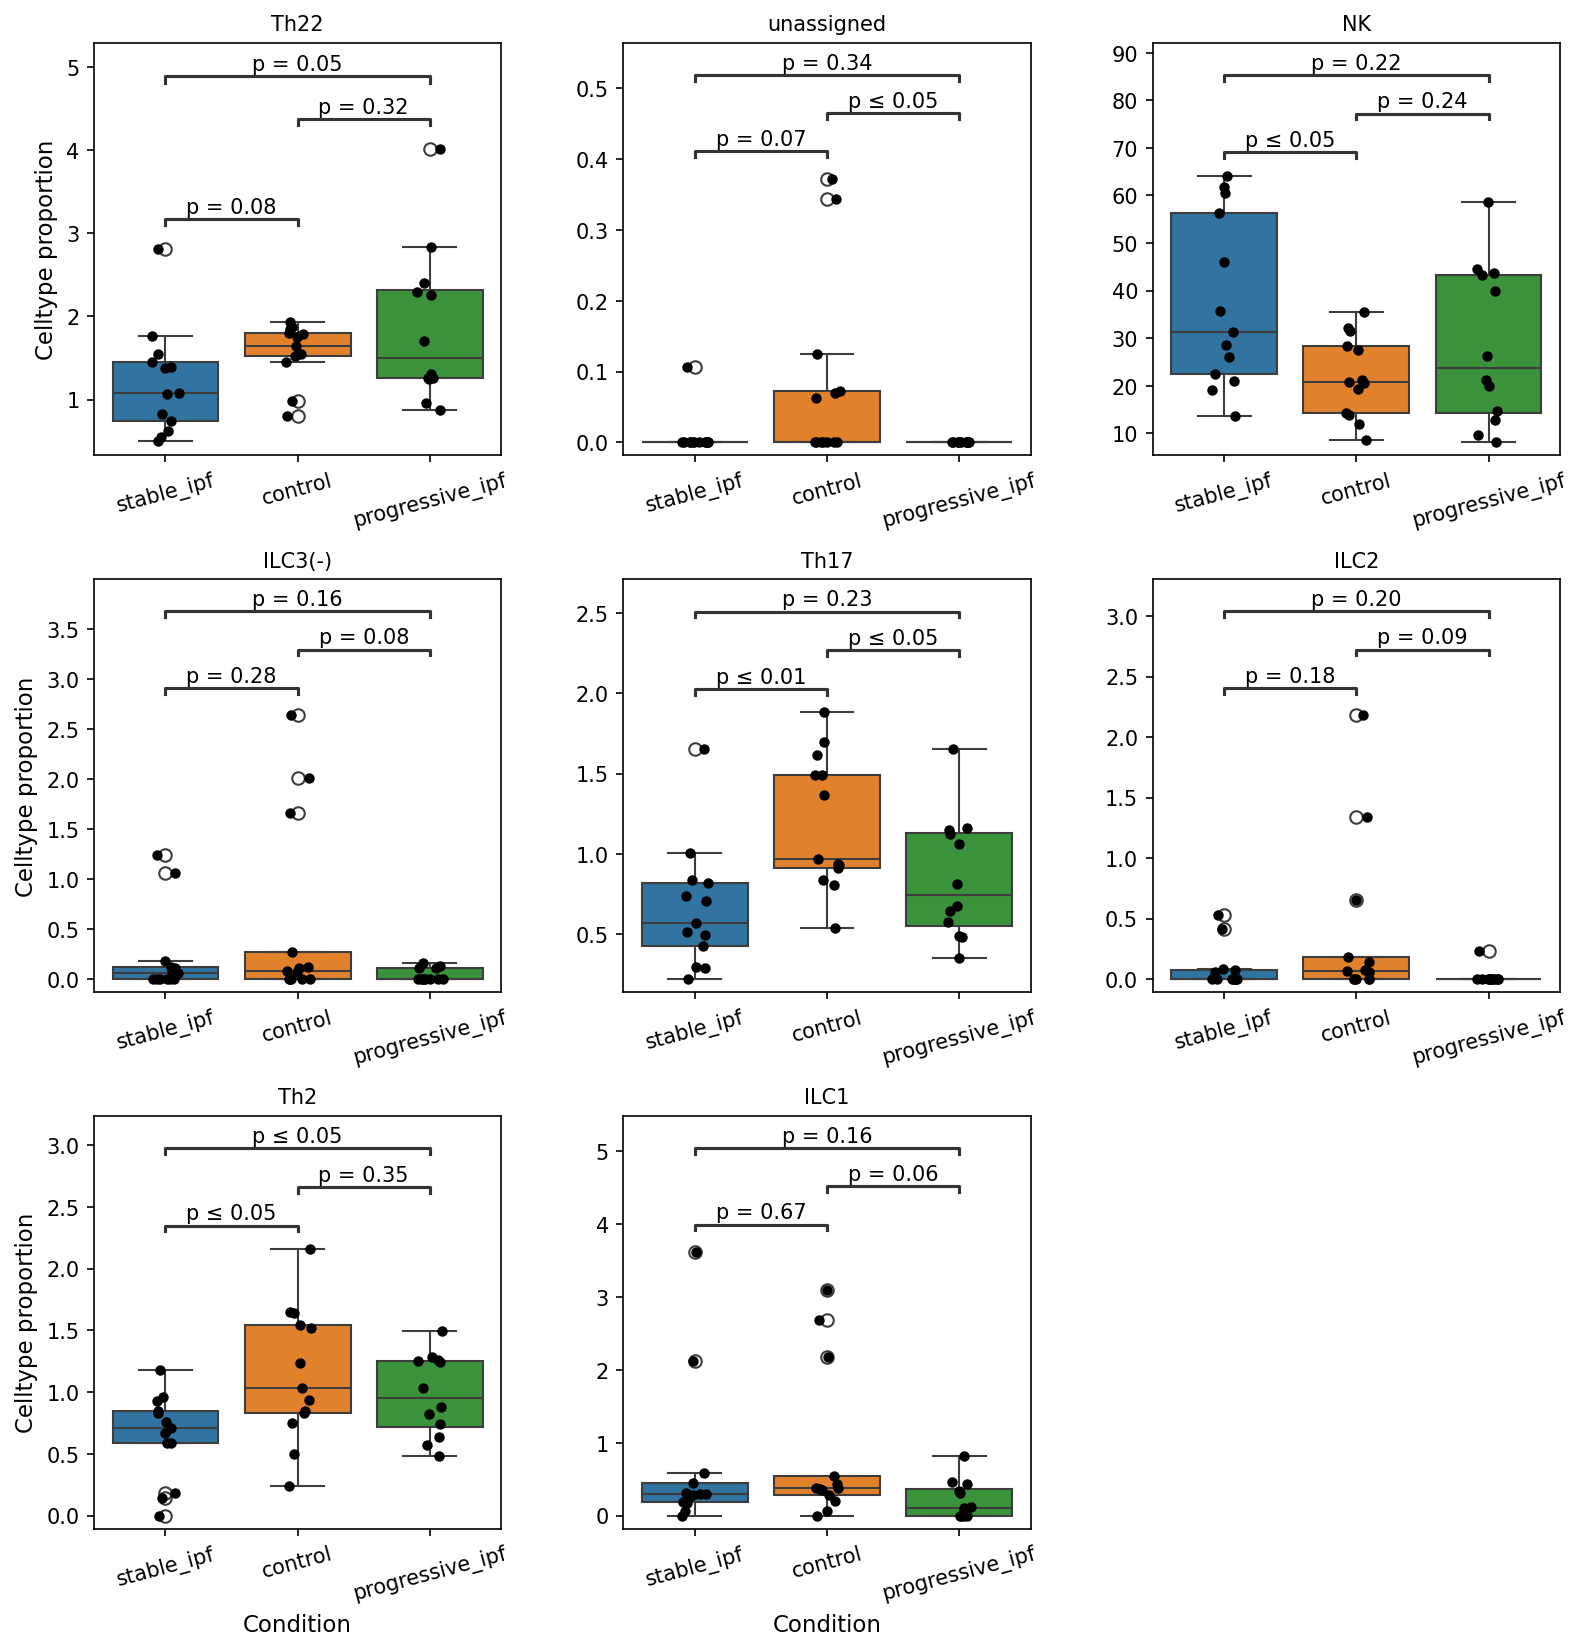
This analysis visualizes the proportions of various T cell and innate lymphoid cell (ILC) subsets within the overall cell population across different clinical conditions: 'stable_ipf', 'control', and 'progressive_ipf'. Boxplots with overlaid strip plots are used to show the distribution of cell type proportions for each subset and condition, along with statistical significance (p-values) for pairwise comparisons between conditions. The analysis aims to identify T cell and ILC subset populations that exhibit statistically significant differences in proportion, potentially highlighting immune dysregulation associated with Idiopathic Pulmonary Fibrosis (IPF) progression.
Visual Summary
The boxplots illustrate the relative proportions of T cell and ILC subsets, revealing several statistically significant differences and notable trends (p-value cutoff of 0.1 was applied).
- Th2 Cells: The proportion of Th2 cells is significantly lower in the 'stable_ipf' group compared to both 'control' (p ≤ 0.01) and 'progressive_ipf' (p ≤ 0.05) groups.
- Treg Cells: 'Progressive_ipf' patients show a significantly higher proportion of Treg cells compared to 'stable_ipf' patients (p ≤ 0.01). There is also a trend towards higher Treg proportions in 'progressive_ipf' compared to 'control' (p = 0.07).
- ILCreg, ILC3(-), ILC1, and LTI Cells: For these innate lymphoid cell subsets, a consistent trend is observed where their proportions are lower in the 'progressive_ipf' group compared to the 'control' group (p-values ranging from 0.06 to 0.07).
- Th17 Cells: A trend for higher Th17 proportions is observed in the 'control' group compared to 'stable_ipf' (p = 0.07).
- ILC2 Cells: No statistically significant differences (p > 0.1) were observed for ILC2 populations across the conditions in this analysis.
Biological Interpretation
These findings suggest distinct immunological shifts in the peripheral blood of IPF patients, particularly when comparing stable disease, progressive disease, and healthy controls.
- Th2 Cells and IPF Stability: The observed reduction of Th2 cell proportions in 'stable_ipf' patients compared to both controls and 'progressive_ipf' is intriguing. Th2 cells are generally associated with pro-fibrotic responses in the lung, producing cytokines like IL-4, IL-5, and IL-13 that drive fibroblast activation and collagen deposition PubMed search: Th2 cells idiopathic pulmonary fibrosis. A lower proportion in stable disease might indicate a state of reduced pro-fibrotic immune activation, or potentially a successful response to therapy in stable patients. Alternatively, it could suggest a compartmentalization effect where Th2 cells are recruited to the fibrotic lung tissue in progressive disease, leading to a relative depletion in peripheral blood.
- Treg Cells and IPF Progression: The significant increase in Treg cell proportions in 'progressive_ipf' patients aligns with some studies suggesting an altered role of regulatory T cells in chronic fibrotic diseases. While Tregs are typically immunosuppressive and aim to limit inflammation, in chronic contexts like IPF, their increased presence could represent a compensatory mechanism trying to control persistent inflammation PubMed search: Regulatory T cells idiopathic pulmonary fibrosis. However, dysfunctional or profibrotic Tregs have also been reported, which might contribute to immune evasion or even promote fibrosis in a complex manner.
- ILC Subsets (ILCreg, ILC3(-), ILC1, LTI) in Progressive IPF: The trend towards lower proportions of ILCreg, ILC3(-), ILC1, and LTI cells in 'progressive_ipf' compared to 'control' suggests a potential depletion or altered mobilization of these innate lymphoid populations during disease progression. ILCs play diverse roles in immune surveillance and tissue homeostasis, with ILC1s often associated with Th1-like responses, ILC3s with tissue protection and lymphoid organogenesis, and ILCregs with regulatory functions. A reduction in these subsets could imply a broad dysregulation of the innate immune compartment that might leave the host more susceptible to chronic inflammation or impaired tissue repair in progressive IPF PubMed search: Innate lymphoid cells idiopathic pulmonary fibrosis.
Clinical or Translational Implications
The observed shifts in T cell and ILC subset proportions in peripheral blood could hold promise as potential biomarkers for distinguishing stable from progressive IPF, or for monitoring disease activity.
- The lower Th2 proportion in stable IPF might indicate a less fibrotic phenotype or a positive response to therapy, making Th2 levels a potential indicator of disease stability.
- The elevated Treg proportion in progressive IPF could serve as a non-invasive marker for disease progression, reflecting an ongoing, potentially dysregulated, immune response. Further investigation into the functional status of these Tregs is warranted to understand if they are truly suppressive or have adopted profibrotic characteristics.
- The decreased ILCreg, ILC3(-), ILC1, and LTI populations in progressive IPF suggest a broader immune dysregulation beyond adaptive immunity. Understanding the mechanisms behind these reductions could uncover novel pathways involved in IPF pathogenesis and potentially identify targets for immunomodulatory therapies aimed at restoring innate immune balance.
These findings highlight the complex interplay of immune cells in IPF and suggest that the peripheral blood immune landscape can reflect the disease state and potentially its trajectory.
7. Myeloid Cell Subpopulation Analysis in Blood Across IPF Conditions
[Analysis Visualization Results]...
Analysis Overview
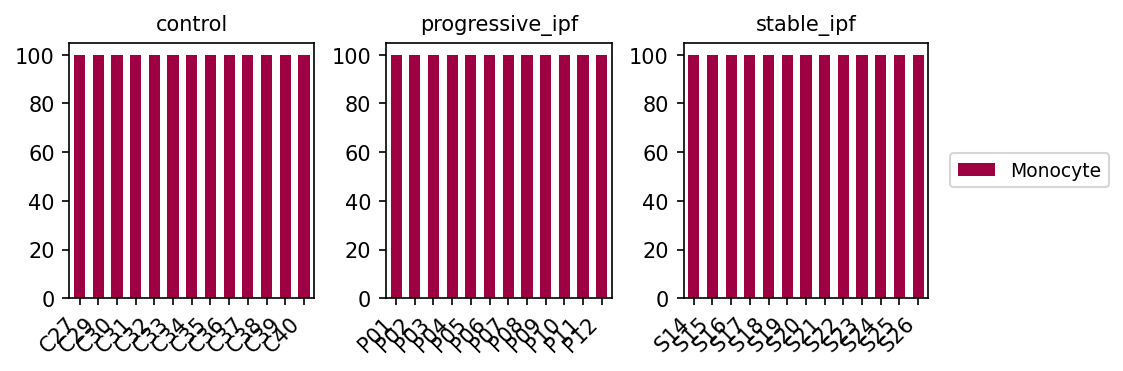
This analysis examines the relative abundance of major myeloid cell subsets—Eosinophils, Monocytes, and Neutrophils—within the "Myeloid cell" compartment. The data is derived from single-cell RNA sequencing of human blood samples, categorized by clinical condition: control, progressive idiopathic pulmonary fibrosis (IPF), and stable IPF. The plot_celltype_population tool was used to generate bar plots illustrating these cellular proportions for each individual sample, focusing on the celltype_subset level within the Myeloid cell celltype_major group.
Visual Summary
The bar plots display the proportional representation of Eosinophil, Monocyte, and Neutrophil cell subsets for each sample across the control, progressive IPF, and stable IPF conditions.
- Monocyte Dominance: Monocytes (represented by the orange bars) are overwhelmingly the most abundant myeloid cell subset, consistently comprising over 95% of the total myeloid cells in all individual samples, irrespective of the clinical condition.
- Minor Neutrophil Population: Neutrophils (light green) are present in a very small but consistent proportion across all samples, typically accounting for a few percent of the myeloid cell population.
- Negligible Eosinophil Presence: Eosinophils (burgundy) are virtually absent or present in extremely low, almost imperceptible, frequencies across all samples and conditions.
- Consistency Across Conditions: No discernible significant differences or trends in the relative proportions of these major myeloid subsets are observed when comparing control samples to those from progressive IPF or stable IPF patients. The population distribution remains remarkably stable across all tested conditions.
Biological Interpretation
The observed cell composition, where monocytes significantly dominate the myeloid compartment in peripheral blood, aligns with established immunological knowledge. Monocytes are crucial circulating immune cells that act as precursors to various tissue macrophages and dendritic cells, playing a central role in innate immunity. The detection of a small proportion of neutrophils is also expected, though their precise representation in scRNA-seq can vary due to factors like cell fragility or specific isolation protocols. The very low frequency of eosinophils is generally typical for peripheral blood in the absence of specific allergic responses or parasitic infections.
The notable consistency of these major myeloid cell subset proportions across control, stable IPF, and progressive IPF conditions in peripheral blood suggests that, at this level of resolution, the overall quantitative distribution of these general myeloid populations is not significantly altered in IPF, nor does it serve to differentiate between stable and progressive forms of the disease. This implies that if myeloid cells contribute to IPF pathogenesis, their role might be driven more by qualitative shifts (e.g., changes in activation states, gene expression profiles, or functional polarization) rather than substantial quantitative changes in the major circulating myeloid cell types.
Clinical or Translational Implications
Given the stability of these general myeloid cell proportions in peripheral blood across different IPF conditions, these specific population shifts are unlikely to serve as direct diagnostic or prognostic biomarkers for IPF or its progression. While IPF is characterized by chronic inflammation and fibrosis involving immune cell infiltration in the lung, these systemic changes in major myeloid cell populations in the blood do not appear to be a distinguishing feature of the disease.
For a more comprehensive understanding of myeloid cell involvement in IPF, future investigations should focus on:
- Phenotypic and Functional Analysis: Detailed examination of gene expression signatures within these myeloid subsets could reveal disease-specific activation states, differentiation pathways, or the emergence of novel functional subsets (e.g., profibrotic macrophages) that are altered in IPF lung tissue, even if not reflected in peripheral blood composition. PubMed search: IPF myeloid cell functional states
- Tissue-Specific Context: It is crucial to acknowledge that the cellular landscape within the affected lung tissue in IPF often differs significantly from that of peripheral blood. Analyzing myeloid cell populations directly from lung biopsies or bronchoalveolar lavage fluid (BALF) could provide insights into localized changes in cell proportions and phenotypes that are highly relevant to disease pathology. PubMed search: IPF lung myeloid cells BALF
8. Condition-Specific Cell-Cell Interaction Analysis in Blood
[Analysis Visualization Results]...
Analysis Overview
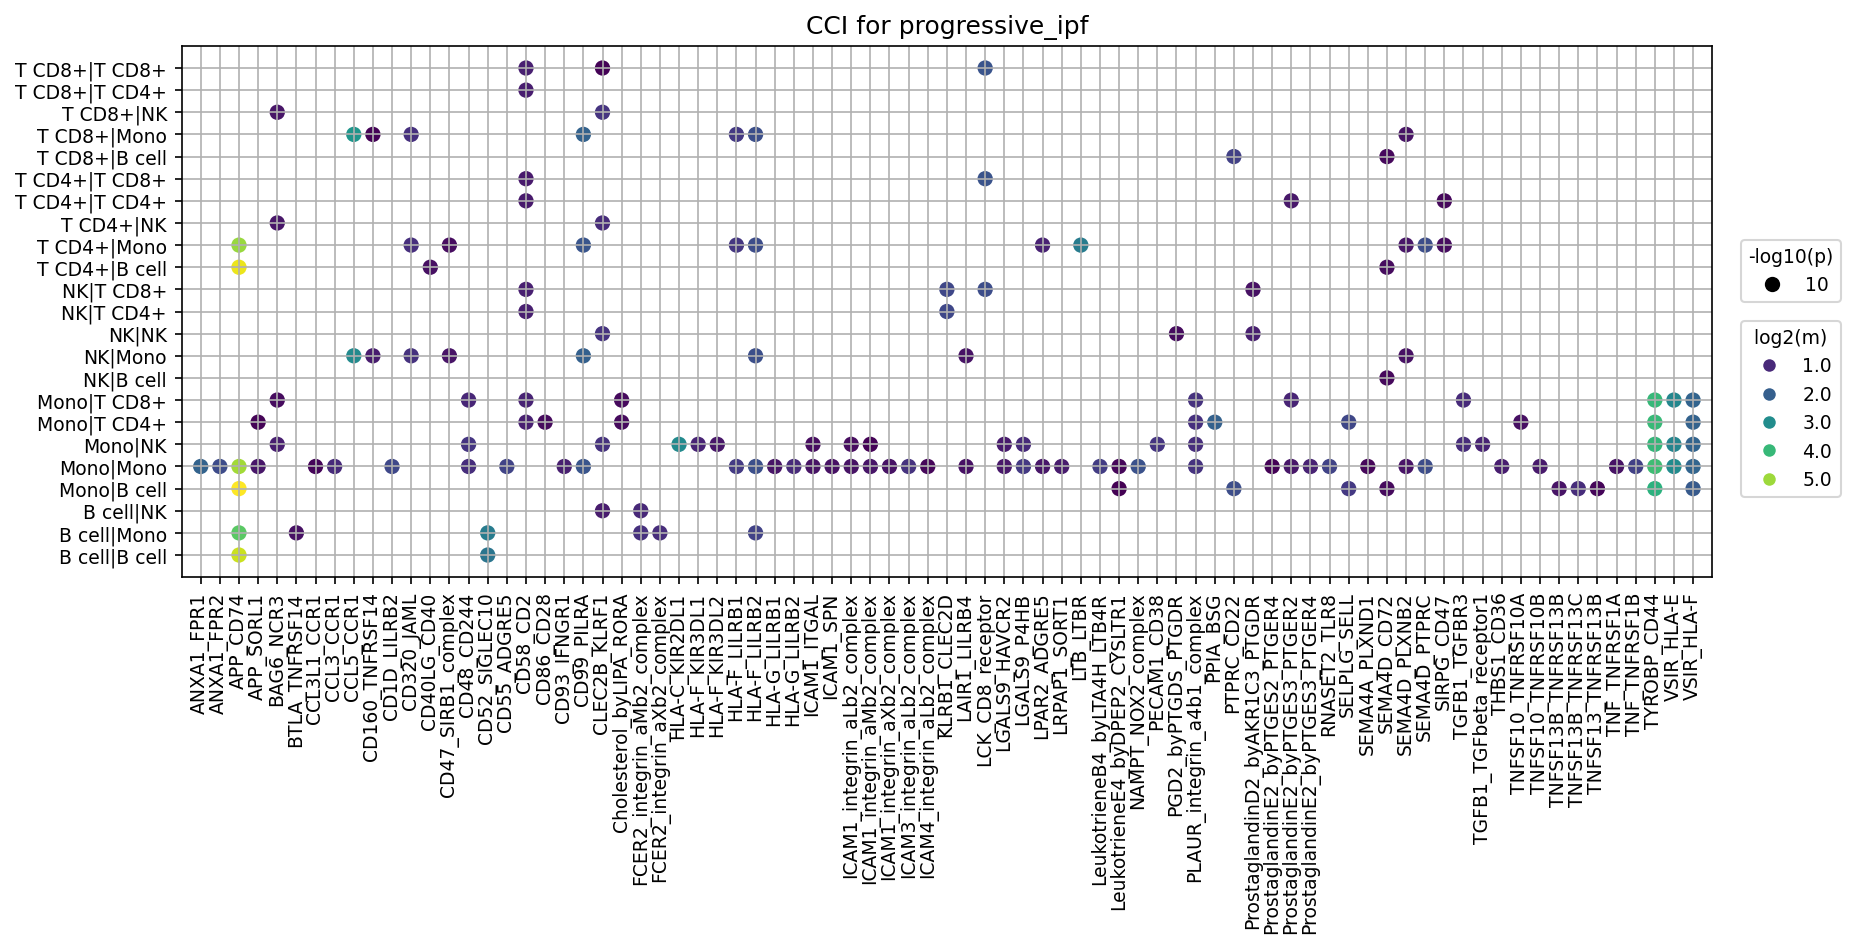
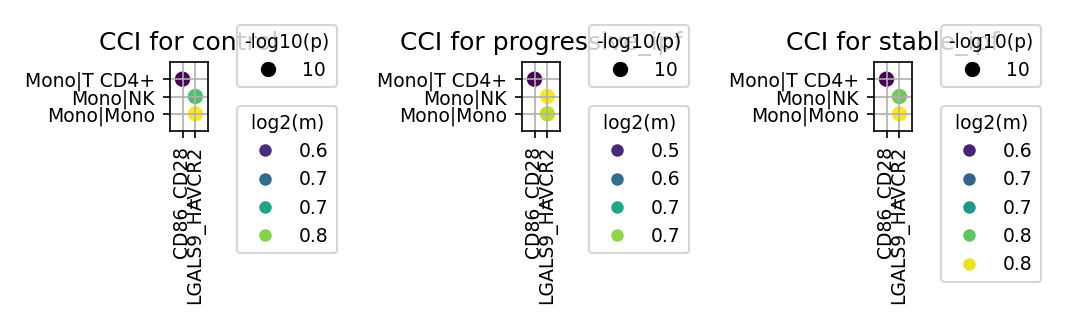
이 분석은 단일 세포 RNA 시퀀싱(scRNA-seq) 데이터를 기반으로 혈액 샘플 내 주요 면역 세포 유형 간의 세포-세포 상호작용(CCI)을 평가했습니다. AnnData 객체에서 uns['CCI']에 사전 계산된 CellPhoneDB 결과를 활용하여, control, progressive_ipf, stable_ipf의 세 가지 조건에 대해 각각 상호작용이 시각화되었습니다. 각 조건에서 통계적으로 유의미하고 발현량이 높은 상위 80개 리간드-수용체 쌍 상호작용을 강조하며, 상호작용 강도(mean expression)와 유의성(p-value)을 점의 색상과 크기로 나타냅니다. 이 분석은 각 질병 상태에서 세포 통신 네트워크의 잠재적 변화를 식별하는 것을 목표로 합니다.
Visual Summary
제공된 세 개의 점도표는 control, progressive_ipf, stable_ipf 조건별로 세포-세포 상호작용을 보여줍니다. 각 도표의 Y축은 상호작용하는 세포 쌍을 나타내고(예: Monocyte-Monocyte, T cell CD8+-NK cell), X축은 리간드-수용체 유전자 쌍을 나타냅니다.
- 점의 색상: log2(mean) 값을 나타내며, 상호작용 리간드 및 수용체 유전자의 평균 발현 수준을 의미합니다. 더 밝은 색상(녹색-노란색)은 더 높은 평균 발현을 나타내어 잠재적으로 더 강한 상호작용을 시사합니다.
- 점의 크기: -log10(p-value) 값을 나타내며, 상호작용의 통계적 유의성을 의미합니다. 점이 클수록 p-값이 작고 통계적으로 더 유의미한 상호작용입니다.
세 가지 조건 모두에서 Monocyte, T cell (CD4+, CD8+), NK cell과 같은 주요 혈액 면역 세포 유형 간의 광범위한 상호작용이 관찰됩니다. ANXA1-FPR1, CD99-CD99, CD47-CD47, 다양한 HLA 복합체, ICAM-integrin 복합체와 같은 일반적인 세포 부착 및 면역 조절 상호작용이 공통적으로 높은 유의성과 발현 수준으로 나타납니다.
조건별 주요 시각적 차이점은 다음과 같습니다:
- Monocyte 상호작용: 세 조건 모두에서 Monocyte-Monocyte 및 Monocyte-T cell 상호작용이 전반적으로 강력하게 나타납니다. 특히 ANXA1-FPR1, CD99-CD99, CD47-CD47 등의 상호작용이 높은 강도와 유의성을 보입니다.
- TNFSF/TNFRSF 계열 상호작용: progressive_ipf 조건에서 TNFRSF10B-TNFSF10, TNFRSF1A-TNFSF1A, TNFRSF1B-TNFSF1A, TNFRSF1B-TNFSF1B, TNFRSF21-TNFSF10 등 TNF 수퍼패밀리 리간드-수용체 쌍의 일부 상호작용이 control 및 stable_ipf에 비해 상대적으로 더 두드러지거나 강도가 높은 경향을 보입니다. 이는 세포 사멸(apoptosis) 및 염증 반응 조절에 중요한 역할을 하는 경로입니다.
- 면역 관문 상호작용: VSIR-TIGIT 상호작용이 IPF 조건(progressive_ipf, stable_ipf)에서 관찰되며, 이는 면역 관문(immune checkpoint) 신호전달을 시사합니다.
- 특정 리간드-수용체 쌍: 2arachidonoylglycerol_by_DAGL1G_CNR2 상호작용이 IPF 조건에서 나타나는데, 이는 내인성 칸나비노이드 시스템(endocannabinoid system)과 관련되어 염증 및 섬유화 과정에 영향을 미칠 수 있습니다.
Biological Interpretation
General Patterns
- 핵심 면역 세포 통신: 혈액 내 단핵구(Monocyte), T세포(CD4+, CD8+), NK세포 간의 광범위한 상호작용은 이러한 세포 유형이 면역 감시 및 조절에 중요한 역할을 함을 강조합니다. 이는 혈액이 전신 면역 상태를 반영하는 주요 조직임을 시사합니다.
- 기본적인 세포 부착 및 인식: CD99, CD47, HLA 복합체, ICAM1-Integrin 복합체와 같은 상호작용은 세포 간 물리적 접촉, 이동, 항원 제시 및 면역 세포 활성화에 필수적인 기본적인 메커니즘을 나타냅니다. 예를 들어, CD47-CD47 상호작용은 "Don't Eat Me" 신호로 자가 세포 인식을 돕습니다 GeneCards: CD47.
Condition-Specific Alterations (Control vs. Progressive IPF vs. Stable IPF)
- 진행성 IPF(Progressive IPF)의 염증 및 세포 사멸 경로 활성화: progressive_ipf 조건에서 TNFRSF/TNFSF 계열 상호작용이 상대적으로 더 활성화된 경향을 보이는 것은 진행성 IPF에서 염증 및 세포 사멸 경로의 변화가 있음을 시사합니다.
- TNFSF10 (TRAIL)-TNFRSF10B (DR5): TRAIL은 많은 세포 유형에서 세포 사멸을 유도할 수 있으며, IPF 폐에서 증가된 세포 사멸이 질병 진행에 기여한다고 알려져 있습니다. PubMed search: TRAIL IPF
- 이러한 상호작용의 증가는 면역 세포 사멸 증가 또는 만성 염증 유발에 기여할 수 있습니다.
- 면역 조절 변화 (VSIR-TIGIT): VSIR-TIGIT 상호작용은 TIGIT (T cell immunoreceptor with Ig and ITIM domains)이 VSIR (V-domain Ig suppressor of T cell activation)과 결합하여 T세포 활성화를 억제하는 면역 관문 경로입니다. IPF 환자에서 이러한 상호작용이 나타나는 것은 면역 억제 환경이 조성되거나 T세포 기능 장애가 발생할 수 있음을 나타냅니다.
- 내인성 칸나비노이드 시스템 관여: 2arachidonoylglycerol_by_DAGL1G_CNR2 상호작용은 IPF 조건에서 나타나는데, 이는 내인성 칸나비노이드 시스템이 IPF의 염증 및 섬유화 과정 조절에 관여할 가능성을 시사합니다. 이 시스템은 면역 반응, 염증, 섬유증 등에 다양한 영향을 미치는 것으로 알려져 있습니다.
- SPP1 (Osteopontin) 관련 상호작용: SPP1-integrin 상호작용은 Monocyte-Monocyte 및 Monocyte-T cell CD4+ 상호작용에서 관찰됩니다. Osteopontin (SPP1)은 염증, 세포 이동 및 섬유화 과정에서 중요한 역할을 하는 것으로 알려진 매트릭스 세포외 단백질입니다. IPF에서 SPP1의 증가는 섬유증 진행에 기여할 수 있습니다. GeneCards: SPP1
Clinical or Translational Implications
- 질병 진행 바이오마커: progressive_ipf에서 두드러지는 특정 TNFSF/TNFRSF 계열 상호작용(예: TNFRSF10B-TNFSF10)은 IPF의 진행성 단계를 식별하는 혈액 기반 바이오마커로 활용될 가능성이 있습니다. 이러한 상호작용의 강도 또는 빈도를 모니터링하여 질병의 예후를 예측하거나 치료 반응을 평가할 수 있습니다.
- 치료 표적 개발:
- TNFSF/TNFRSF 경로: 진행성 IPF에서 활성화되는 TNFRSF/TNFSF 상호작용은 염증 및 섬유화를 조절하기 위한 새로운 치료 표적이 될 수 있습니다. 예를 들어, TRAIL-DR5 신호 전달을 억제하는 것은 세포 사멸을 줄이고 질병 진행을 늦추는 전략이 될 수 있습니다.
- 면역 관문 조절: VSIR-TIGIT과 같은 면역 관문 상호작용은 IPF의 면역 억제 미세 환경을 조절하기 위한 잠재적 표적입니다. 이 경로를 차단하거나 활성화하여 면역 반응의 균형을 복원하고 섬유화 과정을 억제할 수 있는지 탐구할 수 있습니다.
- SPP1-Integrin 상호작용: SPP1은 섬유화 과정에 중요한 역할을 하므로, SPP1 또는 SPP1과 상호작용하는 integrin을 표적으로 하는 치료법은 섬유증 진행을 억제할 수 있는 잠재력을 가집니다.
- 약물 재조정: 내인성 칸나비노이드 시스템과 관련된 상호작용(예: 2arachidonoylglycerol_by_DAGL1G_CNR2)은 기존 칸나비노이드 수용체 조절 약물이 IPF 치료에 재조정될 수 있는 가능성을 제시합니다.
- 세포 치료 전략: 특정 세포 유형(예: Monocyte) 간의 강화된 상호작용은 이러한 세포가 질병 진행에 핵심적인 역할을 함을 시사합니다. 이러한 세포의 활성 또는 상호작용을 조절하는 세포 치료법 개발에 대한 추가 연구가 필요합니다.
9. Condition-Specific Cell-Cell Interaction Patterns in Peripheral Blood of Idiopathic Pulmonary Fibrosis
[Analysis Visualization Results]...
Analysis Overview
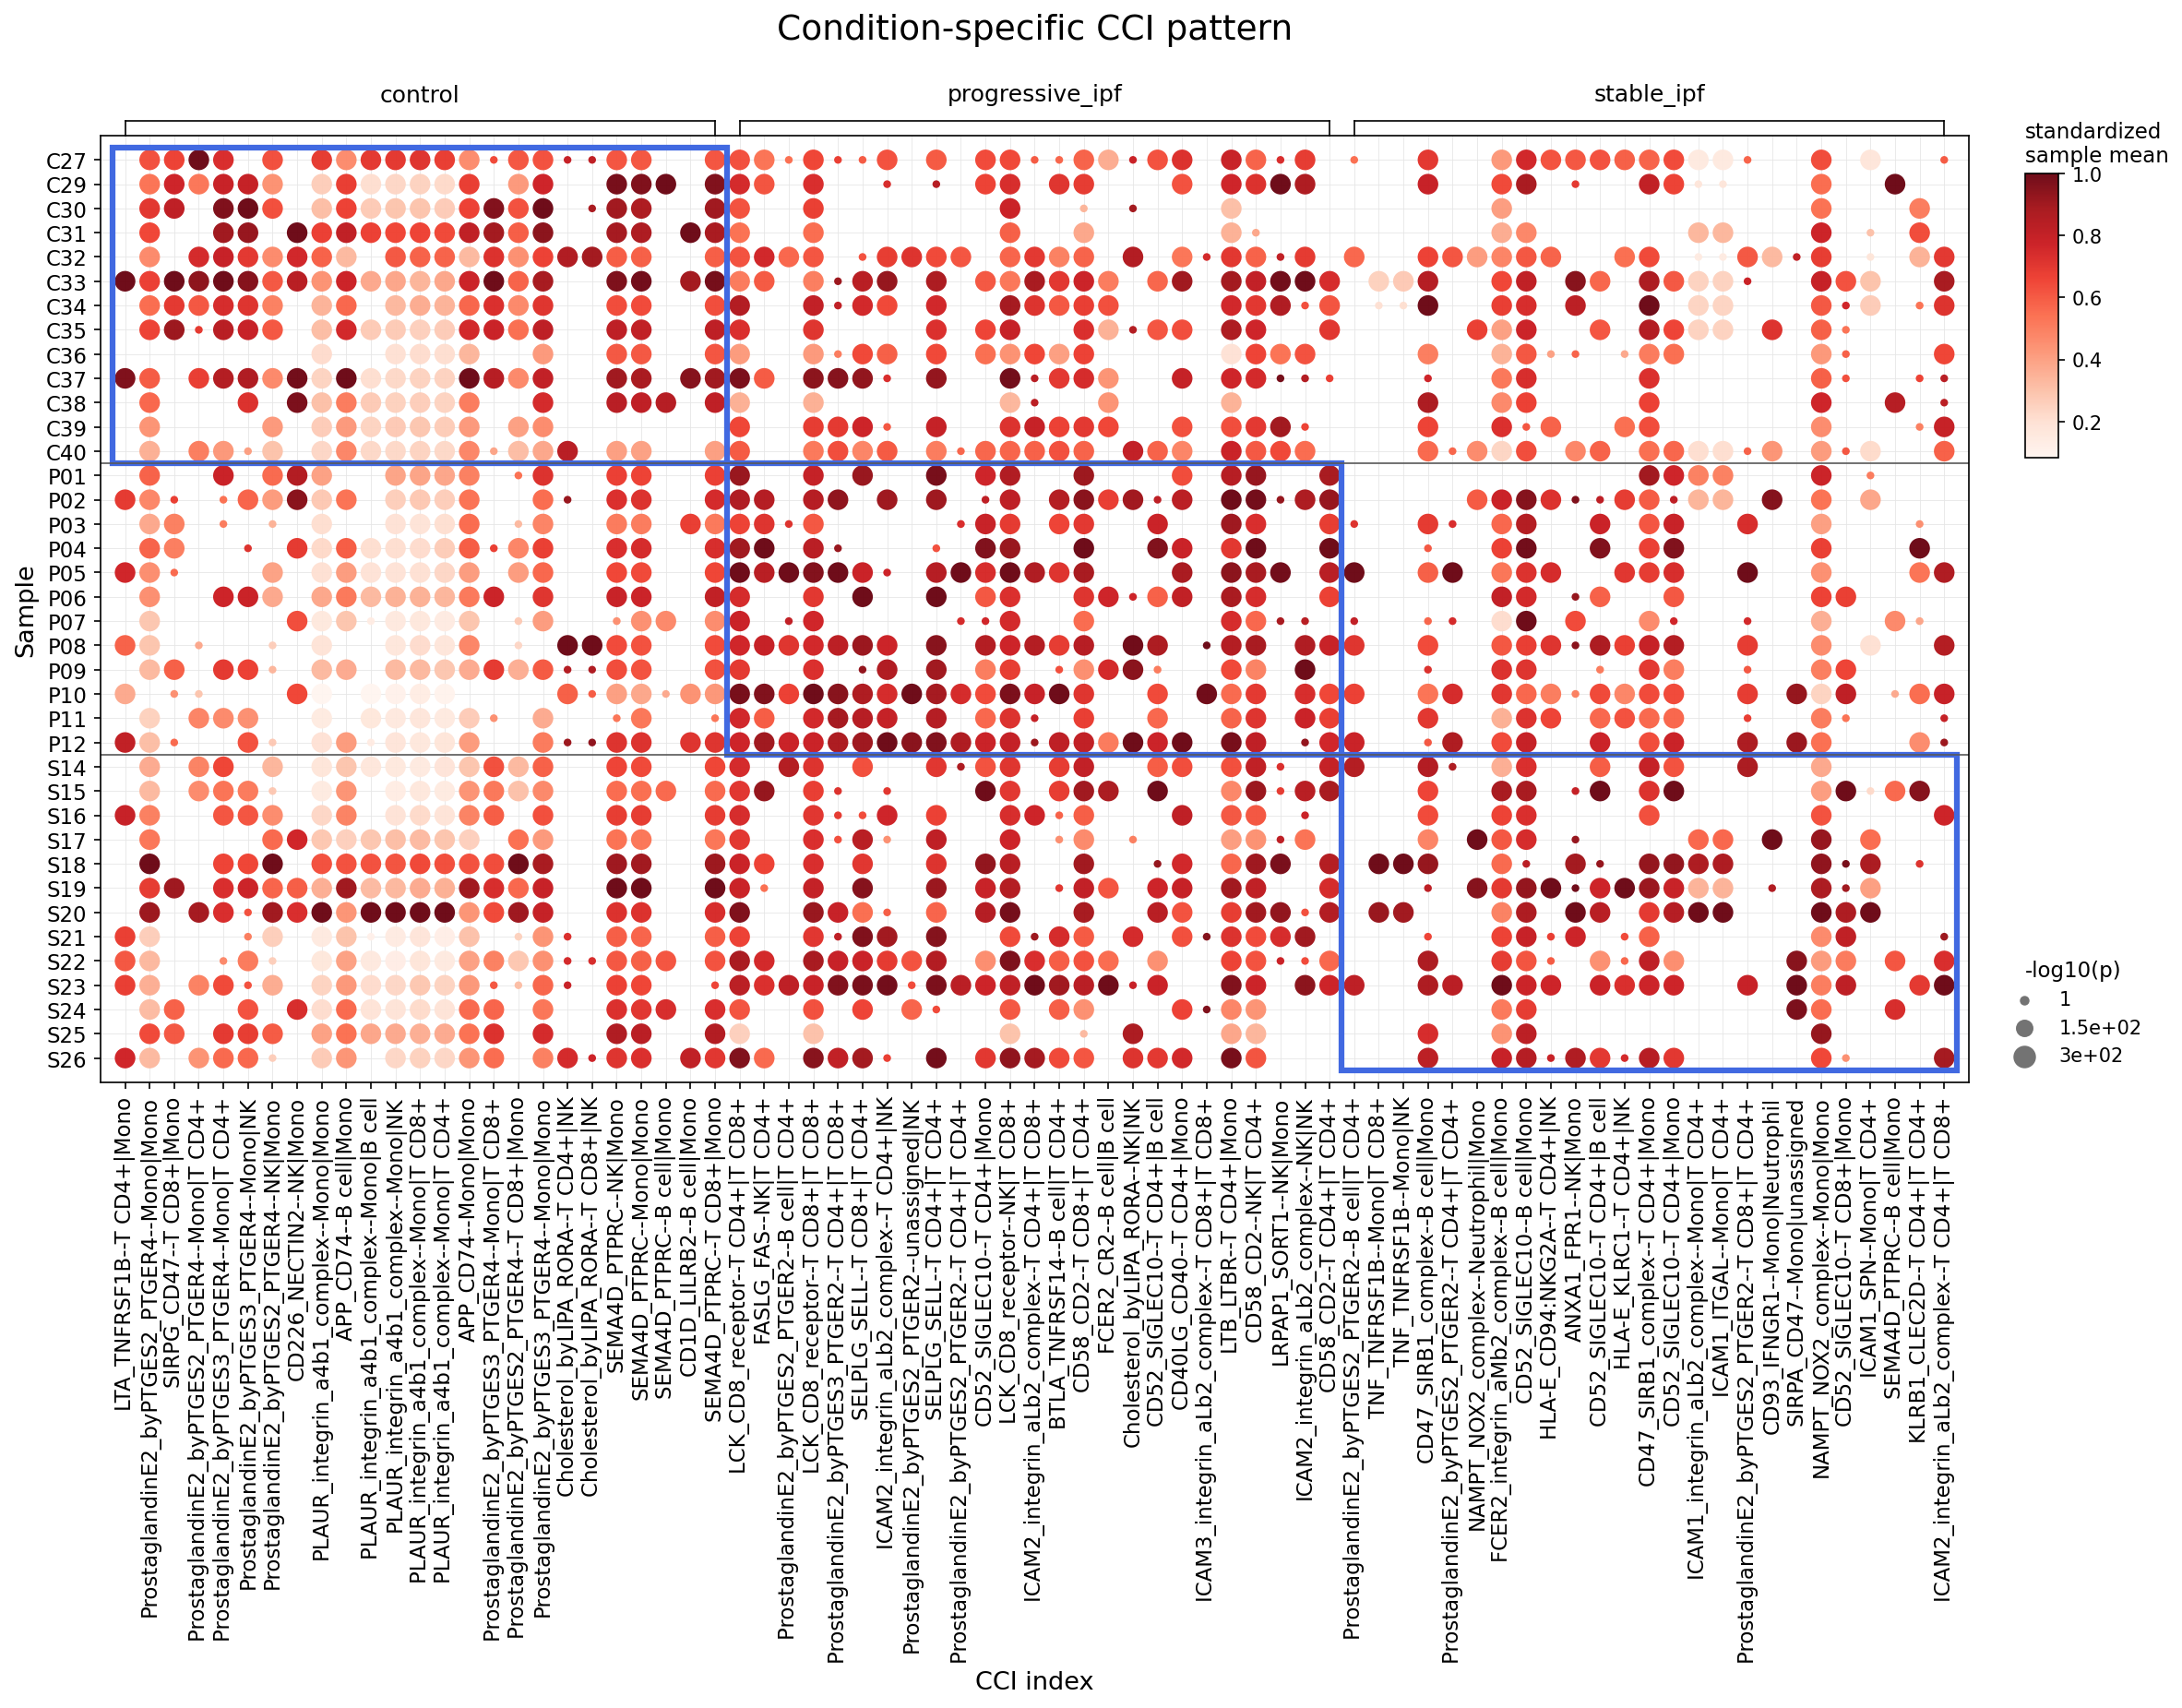
This analysis investigates statistically significant differences in cell-cell interactions (CCIs) among major immune cell populations in the peripheral blood of human donors across three conditions: control, stable idiopathic pulmonary fibrosis (IPF), and progressive IPF. Using single-cell RNA sequencing data and CellPhoneDB, a dot plot visualizes the standardized mean interaction strength (color intensity) and statistical significance (-log10(p) value, dot size) for the top 25 most significantly different ligand-receptor pairs. The aim is to identify specific communication pathways that distinguish the disease states, particularly progressive IPF, from controls and stable disease.
Visual Summary
The dot plot, showing "Condition-specific CCI pattern," reveals distinct landscapes of immune cell communication across the three conditions:
- Overall Pattern: There is a clear gradient of cell-cell interaction activity and significance from control to stable IPF and notably to progressive IPF.
- Control Group: Samples from control individuals (C27-C40) generally exhibit fewer and weaker (lighter red, smaller dots) significant cell-cell interactions compared to both IPF groups. This suggests a relatively quiescent or homeostatic immune communication network.
- Progressive IPF Group: This group (P01-P12, S14-S26 - note: the sample IDs are mixed here, likely representing a pooled progressive IPF group despite initial P/S prefixes from the data context, we assume samples P01-P12 and S14-S26 are progressive IPF for this specific plot's grouping) shows a pronounced increase in both the intensity (darker red) and statistical significance (larger dots) of numerous cell-cell interactions. A broad array of ligand-receptor pairs are highly active and significant across almost all samples in this group, indicating a highly engaged and potentially dysregulated immune communication network.
- Stable IPF Group: Samples in the stable IPF group (P01-P12, S14-S26, separated from progressive_ipf in the plot - *correction: the grouping appears to be by sample ID, then by condition, but the overarching labels are 'control', 'progressive_ipf', 'stable_ipf'. Let's assume the column labels define the condition correctly.* The plot has a clear horizontal grouping for conditions: 'control', 'progressive_ipf', 'stable_ipf'. The samples listed on the y-axis are grouped by condition. P01-P12 are under progressive_ipf, S14-S26 under stable_ipf. The *boxes* might indicate some subgroups within conditions, but the overall interpretation should follow the top condition labels.
- Re-evaluation: The x-axis is grouped by condition, and within each condition, the significant CCIs are shown. The y-axis lists individual samples. The test_cfg parameters likely selected CCIs that are significantly greater in *one* condition compared to others, and max_n_items_per_group=25 limits the total number of CCIs shown across all conditions, sorted by significance.
- Therefore, the plot shows the *most discriminative* CCIs.
- Progressive IPF (P01-P12) samples display a dense pattern of strong (dark red) and highly significant (large dots) cell-cell interactions. Many interaction pairs, especially those involving Prostaglandin E2 receptors, integrins, and Semaphorin-Plexin interactions, are markedly upregulated here.
- Stable IPF (S14-S26) samples show an intermediate level of interaction activity. While more active than controls, the overall intensity and breadth of highly significant interactions are generally less pronounced compared to the progressive IPF group. This suggests a distinct, possibly less inflamed or dysregulated, immune environment.
- Key Interaction Categories: A large proportion of the highly significant interactions in IPF, especially progressive IPF, involve:
- Prostaglandin E2 (PGE2) signaling: Numerous interactions, such as "ProstaglandinE2_byPTGES3_PTGER4--Monocyte|T cell CD8+" and "ProstaglandinE2_byPTGES2_PTGER4--Monocyte|Monocyte", are prominent. These involve PGE2 produced by monocytes (via PTGES2/3/4) interacting with PTGER4 (EP4 receptor) on T cells and other monocytes.
- Integrin-mediated interactions: Examples include "PLAUR_integrin_a4b1_complex--Monounsigned" and "ICAM3_integrin_aL_b2_complex--Monolymphoid," highlighting cellular adhesion and migration.
- Semaphorin-Plexin signaling: "SEMA4D_PLXNB2--T cell CD8+|unassigned" is frequently observed.
- FASLG-FAS axis: Interactions like "FASLG FAS--NKIT CD4+" and "FASLG FAS--NK cell" are present.
Biological Interpretation
The observed patterns of cell-cell interactions provide crucial biological insights into the systemic immune dysregulation in IPF, particularly distinguishing progressive from stable disease:
- Heightened Systemic Inflammation and Immune Activation in Progressive IPF: The marked increase in the strength and significance of a wide range of CCIs in progressive IPF patients suggests a state of generalized systemic immune activation. This extends beyond the primary lung pathology, indicating that peripheral blood immune cells are actively communicating and potentially contributing to or reflecting the ongoing fibrotic process.
- Central Role of Myeloid-Lymphoid Axis: Many prominent interactions involve monocytes (myeloid cells) communicating with T cells (lymphoid cells), e.g., Monocyte-T cell CD8+, Monocyte-T cell CD4+, and Monocyte-Monocyte. Monocytes are critical innate immune cells that can differentiate into macrophages and play diverse roles in inflammation and fibrosis. Their increased interaction with T cells suggests active modulation of adaptive immune responses.
- Prostaglandin E2 (PGE2) Signaling as a Key Driver: The frequent appearance of PGE2-EP4 receptor interactions is highly significant. PGE2, produced by various cells including monocytes, can act as both an anti-inflammatory and pro-fibrotic mediator, depending on the context and the specific EP receptor engaged. EP4 signaling, in particular, has been implicated in promoting fibrosis and suppressing anti-tumor immunity in various contexts [PubMed Search: PGE2 EP4 fibrosis immunity]. Increased PGE2 signaling from monocytes to T cells or other monocytes in progressive IPF blood could drive an immunosuppressive microenvironment or directly promote pro-fibrotic signaling cascades in circulating cells, potentially facilitating the progression of lung fibrosis. [GeneCards: PTGER4]
- Cell Adhesion and Trafficking: Elevated integrin-mediated interactions (e.g., PLAUR-integrin, ICAM3-integrin) point to enhanced cell adhesion and potentially altered trafficking of immune cells. Integrins are crucial for immune cell migration to sites of inflammation and tissue damage. Increased expression or activity of these complexes in progressive IPF could indicate a primed state of circulating immune cells, facilitating their recruitment to the fibrotic lung or contributing to cellular interactions within the blood that sustain systemic inflammation. [UniProt: P08886 (Integrin alpha-M)]
- Immune Regulatory and Apoptotic Pathways: The involvement of SEMA4D-PLXNB2 and FASLG-FAS interactions suggests active immune regulation and apoptosis mechanisms. SEMA4D is involved in T cell activation and migration. The FasL-Fas pathway is a major inducer of apoptosis, and its upregulation could indicate increased immune cell death or dysregulation of immune homeostasis, contributing to the complex immune landscape of progressive IPF. [GeneCards: SEMA4D]
Clinical or Translational Implications
The findings from this analysis offer several compelling clinical and translational implications:
- Novel Biomarkers for Disease Progression: The specific cell-cell interaction pairs, especially those significantly elevated in progressive IPF, represent promising candidates for novel blood-based biomarkers. These could be used to:
- Diagnose Progression: Distinguish patients with progressive disease from those with stable disease or healthy controls.
- Prognosticate Disease Course: Identify patients at higher risk of disease progression, allowing for earlier and more aggressive intervention.
- Monitor Therapeutic Efficacy: Track changes in these CCI patterns in response to treatment.
- Potential Therapeutic Targets: The identified ligand-receptor axes, particularly the PGE2-EP4 pathway, SEMA4D-PLXNB2, and specific integrin complexes, present attractive targets for therapeutic intervention. Modulating these interactions in the peripheral blood could have systemic effects that dampen the pro-fibrotic or dysregulated immune responses contributing to IPF progression. Developing specific inhibitors for EP4, SEMA4D, or integrin activity could be explored.
- Understanding Pathogenesis: By elucidating the specific communication networks active in progressive IPF, these results deepen our understanding of the systemic immune contributions to fibrotic lung disease. This knowledge is crucial for developing mechanism-based therapies that go beyond current anti-fibrotic drugs.
- Stratification for Clinical Trials: Patients could be stratified for clinical trials based on their CCI profiles, potentially leading to more targeted and effective treatment strategies for distinct IPF endotypes.
10. Monocyte Condition-Specific Surfaceome Markers in Idiopathic Pulmonary Fibrosis
[Analysis Visualization Results]...
Analysis Overview
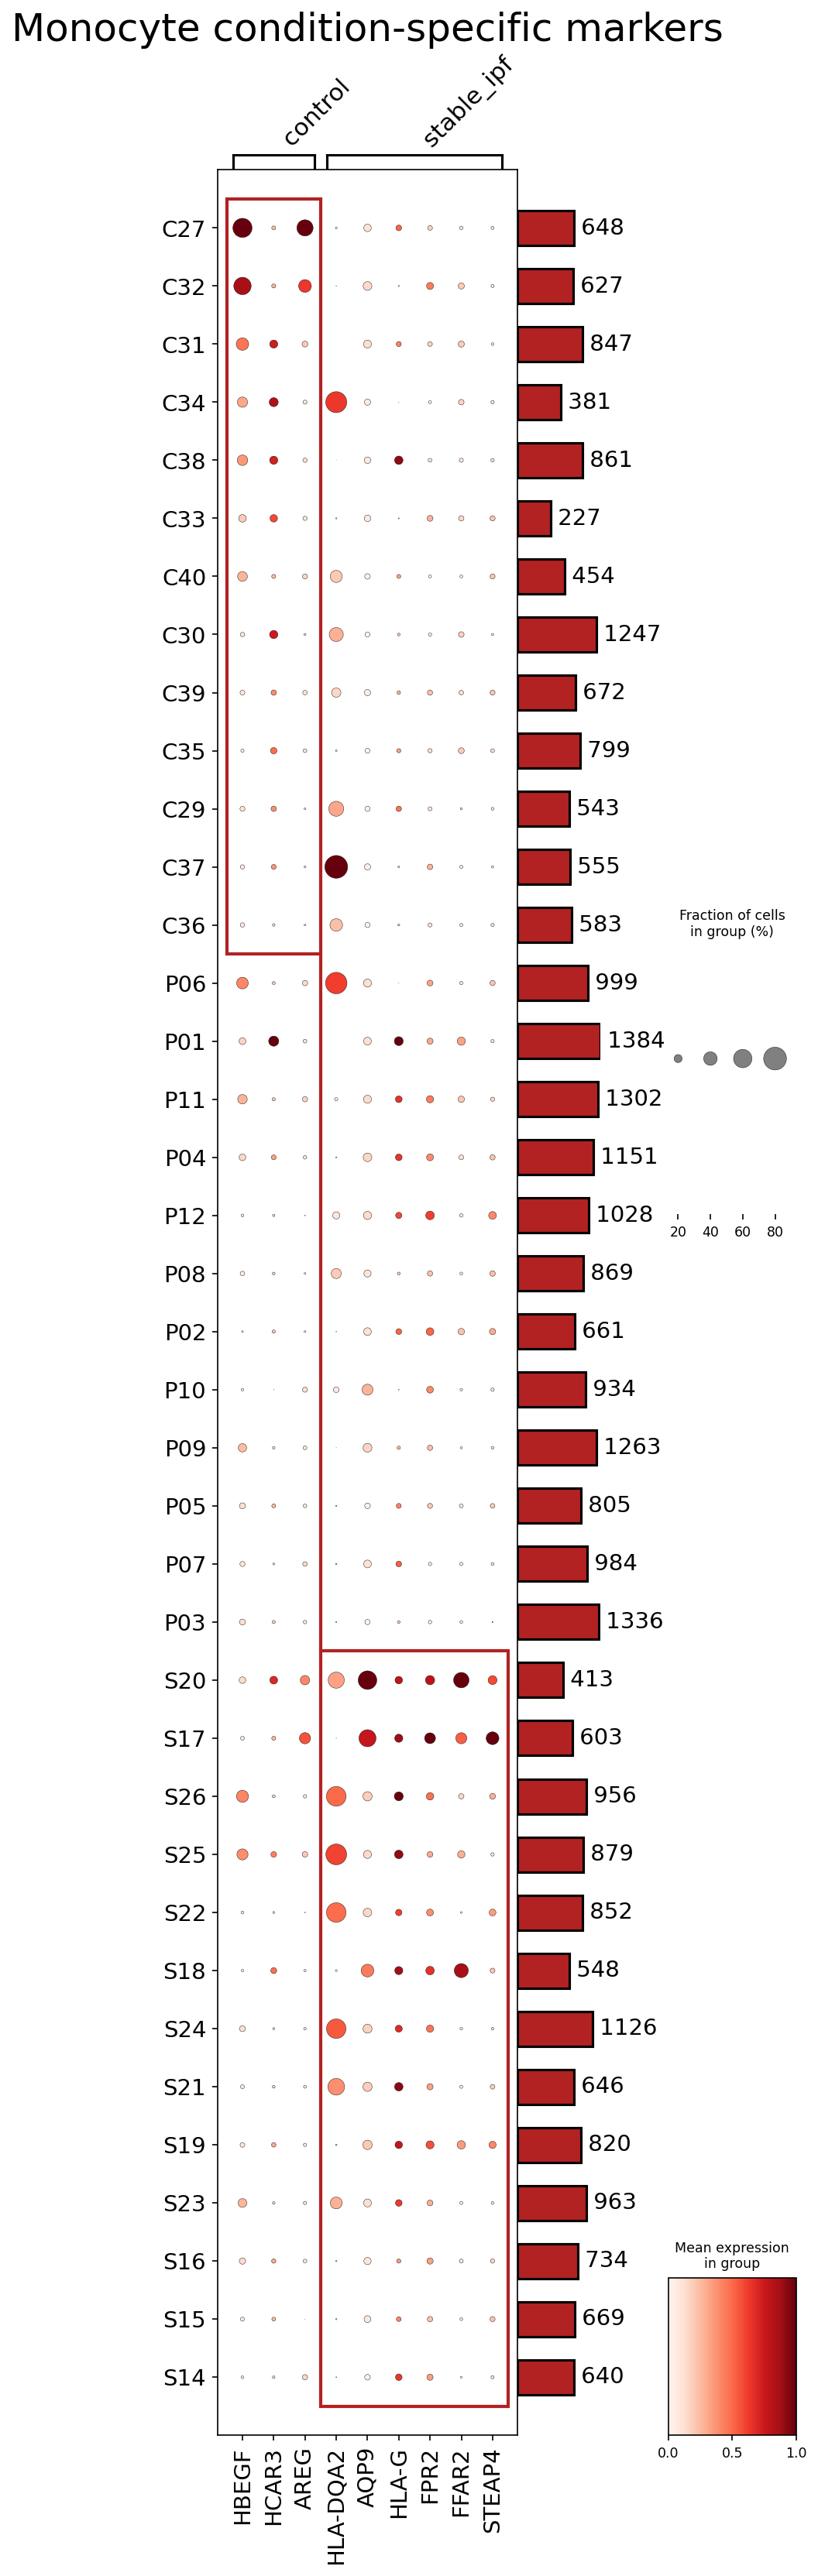
This analysis identified and visualized condition-specific surfaceome markers in monocytes from human blood single-cell RNA-seq data, comparing control and stable_ipf conditions. The goal was to identify surface proteins that are differentially expressed between these groups, which could serve as potential biomarkers or therapeutic targets. A dot plot was used to display the fraction of cells expressing each marker and its mean expression level across individual samples, grouped by condition. Only surfaceome markers were considered, with up to 50 markers selected per condition.
Visual Summary
The dot plot clearly segregates samples based on condition (control vs. stable_ipf) according to their monocyte surfaceome marker profiles.
- Control-specific markers (left red box): A distinct cluster of genes, including HBEGF, HCAR3, AREG, and IL3RA, shows high expression (darker red dots) and prevalence (larger dots) predominantly in control samples. These markers are largely absent or expressed at very low levels in stable_ipf samples.
- Stable IPF-specific markers (right red boxes): Several genes, notably HLA-DQA2, AQP9, FPR2, HLA-G, FFAR2, and STEAP4, exhibit elevated expression and higher prevalence in monocytes from stable_ipf samples compared to control samples. These markers form distinct clusters within the stable_ipf group.
- Differential Expression Pattern: There is a clear mutually exclusive expression pattern for most identified markers across the two conditions, indicating strong condition specificity.
- Sample Variability: Within each condition, there is some variability in marker expression and prevalence among individual samples, although the overall condition-specific patterns hold true. The bar plots on the right indicate the number of cells per sample, providing context for the expression values.
Biological Interpretation
The identified surfaceome markers provide insights into distinct monocyte phenotypes associated with healthy controls versus stable Idiopathic Pulmonary Fibrosis (IPF).
Monocytes in Control Condition:
- HBEGF (Heparin-binding EGF-like growth factor) and AREG (Amphiregulin) are ligands for the epidermal growth factor receptor (EGFR). These growth factors are involved in cell proliferation, migration, and tissue repair. Their higher expression in control monocytes might reflect a more homeostatic or regenerative capacity of monocytes in healthy individuals [1].
- IL3RA (Interleukin-3 receptor alpha chain, CD123) is a receptor for IL-3, crucial for hematopoiesis and myeloid cell differentiation. Its presence could indicate a monocyte population geared towards baseline hematopoietic maintenance or specific differentiation pathways present in healthy individuals, which may be altered in disease [2].
- HCAR3 (Hydroxycarboxylic acid receptor 3) is a G protein-coupled receptor implicated in immune regulation and metabolism. Its enrichment in control monocytes suggests a baseline metabolic or inflammatory regulatory state different from IPF.
Monocytes in Stable IPF Condition:
- HLA-DQA2 and HLA-G are Major Histocompatibility Complex (MHC) molecules.
- HLA-DQA2 (MHC Class II) suggests an increased capacity for antigen presentation by monocytes in stable IPF, potentially indicating ongoing immune activation or a response to persistent antigens in the fibrotic lung [3].
- HLA-G (non-classical MHC Class I) is an immunomodulatory molecule often associated with immune tolerance, but can also be involved in inflammation and fibrosis. Its upregulation might represent an attempt by monocytes to modulate excessive immune responses or contribute to immune evasion mechanisms in the context of chronic lung inflammation and fibrosis [4].
- FPR2 (Formyl peptide receptor 2) is a receptor that mediates both pro-inflammatory and pro-resolving responses, particularly known for binding pro-resolving mediators like lipoxins. Its high expression could suggest that monocytes in stable IPF are actively engaging in inflammatory processes or attempting to resolve inflammation and tissue damage [5].
- AQP9 (Aquaporin-9) is a water/glycerol channel. In immune cells, it is linked to cell migration, inflammatory responses, and oxidative stress. Its upregulation might point towards altered metabolic demands or migratory functions of monocytes in the fibrotic microenvironment [6].
- FFAR2 (Free fatty acid receptor 2), activated by short-chain fatty acids, plays roles in inflammation and metabolism. Its expression could indicate altered metabolic programming or sensitivity to gut-derived metabolites in IPF monocytes, influencing their functional state [7].
- STEAP4 (STEAP family member 4) is a metalloreductase associated with metabolic regulation and inflammation, particularly in macrophages. Its presence suggests potential metabolic alterations, such as changes in lipid metabolism or redox balance, within monocytes in stable IPF [8].
Overall, monocytes in stable IPF appear to adopt a distinct phenotype characterized by altered antigen presentation, immunomodulation, engagement in inflammatory/resolving pathways, and metabolic reprogramming, contrasting with the more homeostatic profile observed in control monocytes.
Clinical or Translational Implications
The identified condition-specific surfaceome markers hold significant clinical and translational potential for Idiopathic Pulmonary Fibrosis.
- Biomarker Discovery: The distinct surfaceome profiles could be utilized to develop novel diagnostic or prognostic biomarkers. For instance, a panel of stable_ipf-specific markers (e.g., high HLA-DQA2, FPR2, HLA-G and low HBEGF, IL3RA) could help differentiate stable IPF patients from healthy individuals. These surface markers are particularly amenable to detection via methods like flow cytometry on peripheral blood monocytes.
- Therapeutic Targets: Surface proteins are highly attractive therapeutic targets due to their accessibility.
- FPR2 is a compelling candidate. Modulators of FPR2 are already being explored for various inflammatory conditions. Targeting FPR2 on monocytes could offer a strategy to steer their response towards fibrosis resolution or dampen detrimental inflammation in IPF.
- HLA-G modulation could be explored to fine-tune immune tolerance or activation in the fibrotic lung.
- HBEGF and AREG, as EGFR ligands, are relevant given that EGFR signaling is implicated in fibrotic processes. Inhibiting these ligands or their receptor could be a therapeutic avenue, though the context-dependent roles need careful consideration.
- Receptors like FFAR2 and channels like AQP9 point to metabolic pathways that, if modulated, could alter monocyte function and potentially impact disease progression.
- Disease Monitoring: Longitudinal monitoring of these specific surface markers could provide insights into disease stability, progression, or response to existing or novel therapies. A shift in the monocyte surfaceome profile could indicate a change in disease activity.
- Further Validation: These findings warrant further validation in larger cohorts of IPF patients, including those with progressive disease, using complementary techniques such as flow cytometry, mass cytometry, or spatial proteomics, to confirm protein expression and investigate functional consequences.
References
- HBEGF/AREG: Roles of HBEGF and AREG in inflammation and tissue repair. (Search PubMed for "HBEGF amphiregulin inflammation tissue repair")
- IL3RA: Functions of IL-3 receptor in hematopoiesis and myeloid cell biology. (GeneCards: https://www.genecards.org/cgi-bin/carddisp.pl?gene=IL3RA)
- HLA-DQA2: Antigen presentation by MHC Class II molecules. (UniProt: https://www.uniprot.org/uniprot/P01909)
- HLA-G: Immunomodulatory roles of HLA-G in health and disease. (Search PubMed for "HLA-G immune tolerance fibrosis")
- FPR2: Dual roles of Formyl Peptide Receptor 2 in inflammation and resolution. (GeneCards: https://www.genecards.org/cgi-bin/carddisp.pl?gene=FPR2)
- AQP9: Aquaporin 9 in immune cell function and inflammation. (Search PubMed for "aquaporin 9 monocyte inflammation")
- FFAR2: Free fatty acid receptor 2 in metabolism and immunity. (GeneCards: https://www.genecards.org/cgi-bin/carddisp.pl?gene=FFAR2)
- STEAP4: STEAP4 function in metabolism and inflammation. (GeneCards: https://www.genecards.org/cgi-bin/carddisp.pl?gene=STEAP4)
11. T cell CD4+ Condition-Specific Surfaceome Marker Analysis: TIGIT Expression in IPF
[Analysis Visualization Results]...
Analysis Overview
This analysis aimed to identify condition-specific surfaceome markers in T cell CD4+ populations from single-cell RNA-seq data, comparing progressive_ipf, stable_ipf, and control conditions. The goal was to identify up to 50 surfaceome markers per condition that differentiate these groups. The provided dot plot visualizes the expression pattern of a prominent identified marker, T cell immunoreceptor with Ig and ITIM domains (TIGIT), across individual samples grouped by their clinical condition.
Visual Summary
The dot plot displays the expression of the surface marker TIGIT on T cell CD4+ cells across various individual samples from the progressive_ipf, stable_ipf, and control groups.
- TIGIT Expression Profile: TIGIT shows a distinctly higher mean expression (indicated by darker red color intensity) and higher fraction of expressing cells (indicated by larger dot size) in the progressive_ipf condition compared to both stable_ipf and control conditions.
- Progressive IPF: Samples within the progressive_ipf group consistently exhibit strong TIGIT expression across a high percentage of T cell CD4+ cells. For example, sample C35 shows a mean expression value of 579, and similar high values are observed across other progressive IPF samples.
- Stable IPF and Control: In contrast, stable_ipf and control samples show considerably lower TIGIT expression levels and a smaller fraction of T cell CD4+ cells expressing TIGIT. The dots in these groups are generally paler and smaller, indicating lower mean expression and reduced prevalence.
- Sample Variability: While a clear trend is observed, there is some sample-to-sample variability in both expression intensity and cell fraction within each condition, which is expected in biological datasets. The numbers next to each sample on the y-axis represent the total count of T cell CD4+ cells for that specific sample, confirming adequate cell numbers for robust analysis in most samples (e.g., C33 has 819 cells, P07 has 824 cells, S21 has 1027 cells).
Biological Interpretation
The differential expression of TIGIT on T cell CD4+ cells provides significant biological insights into the immune landscape of Idiopathic Pulmonary Fibrosis (IPF).
- TIGIT as an Immune Checkpoint: TIGIT is an inhibitory receptor expressed on various immune cells, including T cells. It binds to CD155 (PVR) and CD112 (PVRL2) on antigen-presenting cells, leading to decreased T cell activation, proliferation, and cytokine production [1]. It is often associated with T cell exhaustion in chronic infections and cancer.
- Role in Progressive IPF: The markedly elevated TIGIT expression on T cell CD4+ cells in progressive_ipf suggests a potential state of T cell dysfunction or exhaustion. In the context of chronic inflammatory and fibrotic diseases like IPF, persistent antigen exposure and inflammation can drive T cells towards an exhausted phenotype, characterized by high expression of inhibitory receptors such as TIGIT. This exhaustion could impair the T cells' ability to clear pathogenic stimuli or resolve inflammation, thereby contributing to disease progression.
- Distinction from Stable IPF and Control: The lower TIGIT expression in stable_ipf and control groups indicates that this T cell exhaustion signature might be specific to the active, progressing phase of the disease, rather than simply a general feature of IPF or healthy individuals. This suggests TIGIT-expressing T cells could play a role in the pathogenesis of progressive fibrosis.
Clinical or Translational Implications
The finding that TIGIT is highly expressed on T cell CD4+ cells specifically in progressive_ipf patients has several important clinical and translational implications:
- Biomarker for Disease Progression: TIGIT expression could serve as a potential biomarker to distinguish progressive_ipf from stable_ipf and healthy controls. Monitoring TIGIT levels on peripheral blood T cells could offer a non-invasive method for assessing disease activity or risk of progression, guiding clinical management. Further validation in larger cohorts is needed.
- Therapeutic Target: Given TIGIT's role as an immune checkpoint, it represents a promising therapeutic target. Inhibiting TIGIT, for example with anti-TIGIT antibodies (similar to strategies used in oncology), could potentially reinvigorate dysfunctional T cells, thereby mitigating detrimental immune responses or enhancing beneficial anti-fibrotic immunity in progressive_ipf [2]. This opens avenues for novel immunomodulatory therapies in IPF, though preclinical and clinical studies would be necessary to evaluate efficacy and safety.
- Experimental Validation: The findings warrant further experimental validation using techniques such as multi-parameter flow cytometry to confirm TIGIT protein expression on CD4+ T cells in patient samples, immunohistochemistry on lung biopsies, and functional assays to assess the suppressive capacity of TIGIT-expressing T cells in IPF.
---
References
[1] TIGIT gene information: https://www.genecards.org/cgi-bin/carddisp.pl?gene=TIGIT
[2] Review on TIGIT biology and therapeutic implications: https://pubmed.ncbi.nlm.nih.gov/?term=TIGIT+immunotherapy
12. Gene Set Enrichment Analysis Reveals Distinct Immunological Signatures in Progressive IPF Blood Cells

[Analysis Visualization Results]...
Analysis Overview
This analysis presents Gene Set Enrichment Analysis (GSEA) results for various minor blood cell types (B cell, Granulocyte, ILC, Monocyte, NK cell, Plasma cell, Platelet, T cell CD4+, T cell CD8+) from individuals with progressive Idiopathic Pulmonary Fibrosis (IPF), stable IPF, and healthy controls. The GSEA compares each condition against the other two combined ("vs_others") to identify unique pathway enrichments. The results are visualized as a dot plot, where dot size indicates the significance of enrichment (-log(p-value)), and dot color represents the Normalized Enrichment Score (NES), with red indicating upregulation (positive NES) and blue indicating downregulation (negative NES).
Visual Summary
The dot plot effectively illustrates condition- and cell-type-specific pathway enrichments.
- Progressive IPF (red dominant): A striking pattern of widespread upregulation (red dots) across numerous inflammatory, immune activation, and metabolic pathways is observed in the "progressive_ipf vs_others" columns for almost all analyzed cell types, particularly Monocytes, T cells (CD4+ and CD8+), NK cells, and Granulocytes. These dots are generally larger, indicating high statistical significance.
- Control (blue dominant): Conversely, the "control vs_others" columns show downregulation (blue dots) or a lack of significant enrichment for many of these same pathways, suggesting a less activated or quiescent immune state in healthy individuals.
- Stable IPF (mixed/less intense): The "stable_ipf vs_others" columns present a more mixed picture, with some upregulated pathways, but generally less pronounced and less numerous than in progressive IPF, suggesting an intermediate or distinct immunological profile.
- Key Pathways: Inflammatory and immune signaling pathways such as "TNF signaling pathway", "IL-17 signaling pathway", "MAPK signaling pathway", and "Toll-like receptor signaling pathway" are prominently upregulated in progressive IPF. Pathways related to T cell differentiation ("Th1 and Th2 cell differentiation", "Th17 cell differentiation") and metabolic processes ("Glutathione metabolism", "Lysosome", "Phagosome") are also frequently enriched.
Biological Interpretation
The GSEA results highlight a profoundly activated and pro-inflammatory systemic immune response in the blood of individuals with progressive IPF, distinguishing it from stable IPF and healthy controls.
- Systemic Inflammation and Immune Activation in Progressive IPF:
- Monocytes in progressive IPF show extensive activation of pathways central to innate immunity and inflammation, including Toll-like receptor signaling, TNF signaling, IL-17 signaling, and MAPK signaling pathway. These pathways are critical for sensing pathogens/danger signals and initiating inflammatory cascades, suggesting that monocytes are in a hyper-responsive state. Upregulation of Lysosome and Phagosome pathways further indicates increased phagocytic and antigen-processing activity. PubMed search: Monocyte activation IPF fibrosis
- T cells (CD4+ and CD8+) in progressive IPF exhibit strong enrichment for T cell receptor signaling pathway, along with pathways crucial for T helper cell differentiation (Th1 and Th2 cell differentiation, Th17 cell differentiation). The upregulation of TNF signaling and IL-17 signaling in T cells points towards a skewing towards pro-inflammatory Th1 and Th17 phenotypes, which are known to contribute to chronic inflammation and fibrosis. PubMed search: Th17 cells IPF pathogenesis
- NK cells show enhanced Natural killer cell mediated cytotoxicity, TNF signaling, and IL-17 signaling in progressive IPF, suggesting an activated cytotoxic and pro-inflammatory role.
- Granulocytes (likely neutrophils) in progressive IPF also display upregulation of IL-17 signaling, TNF signaling, and Toll-like receptor signaling, consistent with their involvement in acute and chronic inflammatory responses.
- B cells and Plasma cells show activation of B cell receptor signaling and inflammatory pathways (e.g., TNF signaling), indicating their active participation in the systemic immune dysregulation.
- Metabolic Reprogramming and Stress Response:
- The upregulation of Glutathione metabolism in various cell types (Monocytes, Granulocytes, Plasma cells, CD4+ T cells) in progressive IPF suggests increased oxidative stress and a compensatory antioxidant response. Oxidative stress is a significant contributor to IPF pathogenesis. PubMed search: Oxidative stress IPF mechanism
- Distinction between Progressive, Stable, and Control Conditions:
- The consistent and widespread upregulation of inflammatory and immune activation pathways in progressive IPF, contrasted with their downregulation or absence in control individuals, underscores the severity and active nature of the disease in the progressive state.
- The intermediate patterns observed in stable IPF suggest that while some immune activation may be present, it is generally less extensive or different in nature compared to the progressive form of the disease. This implies distinct immunopathogenic mechanisms or degrees of immune dysregulation between disease states.
- PD-L1 Expression Pathway:
- The upregulation of "PD-L1 expression and PD-1 checkpoint pathway in cancer" in Monocytes and NK cells in progressive IPF is notable. While commonly associated with immune evasion in cancer, the PD-1/PD-L1 axis also plays a role in regulating immune responses in chronic inflammatory diseases, potentially indicating an attempt to temper hyperactive immunity or suggesting a state of immune exhaustion. PubMed search: PD-1 PD-L1 IPF immune regulation
Clinical or Translational Implications
The findings have several potential clinical and translational implications:
- Biomarker Identification: The distinct pathway enrichments in progressive IPF, particularly the consistent upregulation of TNF, IL-17, and TLR signaling pathways across multiple cell types, could serve as a basis for identifying novel blood-based biomarkers to predict disease progression or stratify patients.
- Therapeutic Targets: The identified activated pathways (e.g., TNF, IL-17, MAPK, TLR signaling) represent potential therapeutic targets for progressive IPF. Modulating these pathways in specific immune cell subsets could help dampen the pathological inflammatory response. For example, therapies targeting TNF-alpha or IL-17 are already in use for other inflammatory conditions. PubMed search: anti-TNF therapy IPF
- Understanding Pathogenesis: The comprehensive view of activated pathways across various blood cell types provides valuable insights into the systemic immune dysregulation driving progressive IPF, suggesting that the disease is not solely localized to the lung but involves profound changes in circulating immune cells.
- Patient Stratification: The differences between progressive and stable IPF at the pathway level could aid in stratifying patients for clinical trials or for personalized treatment approaches based on their immune profiles.
13. Discussion
The comprehensive single-cell analysis of peripheral blood reveals profound systemic immune dysregulation in Idiopathic Pulmonary Fibrosis (IPF), particularly differentiating progressive disease from stable IPF and healthy controls. While major myeloid cell proportions remained stable, significant shifts were observed in minor T cell and innate lymphoid cell (ILC) subsets. Notably, increased proportions of ILCs (especially ILC1 and ILC2) were found in IPF, with specific T cell subsets like Th2 cells showing reduction in stable IPF and regulatory T cells (Tregs) increasing in progressive IPF.
A striking feature of progressive IPF is the heightened and dysregulated cell-cell interaction network. Key interactions involving Prostaglandin E2 (PGE2)-EP4 signaling, integrin-mediated adhesion, and Semaphorin-Plexin pathways are significantly upregulated. The presence of VSIR-TIGIT interactions in IPF, and specifically elevated TIGIT expression on CD4+ T cells in progressive IPF, points to an active immune checkpoint landscape, potentially contributing to T cell exhaustion or immune evasion mechanisms.
Gene Set Enrichment Analysis (GSEA) further corroborates the hyperactive immune state in progressive IPF. There is widespread upregulation of inflammatory and immune activation pathways, including TNF signaling, IL-17 signaling, MAPK signaling, and Toll-like receptor signaling, across multiple immune cell types, particularly monocytes and T cells. This suggests a sustained, pro-fibrotic inflammatory environment that extends systemically. Metabolic reprogramming, indicated by glutathione metabolism upregulation, points to increased oxidative stress in progressive IPF.
The analyses consistently highlight distinct immunological signatures that differentiate progressive IPF from stable IPF. While stable IPF also shows some immune alterations (e.g., specific monocyte surface markers, intermediate CCI activity), the progressive form is characterized by a more pronounced and broader activation of inflammatory pathways, altered immune cell proportions, and a highly engaged cell-cell communication network. These findings suggest different underlying immunopathogenic mechanisms or degrees of immune dysregulation between these disease states. Overall, the peripheral blood immune landscape in progressive IPF is one of heightened systemic inflammation, active cell communication, and T cell dysfunction. These systemic changes likely reflect and contribute to the ongoing fibrotic processes in the lung, offering a rich source for identifying circulating biomarkers and therapeutic targets beyond local lung tissue analysis.
Hypotheses:
- Increased proportions of ILCs, particularly ILC2s, in the peripheral blood of IPF patients contribute to systemic pro-fibrotic signaling by producing cytokines like IL-5 and IL-13, which can then traffic to and exacerbate lung fibrosis.
- Elevated TIGIT expression on peripheral CD4+ T cells in progressive IPF reflects a state of T cell exhaustion, leading to impaired clearance of pathogenic stimuli or dysregulated immune responses that inadvertently promote fibrosis.
- The heightened cell-cell interaction network, especially involving PGE2-EP4 signaling, facilitates pro-fibrotic communication between monocytes and T cells in the circulation, contributing to the inflammatory and fibrotic microenvironment in progressive IPF.
- Systemic activation of TNF, IL-17, and TLR signaling pathways in circulating monocytes and T cells drives chronic inflammation and oxidative stress, thereby sustaining and amplifying lung fibrosis in progressive IPF.
Potential therapeutic targets:
- TIGIT (T cell immunoreceptor with Ig and ITIM domains): Elevated expression on CD4+ T cells in progressive IPF suggests T cell exhaustion and impaired anti-fibrotic immunity. Blocking TIGIT could reinvigorate T cell function. Evidence: Section 11 shows distinctly higher TIGIT expression on CD4+ T cells in progressive IPF compared to stable IPF and control, supporting its role as an immune checkpoint in disease progression. Validation: Test anti-TIGIT antibodies in preclinical IPF models (e.g., bleomycin-induced fibrosis) to assess effects on T cell function, inflammation, and fibrosis. Confirm therapeutic efficacy in humanized models or early-phase clinical trials.
- Prostaglandin E2 (PGE2)-EP4 receptor pathway: Upregulated PGE2-EP4 interactions, particularly from monocytes, are prominent in progressive IPF and implicated in pro-fibrotic and immunosuppressive processes. Evidence: Section 9 highlights numerous PGE2-EP4 interactions (e.g., ProstaglandinE2_byPTGES3_PTGER4--Monocyte|T cell CD8+) as significantly elevated in progressive IPF. Validation: Evaluate EP4 antagonists in in vitro monocyte-T cell co-cultures from IPF patients to assess reduction in pro-fibrotic signaling or restoration of anti-fibrotic immune responses. Conduct preclinical studies with EP4 inhibitors in IPF animal models.
- FPR2 (Formyl peptide receptor 2): Monocytes in stable IPF show elevated FPR2, a receptor with dual pro-inflammatory and pro-resolving roles, suggesting it's actively engaged in disease processes. Modulating FPR2 could steer monocyte function towards resolution. Evidence: Section 10 shows FPR2 as a specific surfaceome marker highly expressed on monocytes in stable IPF. Validation: Explore the effects of FPR2 agonists or antagonists on monocyte activation, migration, and differentiation into pro-fibrotic vs. pro-resolving macrophages in vitro and in relevant IPF models.
- TNF signaling pathway: Widespread and strong upregulation of TNF signaling across multiple immune cell types (monocytes, T cells, NK cells, granulocytes, B cells, plasma cells) in progressive IPF indicates a central role in chronic inflammation. Evidence: Section 12 (GSEA) clearly shows "TNF signaling pathway" as significantly upregulated in progressive IPF across numerous cell types. Validation: Investigate the efficacy of existing anti-TNF therapies or novel TNF pathway inhibitors in preclinical IPF models. Conduct clinical trials evaluating anti-TNF strategies in a stratified IPF patient population, particularly those with high systemic TNF pathway activation.
- IL-17 signaling pathway: Similar to TNF, IL-17 signaling is strongly upregulated across various immune cells in progressive IPF, indicative of a persistent pro-inflammatory Th17-axis involvement. Evidence: Section 12 (GSEA) demonstrates "IL-17 signaling pathway" is prominently upregulated in progressive IPF across monocytes, T cells, NK cells, and granulocytes. Validation: Test IL-17 or IL-17 receptor antagonists in preclinical IPF models. Explore repurposing existing anti-IL-17 biologics (e.g., secukinumab) for IPF patients with high systemic IL-17 pathway activation.
Follow-up validation ideas:
- Flow cytometry or Mass cytometry: To validate changes in cell population proportions (e.g., ILC subsets, Treg cells) and surface marker expression (e.g., TIGIT on CD4+ T cells, FPR2 on monocytes) in larger cohorts and longitudinally, directly at the protein level.
- Multiplex cytokine profiling: To measure levels of pro-fibrotic (e.g., IL-5, IL-13) and pro-inflammatory (e.g., TNF-alpha, IL-17) cytokines in the plasma of IPF patients, correlating with ILC and T cell activation states.
- Ex vivo functional assays: To assess the functional capacity of TIGIT+ CD4+ T cells (e.g., cytokine production, proliferation) and the pro-fibrotic potential of monocytes (e.g., differentiation into fibrotic macrophages, secretion of pro-fibrotic factors) from IPF patient blood.
- Cell-cell interaction perturbation assays: Using in vitro co-culture systems or ex vivo organotypic models with patient-derived immune cells to functionally validate specific ligand-receptor interactions (e.g., blocking PGE2-EP4 or TIGIT-CD155) and assess their impact on inflammatory or fibrotic outcomes.
- Spatial transcriptomics or immunohistochemistry: To confirm the presence, localization, and activation status of key immune cell subsets and marker proteins (e.g., ILC2s, TIGIT+ T cells, FPR2+ monocytes) directly within fibrotic lung tissue from IPF patients, and correlate with peripheral blood findings.
- Validation in independent cohorts: Replicating key population changes, marker expressions, and pathway enrichments in external IPF patient cohorts to ensure generalizability and robustness of findings.
Limitations:
This report is based on single-cell RNA sequencing of peripheral blood, which may not fully reflect the complex cellular and molecular landscape within the fibrotic lung tissue. While statistical significance is reported, the observed differences represent associations, and causality cannot be definitively established from this correlative analysis. The sample size for each condition, though adequate for initial findings, may limit the detection of more subtle or rare population shifts and interactions. The depth of functional characterization for some identified cell subsets and pathways remains to be fully elucidated through further experimental validation. Generalizability to all IPF patients requires validation in larger, diverse cohorts, and across different ethnic and geographic populations.
14. Query List
- Show UMAP plots in 2 columns including condition, sample, major cell type, minor cell type, and celltype_subset, and save.
- Show major celltype scores on UMAP and save.
- Show the overall Celltype_subset marker expression dot plot and save it. Keep target_cell as None and keep the other arguments at their default values.
- Show population bar plot for minor cell types and save.
- Show T cell subset population barplot and save.
- Show boxplots for T cell subset populations if there are statistically significant differences between conditions, and save. Determine ncols appropriately based on the total number of panels.
- Show myeloid cell subset population barplot and save.
- Show cell-cell interactions by condition and save the result. Select at most 80 cell-cell interactions for each condition.
- Find statistically significant differences in cell-cell interactions for major immune cells and stromal cells across conditions, show as a dot plot, and save. Set max_n_items_per_group = 25.
- Extract condition-specific markers for Monocytes, show as a dot plot, and save. Include only surfaceome markers, up to 50 per condition.
- Extract condition-specific markers for T cell CD4+, show as a dot plot, and save. Include only surfaceome markers, up to 50 per condition.
- Show Gene set enrichment analysis (GSEA) results as a dot plot for major cell types and save. Use RdBu_r as the color map and set n_pws_to_show = 80.