Single-Cell Landscape of Immune and Stromal Cell Dynamics in Murine Colitis and Colorectal Cancer
This single-cell RNA sequencing analysis of mouse colon tissue delineates the cellular and molecular landscape across healthy, acute colitis (AC), and chronic colitis (CC) conditions. It highlights significant alterations in immune cell populations, notably expansions of B cells, T cells, and ILC3s in diseased states, alongside striking shifts in macrophage and fibroblast phenotypes. Condition-specific cell-cell interaction networks and dysregulated gene expression pathways reveal active inflammatory processes, tissue remodeling, and early oncogenic signatures, underscoring the complex interplay between immune and stromal compartments in colonic pathology.
Contents
- Dataset overview
- scRNA-seq Data Overview: UMAP Visualization of Colon Cell Populations Across Conditions and Samples
- UMAP Visualization of Key Marker Genes and Minor Cell Type Annotations
- Celltype_subset 마커 발현 개요 분석
- Colon Minor Cell Type Population Analysis Across Conditions
- Colon T cell and ILC Subset Population Analysis Across Disease Conditions
- Macrophage Population Analysis across Conditions
- Changes in T Cell Subset Proportions Across Colonic Conditions
- Macrophage Subset Proportion Differences Across Colon Conditions
- Condition-Specific Cell-Cell Interaction Patterns in Mouse Colon
- Condition-Specific Cell-Cell Interaction Patterns in Mouse Colon
- Macrophage Condition-Specific Surfaceome Markers in Mouse Colon
- Fibroblast Condition-Specific Surfaceome Markers in Colon Tissue
- T cell CD4+ Condition-Specific Surfaceome Markers
- Differential Expression of Cell Cycle-Related Genes in Intestinal Epithelial Cells Across Colonic Conditions
- Intestinal Epithelial Cell Pathway Enrichment (GO-GSA) in Colon under Different Conditions
- Colon Inflammation and Cell-Type-Specific Pathway Dysregulation in Disease States
- Discussion
- Query List
0. Dataset overview
Dataset Summary
데이터 유형: 단일 세포 RNA 시퀀싱 데이터 (AnnData 형식)
데이터 크기: 38900개 세포, 20582개 유전자
종: 마우스 (mouse)
조직: 결장 (Colon)
- 관찰 컬럼 (obs): sample, condition, celltype_major, celltype_minor, celltype_subset, sample_ext, celltype_for_cci, cluster
유전자 컬럼 (var): gene_ids, feature_types, variable_genes
조건: AC, CC, HC
- 주요 세포 타입 (celltype_major): Myeloid cell, T cell, B cell, Stromal cell, unassigned, Endothelial cell, Intestinal Epithelial cell
- 세부 세포 타입 (celltype_minor): Macrophage, T cell CD4+, ILC, B cell, Fibroblast, unassigned, Endothelial cell, Intestinal Epithelial cell, T cell CD8+, Dendritic cell, Smooth muscle cell, NK cell
- 하위 세포 타입 (celltype_subset): Macrophage (M2D), T cell (Th22) 등 상세한 40개 세포 타입
- 분석 기준 조건: DEG, GSEA, GSA_up 분석의 참조 조건은 'HC'입니다.
- 사전 계산된 결과: 세포-세포 상호작용 (CCI), 차등 발현 유전자 (DEG), 유전자 세트 농축 분석 (GSEA), 유전자 온톨로지 (GO/GSA) 결과가 조건 및 샘플별로 저장되어 있습니다.
1. scRNA-seq Data Overview: UMAP Visualization of Colon Cell Populations Across Conditions and Samples
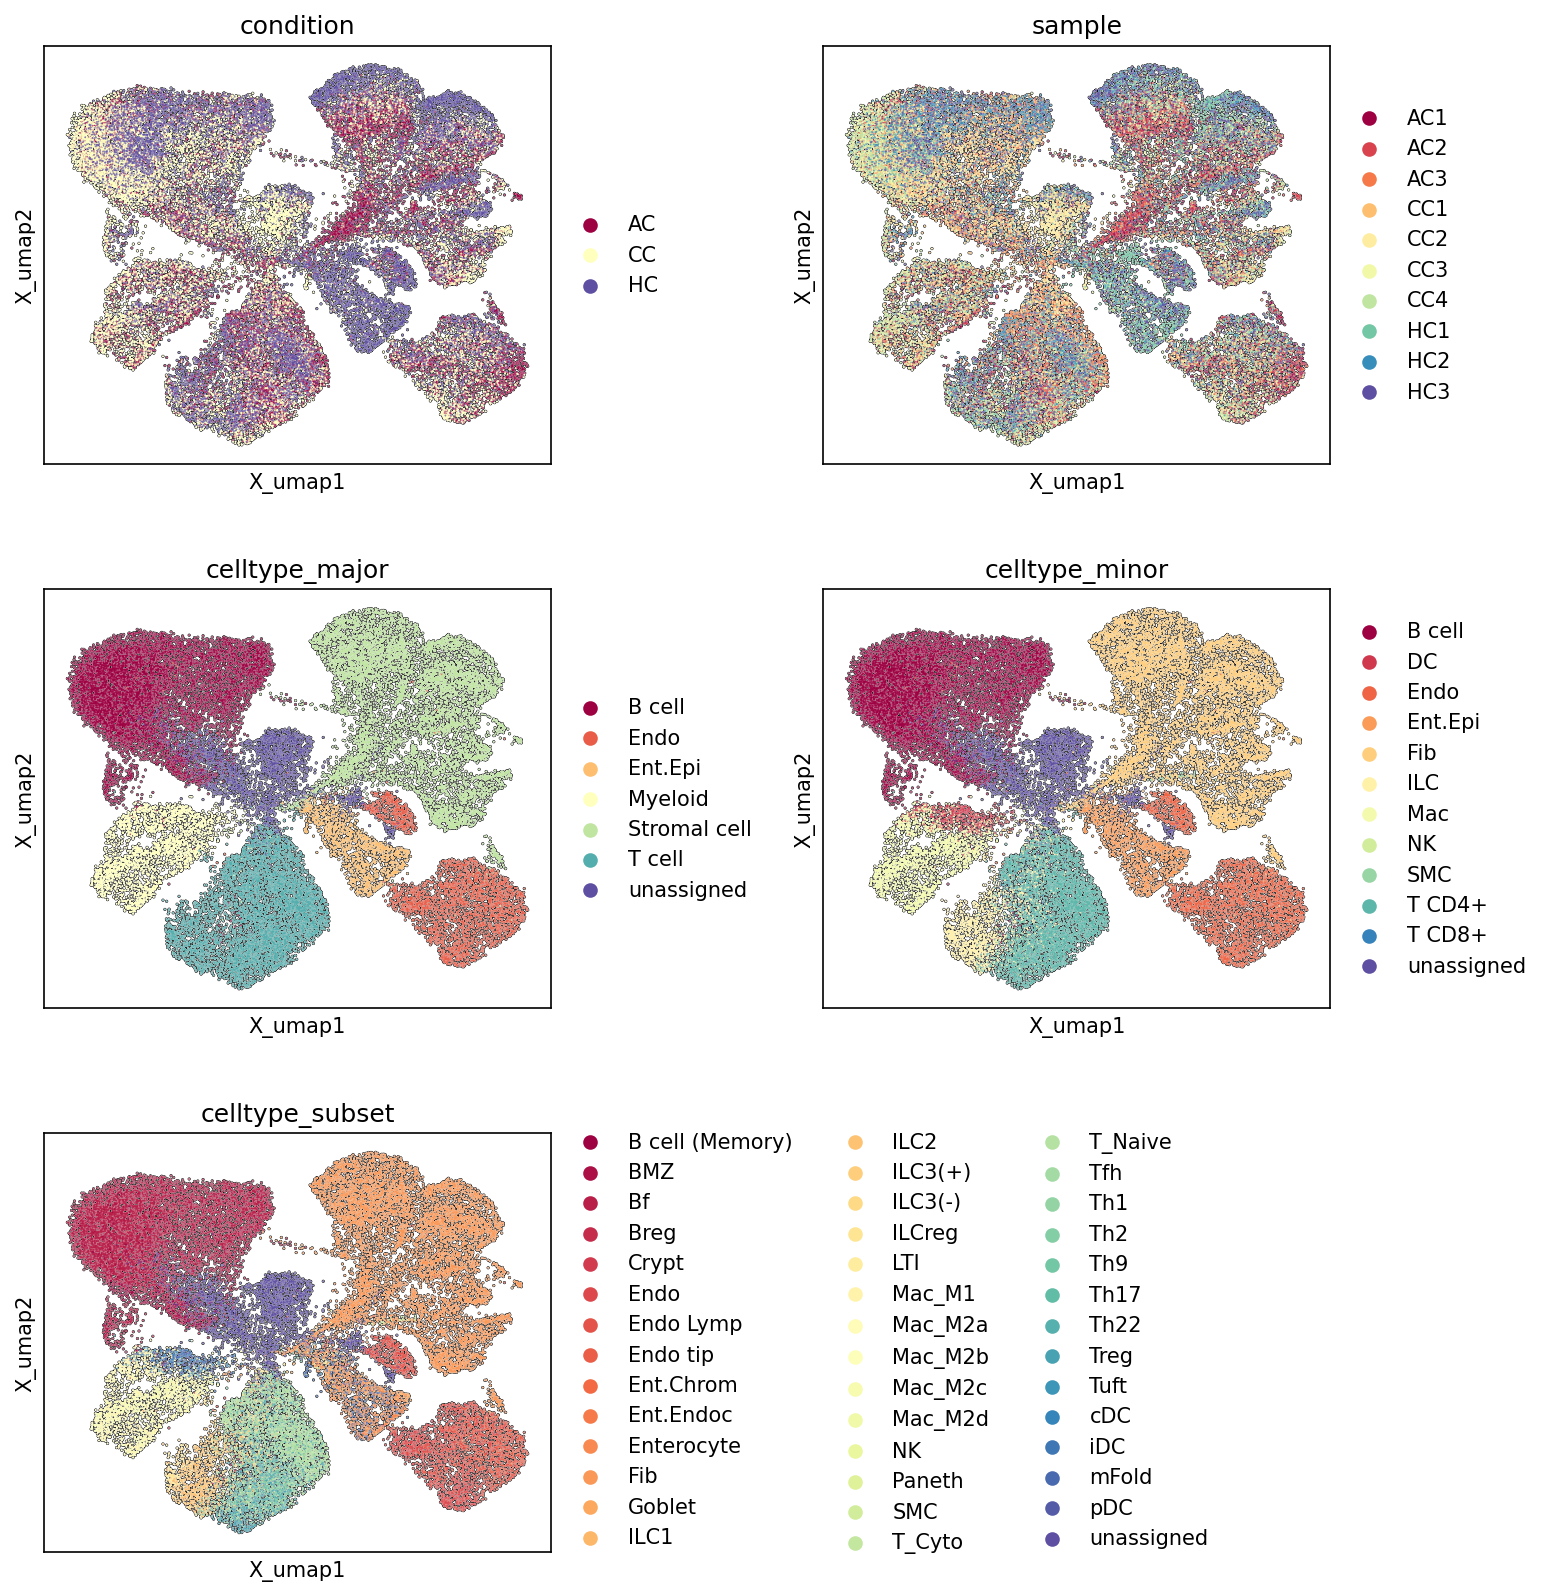
[Analysis Visualization Results]...
Analysis Overview
This analysis presents Uniform Manifold Approximation and Projection (UMAP) plots, which are critical for visualizing the high-dimensional single-cell RNA sequencing data in a lower-dimensional space. The plots display the relationships between cells, colored by various metadata features: experimental condition (AC, CC, HC), individual sample, major cell type, minor cell type, and cell type subset. This visualization helps to assess the overall cellular composition, the quality of cell clustering and annotation, and the impact of experimental conditions and sample variability on the data structure.
Visual Summary
The generated UMAP plots provide a comprehensive overview of the single-cell landscape from mouse colon:
Condition UMAP:
- Cells from the three conditions (AC, CC, HC) are broadly distributed across the UMAP, indicating shared cellular populations.
- However, specific regions within the UMAP show enrichment for particular conditions. For instance, some clusters, particularly in the upper and right-central regions, appear to have a higher density of AC (maroon) and CC (yellow) cells, suggesting condition-specific cellular states or expanded populations in these disease contexts. The HC (purple) cells are generally well-mixed, serving as a baseline.
Sample UMAP:
- The distribution of individual samples (AC1-3, CC1-4, HC1-3) shows a relatively good mixing of cells from different samples within most major clusters. This suggests that potential batch effects between samples have been largely mitigated during data processing and embedding generation, as cells from individual samples do not predominantly form isolated clusters.
- Despite the overall mixing, subtle enrichments of specific samples can be observed in smaller, more distinct clusters, which warrants careful consideration in downstream differential analyses.
Celltype_major UMAP:
- This plot clearly delineates distinct clusters corresponding to the major cell types found in the colon: Myeloid cell, T cell, B cell, Stromal cell, Endothelial cell, and Intestinal Epithelial cell (Ent.Epi).
- Intestinal Epithelial cells form a large, well-separated cluster on the right side of the UMAP. Immune cells (Myeloid, T, B cells) occupy various interconnected regions, reflecting their functional diversity and complex interactions.
- Stromal and Endothelial cells form smaller, yet distinct, clusters often situated adjacent to epithelial and immune compartments.
- Only a small fraction of cells remains 'unassigned', indicated by sparse dark purple points, suggesting high confidence in major cell type assignments.
Celltype_minor UMAP:
- Provides a more granular view, breaking down major cell types into their minor counterparts (e.g., T cell into T cell CD4+ and T cell CD8+; Myeloid into Macrophage and Dendritic cell).
- The overall structure of the UMAP is preserved, but with increased resolution, demonstrating successful sub-clustering and annotation. For instance, Macrophages and Dendritic cells form distinct yet related clusters within the broader Myeloid compartment.
Celltype_subset UMAP:
- Represents the highest level of annotation granularity, showcasing numerous specific cell subsets (e.g., various macrophage polarizations like Macrophage (M1), Macrophage (M2D); diverse T helper cell types like T cell (Th1), T cell (Treg), T cell (Th17); specific intestinal epithelial cells such as Enterocyte, Goblet cell, Paneth cell, Tuft cell, Crypt cell).
- The clear separation of these highly specialized subsets indicates robust clustering and accurate annotation, highlighting the cellular complexity of the colon tissue.
- The presence of distinct clusters for specialized epithelial cells like Paneth cells and Tuft cells, along with various immune cell subtypes, underscores the rich biological information captured.
Biological Interpretation
The UMAP visualizations demonstrate a robust and well-annotated single-cell dataset from mouse colon.
- Tissue Complexity and Cell Type Resolution: The progressive resolution from major to minor to subset cell types reveals the remarkable cellular heterogeneity of the colon. The successful identification and distinct clustering of various epithelial, stromal, endothelial, and immune cell populations (e.g., specialized Paneth, Goblet, and Tuft cells, alongside diverse T cell and macrophage subsets) confirm that the single-cell RNA-seq data effectively captures the diverse cell types essential for colon function and immune surveillance.
- Disease-Associated Cellular Shifts: The distribution of conditions across the UMAP suggests that AC and CC, likely representing colitis models, induce significant shifts in cellular composition or gene expression states in certain cell populations compared to the healthy control (HC). The enrichment of AC/CC cells in specific UMAP regions points towards potential expansion of disease-associated cell types, altered activation states, or recruitment of specific immune or stromal cells during inflammation. This forms a strong basis for further differential gene expression and pathway analyses within specific cell types to pinpoint disease mechanisms.
- Data Quality and Integration: The relatively good mixing of individual samples within general cell type clusters on the 'sample' UMAP indicates that the data integration and batch correction steps were largely successful. This is crucial as it minimizes technical noise, allowing observed biological differences (e.g., those related to conditions) to be interpreted with higher confidence, rather than being confounded by sample-specific technical variations.
Annotation Notes
The cell type annotations, from major to minor to subset levels, appear comprehensive and biologically consistent with known colon biology. The minimal presence of 'unassigned' cells at all annotation levels further supports the quality and completeness of the clustering and annotation workflow. This foundational understanding of the cellular landscape and its perturbation in disease conditions is essential for all subsequent, more detailed functional analyses.
2. UMAP Visualization of Key Marker Genes and Minor Cell Type Annotations
[Analysis Visualization Results]...
Analysis Overview
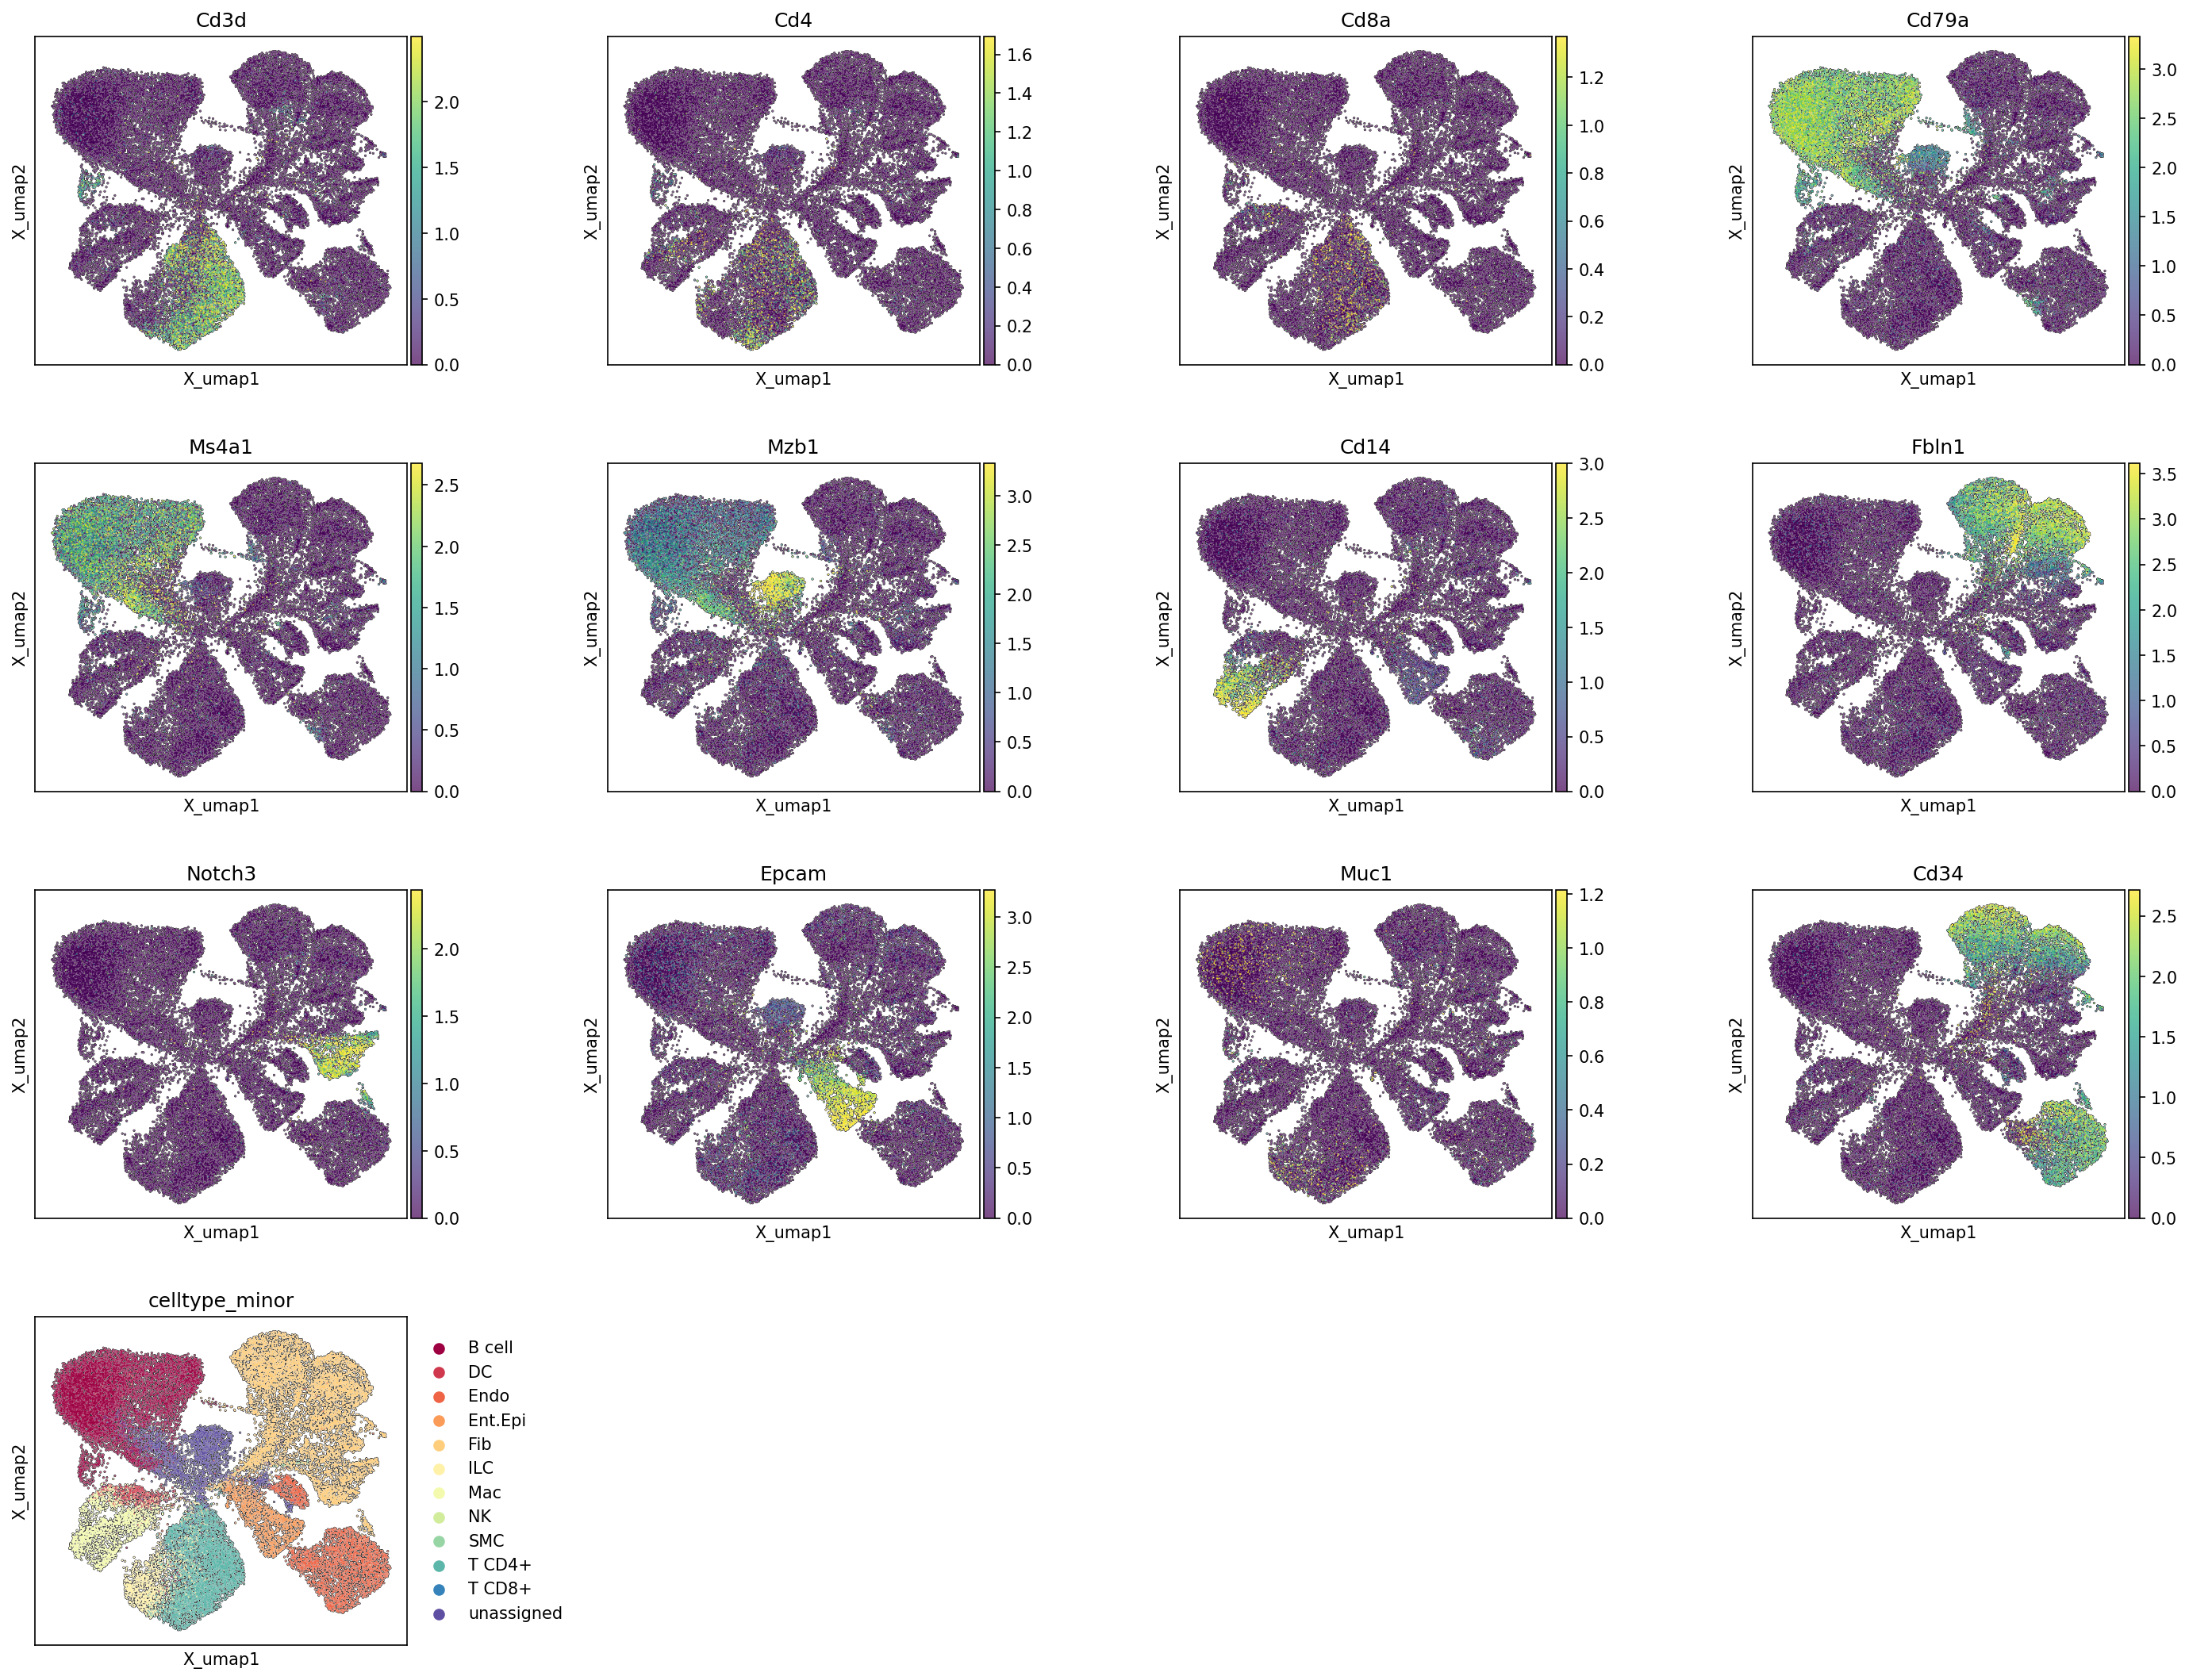
This analysis presents UMAP visualizations of single-cell RNA-seq data from mouse colon tissue, highlighting the expression patterns of several key marker genes alongside the celltype_minor annotations. The primary goal is to assess the consistency between the assigned cell types and the expression of known cell type-specific genes, thereby validating the cell type annotation quality and the overall embedding structure.
Visual Summary
The UMAP plots effectively display the distribution of 38,900 cells from the colon tissue, colored by individual gene expression levels (intensity indicates higher expression) and by their assigned celltype_minor categories.
Immune Cell Markers:
- Cd3d, a pan-T cell marker, shows strong expression primarily within the clusters identified as "T cell CD4+" and "T cell CD8+", confirming their T cell identity.
- Cd4 expression is distinctly localized to the "T cell CD4+" cluster, showing minimal overlap with "T cell CD8+" cells.
- Cd8a expression is specifically enriched in the "T cell CD8+" cluster, demonstrating appropriate segregation of these two major T cell subsets.
- Cd79a and Ms4a1 (also known as CD20) are both robust B cell markers. Their expression is tightly co-localized to the "B cell" cluster, validating this population.
- Mzb1, a marker associated with plasma cell differentiation, shows expression within a specific subset of the "B cell" cluster, suggesting the presence of activated or plasma-like B cells within the broader B cell population.
- Cd14 and Lyz, common myeloid markers, exhibit strong expression in the "Macrophage" and "Dendritic cell" (DC) clusters, which are part of the myeloid lineage. This is consistent with their established roles in these cell types.
Stromal and Endothelial Cell Markers:
- Fbln1 (Fibulin-1) shows concentrated expression within the "Fibroblast" cluster, confirming the identity of this stromal population.
- Notch3 displays expression primarily in the "Endothelial cell" cluster, and to a lesser extent, in some regions occupied by "Smooth muscle cell" (SMC) or "Fibroblast" cells, which aligns with its known expression in vascular and some stromal cell types.
- Cd34, another marker for endothelial cells and some stromal populations, is predominantly expressed in the "Endothelial cell" cluster, with some scattered expression potentially in other stromal or unassigned cell types.
Epithelial Cell Markers:
- Epcam, a classical epithelial cell marker, is highly and specifically expressed in the large "Intestinal Epithelial cell" cluster, confirming the identity of these cells.
- Muc1, a mucin protein, shows expression localized within the "Intestinal Epithelial cell" cluster, potentially indicating specific epithelial cell subsets such as goblet cells or certain enterocytes, consistent with its function in the mucosal barrier.
Biological Interpretation
The observed gene expression patterns on the UMAP are largely consistent with the assigned celltype_minor annotations, providing strong evidence for the accuracy and robustness of the cell type identification in this single-cell RNA-seq dataset from mouse colon.
The distinct localization of canonical immune cell markers (CD3D, CD4, CD8A, CD79A, MS4A1, CD14, LYZ) to their respective T cell, B cell, and myeloid clusters suggests a well-resolved immune compartment. The expression of MZB1 within a subpopulation of B cells hints at the presence of differentiated B cell states, potentially plasma cells, which is biologically relevant for understanding immune responses in the colon.
Similarly, markers for structural and non-immune cells like FBLN1 (fibroblasts), EPCAM and MUC1 (epithelial cells), and NOTCH3/CD34 (endothelial cells) appropriately delineate their respective populations. The precise expression of EPCAM in the "Intestinal Epithelial cell" cluster is particularly reassuring given the importance of this barrier cell type in gut health and disease.
Overall, the high congruence between expected marker gene expression and the derived celltype_minor labels suggests a reliable cellular landscape for further in-depth analyses of colon biology under different conditions (AC, CC, HC).
Annotation Notes
The comprehensive UMAP visualization of marker gene expression across different cell types confirms the quality of the celltype_minor annotations. The distinct and specific expression patterns of the chosen genes validate the separation and identification of major cell lineages (T cells, B cells, myeloid cells, epithelial cells, fibroblasts, endothelial cells) within the dataset. This robust annotation serves as a solid foundation for subsequent analyses, such as differential gene expression, pathway enrichment, or cell-cell interaction studies across the AC, CC, and HC conditions. Minor overlaps or broader expression patterns for certain genes (e.g., NOTCH3, CD34) are expected given their involvement in multiple related cell types or developmental processes.
3. Celltype_subset 마커 발현 개요 분석
[Analysis Visualization Results]...
Analysis Overview
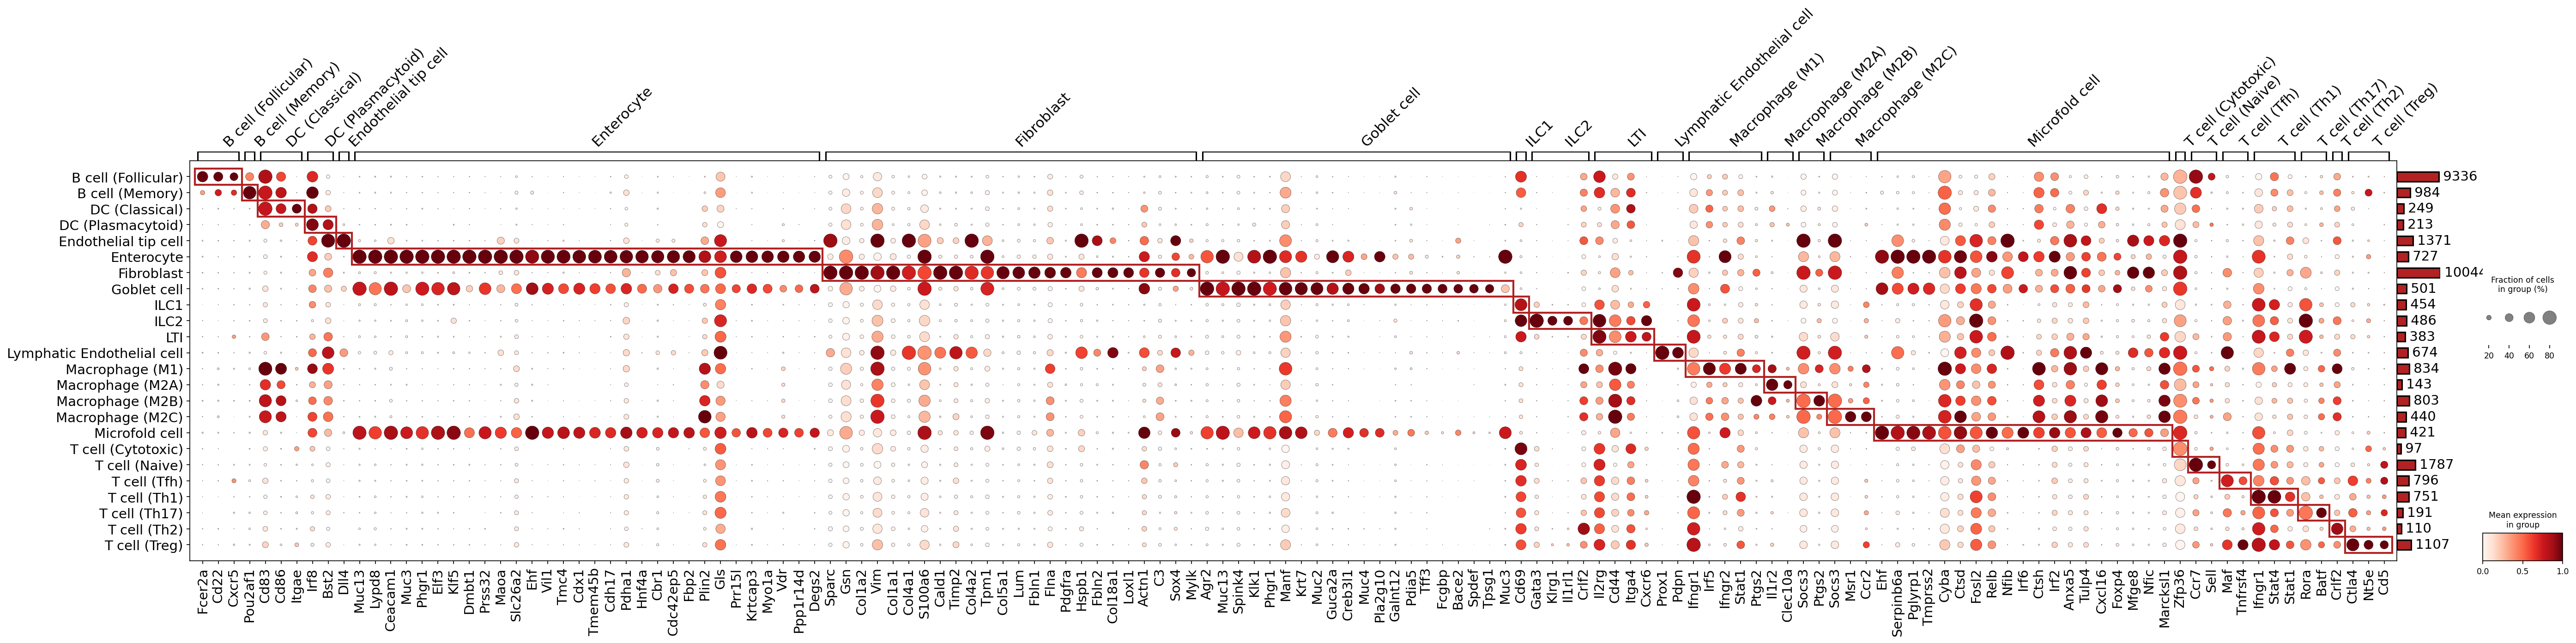
이 분석은 단일 세포 RNA 시퀀싱 데이터를 사용하여 마우스 대장(Colon) 조직에서 발견된 다양한 celltype_subset 그룹의 특이적 마커 유전자 발현 패턴을 시각화합니다. 이 점 플롯(dot plot)은 각 세포 하위 유형(행)에 대한 마커 유전자(열)의 평균 발현량(점의 색상 강도)과 해당 유전자를 발현하는 세포의 비율(점의 크기)을 보여줍니다. celltype_subset 주석의 품질과 각 세포 유형의 생물학적 정체성을 확인하는 데 중점을 둡니다.
Visual Summary
점 플롯은 각 celltype_subset에 대해 잘 정의된 마커 유전자 그룹을 명확하게 보여줍니다.
- 특이성: 많은 세포 하위 유형에서 대각선을 따라 짙은 빨간색의 큰 점들로 구성된 명확한 블록이 관찰됩니다. 이는 해당 세포 유형에 특이적으로 높게 발현되며 많은 세포에서 발현되는 마커 유전자가 존재함을 나타냅니다. 예를 들어, 장 상피 세포(Enterocyte, Goblet cell, Microfold cell)와 림프 내피 세포(Lymphatic Endothelial cell)는 매우 독특하고 강한 마커 세트를 가지고 있습니다.
- 발현 패턴: 마커 유전자의 발현 수준(색상 강도)과 세포 비율(점 크기)은 특정 세포 하위 유형의 정체성을 강력하게 뒷받침합니다. 예를 들어, Enterocyte는 Vill1, Cdx1, Hnf4a와 같은 여러 특이적 유전자를 높은 발현 수준으로 광범위하게 발현합니다.
- 세포 하위 유형별 구분: B 세포, 수지상 세포(DC), 대식세포(Macrophage), ILC, T 세포 등 면역 세포 계열 내에서도 celltype_subset 간의 구별되는 마커들이 식별됩니다. 예를 들어, T cell (Treg)은 Foxp3와 Ctla4를 특이적으로 발현합니다.
- 겹치는 마커: 일부 밀접하게 관련된 세포 유형(예: 특정 대식세포 하위 유형 또는 ILC 하위 유형)에서는 일부 마커 유전자의 발현이 겹치는 경향을 보이지만, 여전히 각 하위 유형을 구별하는 특이적 마커가 존재합니다.
- 세포 수: 각 celltype_subset의 오른쪽에 있는 막대 그래프는 해당 그룹에 속하는 세포의 수를 나타내며, 대부분의 세포 하위 유형이 충분한 수의 세포를 포함하고 있어 통계적 분석의 신뢰성을 뒷받침합니다.
Biological Interpretation
관찰된 마커 유전자 발현 패턴은 celltype_subset 주석이 생물학적으로 타당함을 강력하게 시사합니다.
장 상피 세포
- Enterocyte: Vill1 (비린, 장 상피 세포의 미세융모에 중요한 구조 단백질), Cdx1 (장 발달 및 분화 조절 전사 인자), Hnf4a (장 상피 세포 정체성 유지에 중요한 전사 인자)와 같은 유전자들은 장 상피 세포의 전형적인 마커로, 이 세포 유형의 소화 및 흡수 기능을 반영합니다.
- Goblet cell: Muc2 (점액 2), Tff3 (트레포일 펩타이드 3)는 점액 분비 및 장 보호 기능과 관련된 핵심 마커입니다.
- Microfold cell: Lydp8 및 Gp2 (M 세포 표면 수용체)는 파이어스 패치(Peyer's patch)의 항원 제시 M 세포의 특이적 마커로, 면역 감시 역할을 합니다.
면역 세포
- B cell (Follicular): Fcer2a (CD23, IgE 수용체)와 Cxcr5 (B 세포를 림프 소포로 유도하는 케모카인 수용체)는 여포 B 세포의 특징적인 마커입니다.
- DC (Plasmacytoid): Bst2 (CD317, PDCA-1)와 Irf8은 플라스마사이토이드 수지상 세포(pDC)의 강력한 마커이며, 이들의 항바이러스 면역 반응 역할을 시사합니다.
- Macrophage (M1) 및 Macrophage (M2A): Cd68은 범-대식세포 마커이며, Mrc1 (CD206)은 일반적으로 M2 대식세포에 연관되어 있습니다. Itgae (CD103)는 조직 상주 대식세포 및 수지상 세포에서 발견될 수 있습니다. 대식세포 하위 유형 간의 구분이 명확한 특이적 마커로 뒷받침됩니다.
- ILC2: Gata3 (ILC2 발달 및 기능의 핵심 전사 인자), Il1rl1 (ST2, IL-33 수용체), Il2rg (공통 감마 사슬)는 2형 선천성 림프구(ILC2)의 특징을 명확히 보여줍니다.
- T cell (Cytotoxic): Gzmb (그랜자임 B) 및 Prf1 (퍼포린)은 세포 독성 T 세포의 세포 사멸 유도 기능을 반영하는 중요한 이펙터 분자입니다.
- T cell (Treg): Foxp3 (조절 T 세포의 핵심 전사 인자)와 Ctla4 (면역 관문 분자)는 이들 세포의 면역 억제 기능을 나타내는 고전적인 마커입니다 GeneCards: FOXP3, GeneCards: CTLA4.
기타 세포
- Fibroblast: Col1a1 (콜라겐 유형 1 알파 1) 및 Vim (비멘틴)은 섬유아세포의 구조적 지지 기능을 나타내는 전형적인 마커입니다 GeneCards: COL1A1.
- Lymphatic Endothelial cell: Prox1 (림프관 발달의 핵심 전사 인자) 및 Pdpn (포도플라닌)은 림프 내피 세포의 매우 특이적이고 결정적인 마커입니다 GeneCards: PROX1.
전반적으로, 이 마커 발현 데이터는 각 celltype_subset 주석이 알려진 세포 생물학 및 기능과 일치하는 명확한 유전자 발현 프로파일을 가지고 있음을 강력하게 뒷받침합니다.
Annotation Notes
이 마커 발현 점 플롯은 celltype_subset 주석의 품질을 평가하는 데 매우 유용합니다.
- 강력한 주석 확인: 대부분의 celltype_subset은 고유하고 특이적인 마커 유전자 세트를 통해 명확하게 식별되며, 이는 현재의 세포 주석이 정확하고 신뢰할 수 있음을 나타냅니다. 특히 장 상피 세포 및 일부 면역 세포 하위 유형에서 매우 높은 특이성이 관찰되었습니다.
- 세포 정체성 확인: 플롯에 표시된 마커 유전자의 선택은 find_cfg 매개변수(surfaceome_only: True, fc_cutoff: 1.5, pval_cutoff: 0.05)를 통해 이루어졌으며, 이는 표면 마커에 초점을 맞추고 통계적으로 유의미하며 생물학적으로 큰 변화를 보이는 유전자를 선택했음을 의미합니다. 이는 세포 정체성을 확인하고 잠재적으로 후속 실험(예: FACS)을 위한 표면 마커를 식별하는 데 매우 적합합니다.
- 세포 하위 유형 해상도: 플롯은 복잡한 세포 집단 내에서도 미묘한 하위 유형(예: 다양한 B 세포, T 세포, 대식세포 하위 유형)을 구별하는 능력을 보여주며, 이는 데이터가 해당 수준의 해상도를 지원함을 시사합니다.
- 향후 검토 영역: 일부 밀접하게 관련된 면역 세포 하위 유형의 경우, 마커 유전자의 겹침이 관찰될 수 있으며, 이는 이러한 그룹이 스펙트럼의 일부이거나 추가적인 세분화가 필요함을 나타낼 수 있습니다. 그러나 현재 수준의 주석은 대부분의 세포 유형에 대해 강력하게 뒷받침됩니다.
4. Colon Minor Cell Type Population Analysis Across Conditions
[Analysis Visualization Results]...
Analysis Overview
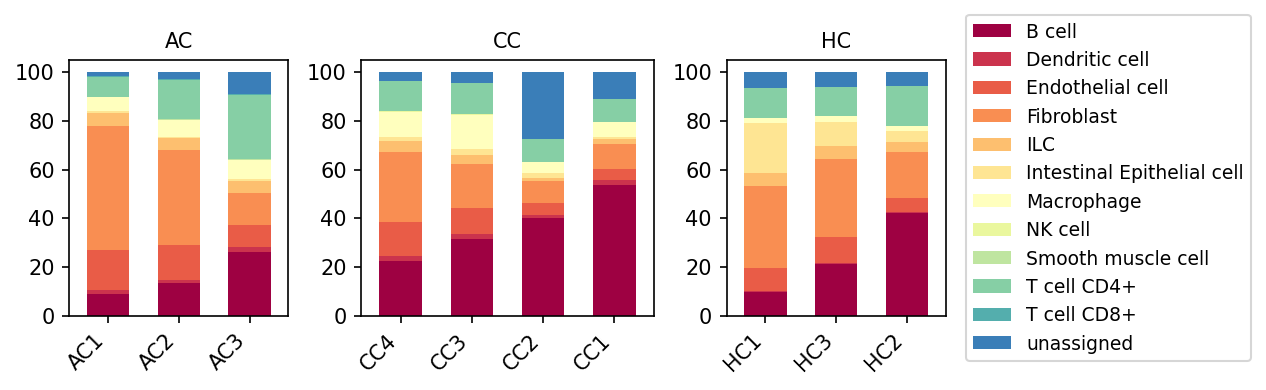
This analysis presents a population bar plot showing the relative proportions of minor cell types within individual samples across three conditions: AC, CC, and HC, obtained from mouse colon single-cell RNA-seq data. The visualization allows for a direct comparison of cellular composition shifts between samples and conditions, providing an initial overview of the tissue microenvironment.
Visual Summary
The stacked bar plots display the percentage contribution of 12 distinct minor cell types, plus an "unassigned" category, for each sample within the AC, CC, and HC conditions.
- Condition HC (Healthy Control): Samples HC1, HC3, and HC2 exhibit a relatively consistent cellular composition. Fibroblasts (orange) represent a substantial proportion (approximately 40-50%), followed by Intestinal Epithelial cells (light yellow) and various immune cell populations such as Macrophages (yellow), B cells (dark red), and T cell CD4+ (light green).
- Condition AC: Samples AC1, AC2, and AC3 show a cellular profile somewhat similar to HC, with Fibroblasts remaining a major component (around 50-60%) and Intestinal Epithelial cells also prominently represented. Immune cells like Macrophages, T cell CD4+, and B cells are present, but their proportions do not dramatically deviate from the HC baseline.
- Condition CC: A striking shift in cell proportions is observed across CC samples (CC4, CC3, CC2, CC1).
- B cells (dark red) demonstrate a notable increase, becoming one of the most abundant cell types, particularly in CC2 and CC1, where they constitute approximately 40-50% of the total cells. This is a significant expansion compared to AC and HC.
- Concomitantly, the relative proportions of Fibroblasts (orange) and Intestinal Epithelial cells (light yellow) appear reduced in the CC condition, likely due to the substantial infiltration of immune cells.
- T cell CD4+ (light green) and T cell CD8+ (teal) populations also appear to be proportionally elevated in CC compared to AC and HC, albeit less dramatically than B cells.
- The "unassigned" category shows some variability across samples, with CC4 having a more pronounced "unassigned" fraction.
Biological Interpretation
The observed shifts in cell type proportions offer significant biological insights, particularly regarding the immune landscape of the mouse colon under different conditions.
- Healthy Colon Homeostasis (HC & AC-like): The HC condition, likely representing the healthy state, is characterized by a balance of stromal cells (Fibroblasts, Endothelial cells, Smooth muscle cells), epithelial cells (Intestinal Epithelial cells), and resident immune cells. Fibroblasts, essential for structural support, extracellular matrix production, and immune modulation in the gut, are a prominent component, which is expected for normal tissue architecture. The AC condition appears to maintain a similar fundamental cellular architecture, suggesting it might represent a less severe perturbation or a different pathological process compared to CC.
- Immune-Driven Pathology in CC: The most striking observation is the substantial increase in B cells, coupled with an increase in T cells (both CD4+ and CD8+), in the CC condition. This pronounced immune cell infiltration strongly suggests an active, potentially chronic, inflammatory or immune-mediated pathological process within the colon.
- B cell expansion: B cells are critical components of adaptive immunity, involved in antibody production, antigen presentation, and cytokine secretion. Their significant expansion in CC could indicate robust humoral immune responses, which are often implicated in chronic inflammatory bowel diseases (IBD) or specific immune reactions in the gut mucosa. In IBD, activated B cells can contribute to inflammation, maintain immune responses, and may even produce autoantibodies contributing to tissue damage. PubMed search: B cells in inflammatory bowel disease
- T cell co-expansion: The concurrent increase in T cell CD4+ (helper T cells) and T cell CD8+ (cytotoxic T cells) further supports an active adaptive immune response. CD4+ T cells orchestrate various immune responses, including B cell activation, while CD8+ T cells are crucial for direct cell killing and anti-viral/anti-tumor immunity. Their presence together with B cell expansion points towards a coordinated immune activation.
- Reduced non-immune cells: The proportional decrease in Fibroblasts and Intestinal Epithelial cells in CC is likely a consequence of the massive immune cell influx, where immune infiltrates occupy a larger fraction of the tissue volume, or it could indicate damage to the epithelial barrier and alterations in stromal components due to inflammation.
- Colon Tissue Context: Given that the tissue is colon, the observed changes in CC are highly consistent with an inflammatory condition like colitis. The infiltration of B and T lymphocytes is a hallmark of such chronic inflammatory processes, where immune cells accumulate in the lamina propria and can lead to tissue destruction.
Clinical or Translational Implications
The distinct cellular composition observed in the CC condition, particularly the prominent B cell and T cell infiltration, holds several potential clinical and translational implications:
- Biomarker Potential: The relative abundance of B cells and T cells could serve as a diagnostic or prognostic biomarker for the CC condition. Monitoring these cell populations via biopsy or other methods might help in assessing disease activity or response to therapy.
- Therapeutic Targeting: The significant expansion of B cells and T cells in CC suggests these immune populations are key drivers of the pathology. This highlights these cells as potential therapeutic targets. For instance, B cell depletion therapies (e.g., anti-CD20 antibodies) or T cell modulators, which are used in other autoimmune and inflammatory diseases, might be considered for investigation in this context. PubMed search: B cell therapy inflammatory bowel disease
- Disease Subtyping: The differences between AC and CC, particularly the robust immune infiltration in CC, suggest that these represent distinct pathological states or stages. Understanding these compositional differences could aid in stratifying patients for personalized treatment approaches.
- Understanding Pathogenesis: Further in-depth analysis of the activated state and specific subtypes within these expanded B and T cell populations (e.g., regulatory B cells, specific T helper subsets, memory T cells) using the more granular celltype_subset annotations and differential expression analyses would be crucial to fully elucidate the underlying pathogenic mechanisms in the CC condition.
5. Colon T cell and ILC Subset Population Analysis Across Disease Conditions
[Analysis Visualization Results]...
Analysis Overview
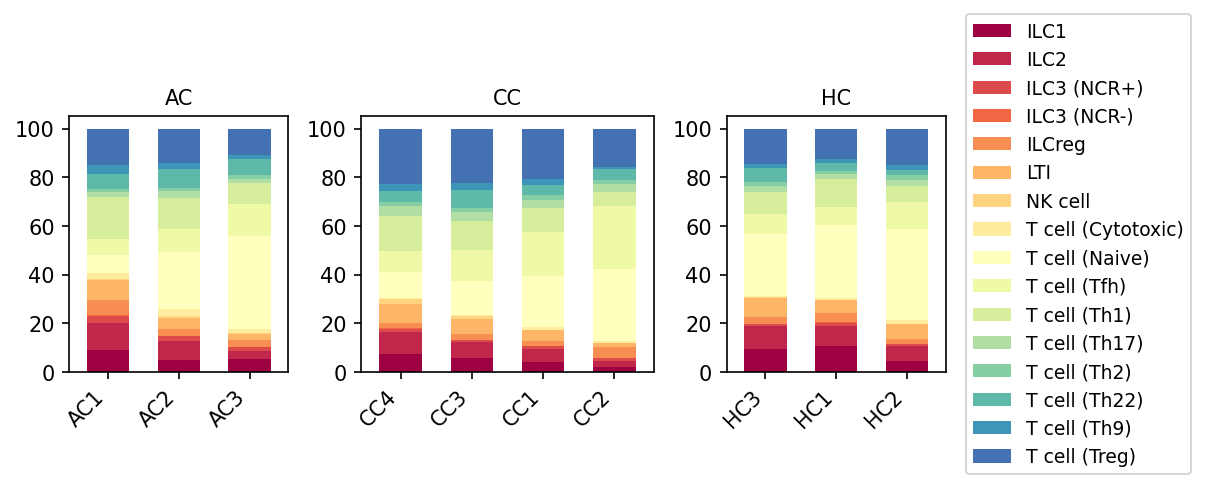
This analysis presents the relative proportions of various T cell, Innate Lymphoid Cell (ILC), and NK cell subsets within the broader 'T cell' major cell type compartment in mouse colon tissue. The single-cell RNA-seq data is grouped by sample and condition, including Adenoma Carcinoma (AC), Colorectal Cancer (CC), and Healthy Control (HC). This visualization provides insights into the immunological landscape and potential shifts in lymphocyte populations associated with colon pathology.
Visual Summary
The stacked bar plots display the relative abundances of T cell and ILC subsets across individual samples from AC, CC, and HC conditions.
- Diverse Lymphocyte Composition: The plots reveal a diverse composition of lymphocytes in the colon, including various T helper cell subsets (Th1, Th2, Th9, Th17, Th22, Tfh), T regulatory cells (Treg), Cytotoxic T cells, Naive T cells, and several ILC subsets (ILC1, ILC2, ILC3 (NCR+), ILC3 (NCR-), ILCreg, LTI), along with NK cells.
- Prominent T cell Subsets: T cell (Treg) and T cell (Naive) subsets consistently represent a significant proportion of the total T cell/ILC compartment across all conditions and samples.
- Increased ILC3s in Disease Conditions: The combined proportion of ILC3 (NCR+) and ILC3 (NCR-) populations (darker red/orange at the bottom of the bars) appears to be qualitatively higher in samples from the AC and CC conditions compared to the HC samples. This suggests an expansion of these ILC subsets in pathological states.
- Th17 Presence: T cell (Th17) (light green segment) is consistently present across all conditions, and its proportion might be slightly elevated in some AC and CC samples, though this trend is not as pronounced as with ILC3s.
- Relative Stability of Tregs: T cell (Treg) proportions remain substantial across all conditions, indicating a persistent immunoregulatory component. While there might be subtle condition-specific changes, no dramatic decrease is observed in diseased states.
- Minor Contribution of NK cells: NK cells generally constitute a relatively small fraction of the overall population compared to T cells and ILCs.
- Sample-to-Sample Variability: Within each condition, there is some variability in the exact proportions of subsets across individual samples, which is expected in biological datasets.
Biological Interpretation
The observed shifts in T cell and ILC subset proportions provide valuable insights into the immunological responses in the mouse colon during adenoma and colorectal cancer development.
- Dysregulation in AC/CC: The most striking observation is the apparent increase in ILC3 populations in AC and CC conditions compared to HC. ILC3s are critical for maintaining gut barrier integrity and responding to extracellular bacteria and fungi, often by secreting IL-17 and IL-22 [1, 2]. Their expansion in colorectal pathology suggests an altered mucosal immune environment, potentially reflecting chronic inflammation, dysbiosis, or an attempt to repair epithelial damage, which can also contribute to tumor progression in some contexts.
- Role of Th17 Cells: The consistent presence of T cell (Th17) and potential slight increases in AC/CC align with the known roles of Th17 cells in both protective immunity and chronic inflammatory diseases, including inflammatory bowel disease and colorectal cancer [3]. Th17 cells, like ILC3s, produce IL-17, contributing to inflammatory responses.
- Immunosuppression and T-regs: The substantial proportion of T cell (Treg) cells across all conditions, including AC and CC, is notable. Tregs play a crucial role in immune tolerance and suppressing anti-tumor immunity. Their sustained presence, or even a subtle increase, in diseased tissues could contribute to immune evasion by cancer cells, preventing effective anti-tumor responses from cytotoxic T cells or other effector lymphocytes [4].
- Naive T Cell Dynamics: The observation that Naive T cells may constitute a slightly smaller proportion in AC/CC compared to HC could indicate increased antigen exposure and differentiation into effector or memory T cell subsets in the inflamed/cancerous colon.
- Colonic Immune Environment: The colon, being a highly immune-active organ, harbors a complex network of lymphocytes. Shifts in the balance of these subsets are hallmarks of disease progression, reflecting the body's response to inflammation and oncogenic transformation.
Clinical or Translational Implications
- Disease Progression Biomarkers: Changes in the proportions of ILC3s, Th17 cells, and Tregs could serve as potential biomarkers for the progression of colonic adenoma to carcinoma or to monitor disease severity. Further quantitative analysis and validation would be required.
- Therapeutic Targets: If the expansion of ILC3s and/or Tregs significantly contributes to the immunosuppressive or pro-tumorigenic microenvironment in AC/CC, these cell types could represent potential therapeutic targets. Strategies aimed at modulating ILC3 or Th17 activity (e.g., blocking IL-17/IL-22 pathways) or inhibiting Treg function could be explored as adjunctive therapies in colorectal cancer.
- Immunotherapy Context: Understanding the specific immune cell compositions and their shifts in the colon during disease is crucial for developing and optimizing immunotherapies. For instance, high Treg levels might predict a poor response to certain checkpoint inhibitors, suggesting a need for combination therapies.
---
References:
- ILC3s in Gut Immunity: Diefenbach, A., & Colonna, M. (2018). The roles of innate lymphoid cells in gut health and disease. *Current Opinion in Gastroenterology*, 34(6), 406-412. PubMed search for ILC3 gut immunity
- ILC3s in Colorectal Cancer: Song, S., & Li, C. J. (2020). The roles of innate lymphoid cells in colorectal cancer. *Frontiers in Immunology*, 11, 219. PubMed search for ILC3 colorectal cancer
- Th17 in Colorectal Cancer: Wu, S., Rhee, K. J., Albesiano, E., Rabizadeh, S., Wu, X., Yen, H. R., ... & Pothoulakis, C. (2012). A human colonic commensal modulates colon cancer growth via conversion of CD4+ T cells into IL-10-secreting Tregs. *Gastroenterology*, 143(6), 1406-1416. PubMed search for Th17 colorectal cancer
- Tregs in Cancer: Nishikawa, H., & Sakaguchi, S. (2010). Regulatory T cells in tumor immunity. *International Journal of Cancer*, 127(4), 759-767. PubMed search for Treg cancer
6. Macrophage Population Analysis across Conditions
[Analysis Visualization Results]...
Analysis Overview
이 분석은 단일 세포 RNA 시퀀싱 데이터에서 얻은 AnnData 객체를 사용하여 마크로파지(Macrophage) 세포의 개체군을 시각화합니다. 사용자의 쿼리는 'Macrophages'에 대한 서브셋 개체군 막대 그래프를 보여달라는 것이었으며, plot_celltype_population 도구가 사용되었습니다. targets 매개변수는 celltype_minor 레벨에서 'Macrophage' 세포만을 선택하도록 설정되었습니다.
Visual Summary
제공된 막대 그래프는 AC, CC, HC 세 가지 조건별로 각 샘플(AC1-3, CC1-4, HC1-3)에서 'Macrophage' 세포의 개체군을 보여줍니다. 모든 샘플에서 'Macrophage'를 나타내는 막대는 Y축 100%에 도달하고 있습니다. 범례에는 단일 항목 'Macrophage'가 표시되어 있습니다. 이는 각 샘플 내에서 celltype_minor가 'Macrophage'로 분류된 세포들 중에서 'Macrophage'가 차지하는 비율을 보여주는 것으로 해석될 수 있습니다.
Biological Interpretation
이 시각화는 celltype_minor 레벨에서 'Macrophage'로 명확하게 주석이 달린 세포 개체군만을 대상으로 한 결과입니다. 따라서, targets 매개변수를 통해 'Macrophage' 세포만으로 데이터를 필터링했기 때문에, 이 필터링된 데이터 내에서 'Macrophage' 세포의 비율은 본질적으로 100%가 됩니다.
이 결과는 다음과 같은 점을 시사합니다:
- 세포 유형 일관성 확인: 이 플롯은 'Macrophage'로 분류된 세포들이 해당 카테고리 내에서 일관되게 인식되고 있음을 보여주는 일종의 데이터 유효성 검사 역할을 합니다.
- 제한된 생물학적 정보: 현재 플롯은 콜론 조직 전체에서 마크로파지가 차지하는 *상대적인 풍부도*나 AC, CC, HC 조건 간의 마크로파지 개체수 변화에 대한 정보를 제공하지 않습니다. 또한, 데이터 컨텍스트에 'Macrophage (M2D)', 'Macrophage (M1)' 등과 같은 celltype_subset 정보가 있음에도 불구하고, 이 플롯은 마크로파지 내부의 이질적인 서브타입(예: M1, M2A, M2B, M2C, M2D) 분포를 보여주지는 않습니다.
Annotation Notes
이 시각화는 특정 세포 유형의 명칭이 자체적으로 잘 정의되어 있음을 확인하는 데 유용하지만, 마크로파지 집단의 생물학적 변화나 서브셋 구성을 탐색하기 위해서는 다른 접근 방식이 필요합니다. 예를 들어:
- 전체 세포 중 마크로파지 비율: 각 샘플에서 *전체 세포 개체군* 대비 마크로파지의 상대적인 비율을 확인하려면, targets 매개변수를 마크로파지로 필터링하지 않고 celltype_minor 전체를 기준으로 플롯을 생성해야 합니다.
- 마크로파지 서브타입 분석: 마크로파지의 다양한 서브타입(예: M1, M2 아형)의 분포를 시각화하려면, compute_cfg의 taxo_level을 'subset'으로 설정하고, 'Macrophage' celltype_minor 내의 celltype_subset들을 보여주도록 매개변수를 조정해야 합니다.
7. Changes in T Cell Subset Proportions Across Colonic Conditions
[Analysis Visualization Results]...
Analysis Overview
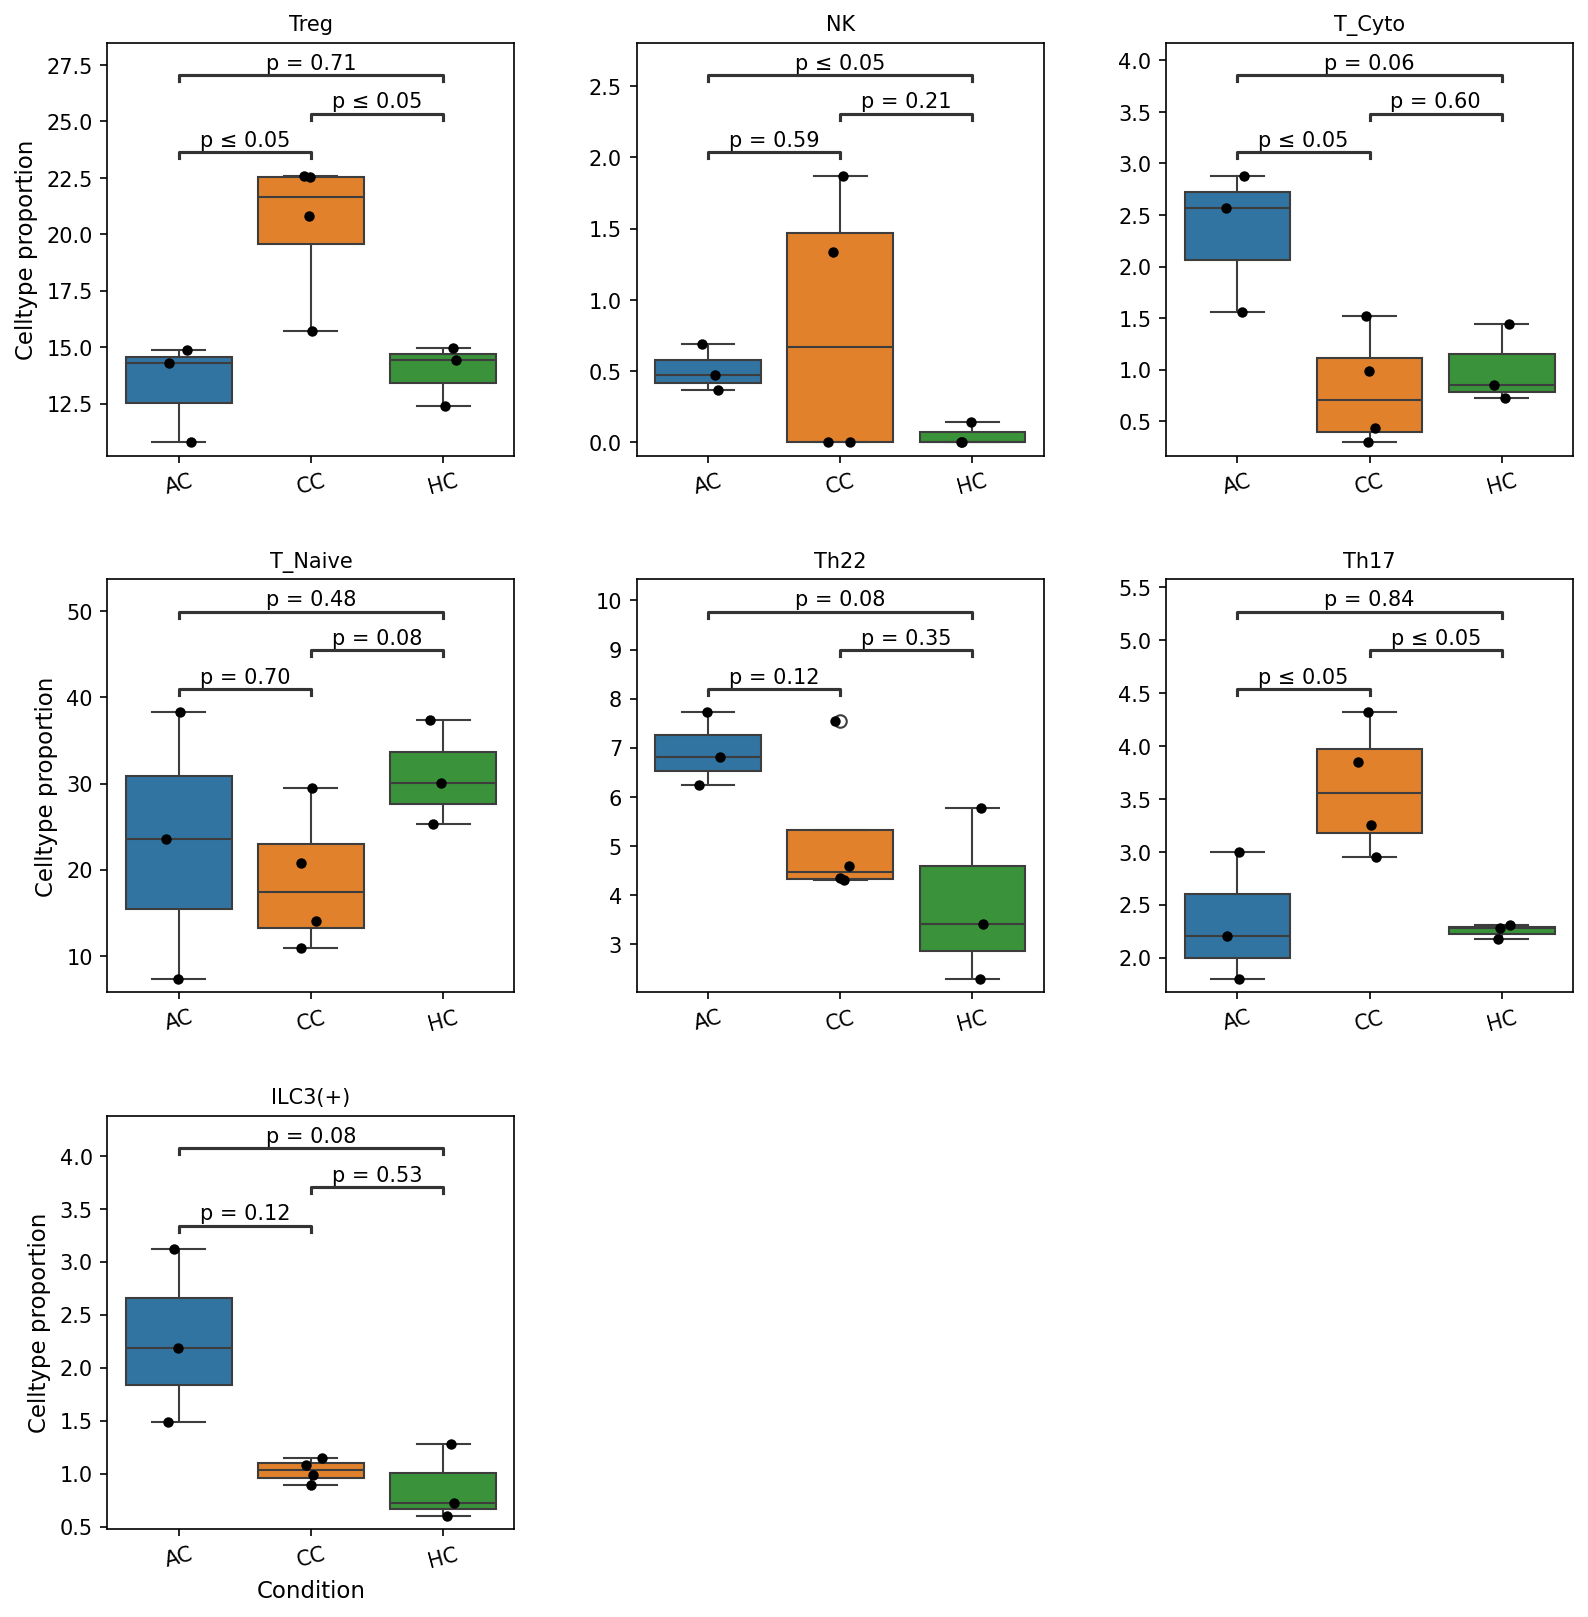
This analysis investigates the proportional changes of various T cell and related innate lymphoid cell (ILC) subsets in the colon across three conditions: Acute Colitis (AC), Chronic Colitis (CC), and Healthy Control (HC). The proportions are calculated from single-cell RNA-seq data and are presented as box plots, with statistical significance determined using pairwise comparisons (p-value cutoff = 0.1). HC serves as the reference condition for comparisons.
Visual Summary
The box plots illustrate the distribution of celltype proportions for seven different cell subsets: Treg, NK, T_Cyto, T_Naive, Th22, Th17, and ILC3(+), across the three conditions (AC, CC, HC). Black dots represent individual sample proportions. Statistical significance (p-values) for pairwise comparisons between conditions are indicated above the respective box plots.
Key observations include:
- Treg cells: Significantly increased in CC compared to both AC (p ≤ 0.05) and HC (p ≤ 0.05).
- NK cells: Significantly increased in CC compared to HC (p ≤ 0.05).
- Cytotoxic T cells (T_Cyto): Significantly higher in AC compared to CC (p ≤ 0.05) and marginally higher than HC (p = 0.06).
- Naive T cells (T_Naive): Proportion is significantly lower in CC compared to HC (p = 0.08).
- Th22 cells: Proportion is significantly higher in AC compared to HC (p = 0.08).
- Th17 cells: Significantly increased in CC compared to both AC (p ≤ 0.05) and HC (p ≤ 0.05).
- ILC3(+): Proportion is significantly higher in AC compared to HC (p = 0.08).
Biological Interpretation
The observed shifts in immune cell proportions within the colon suggest distinct immunological landscapes corresponding to the AC and CC conditions compared to healthy controls, indicative of inflammatory processes.
- Chronic Colitis (CC) Associated Changes:
- Increased Th17 and Treg cells: The most striking finding in CC is the significant increase in both Th17 and Treg cell proportions. Th17 cells are well-known drivers of inflammation, particularly in autoimmune and chronic inflammatory conditions such as inflammatory bowel disease (IBD) [1]. Their elevation in CC strongly implicates a Th17-mediated inflammatory response. Concurrently, the significant increase in regulatory T cells (Tregs), which are crucial for maintaining immune homeostasis and suppressing inflammation, suggests a compensatory mechanism attempting to control the ongoing inflammation [2]. The co-expansion of both pro-inflammatory Th17 and immunosuppressive Tregs is a common feature of chronic inflammation, reflecting a dynamic balance or imbalance in immune regulation.
- Increased NK cells: Natural Killer (NK) cells are innate lymphocytes capable of killing target cells and producing cytokines. Their increased proportion in CC suggests heightened innate immune activation, which can contribute to tissue damage or immune regulation in chronic inflammation.
- Decreased Naive T cells: A lower proportion of Naive T cells in CC compared to HC (p = 0.08) could indicate increased activation and differentiation of T cells into effector or memory populations in response to persistent antigenic stimulation characteristic of chronic inflammation.
- Acute Colitis (AC) Associated Changes:
- Increased Cytotoxic T cells (T_Cyto): The higher proportion of Cytotoxic T cells in AC compared to CC (p ≤ 0.05) and marginally to HC (p = 0.06) suggests a more prominent cytotoxic immune response in the acute phase. These cells (often CD8+ T cells) are vital for clearing infected or damaged cells.
- Increased Th22 cells and ILC3(+): Both Th22 cells and ILC3(+) are key players in maintaining mucosal barrier integrity, tissue repair, and host defense against pathogens, particularly in the gut [3, 4]. Their elevated proportions in AC compared to HC (p = 0.08 for both) could reflect active processes of epithelial defense, repair, or early inflammatory responses to preserve tissue integrity during an acute challenge.
These findings collectively highlight distinct immunological signatures for AC and CC within the colon, with CC characterized by a robust, yet potentially imbalanced, adaptive immune response (Th17/Treg expansion) and NK cell activation, while AC shows signs of cytotoxic activity and epithelial support/defense (T_Cyto, Th22, ILC3(+)).
Clinical or Translational Implications
The differential shifts in T cell subset populations provide valuable insights into the immunopathogenesis of colonic inflammation.
- Biomarker Potential: The distinct immune cell profiles could serve as diagnostic or prognostic biomarkers to differentiate between acute and chronic forms of colitis, or to monitor disease activity and therapeutic response. For example, the Th17/Treg ratio has been explored as a potential indicator of disease severity in IBD [2].
- Therapeutic Targeting: The significant increase in Th17 cells in CC identifies this population as a strong candidate for targeted immunomodulatory therapies aimed at reducing pro-inflammatory responses in chronic colitis. Conversely, strategies to bolster Treg function or stability could help restore immune balance.
- Disease Understanding: Understanding the specific immune cell dynamics in AC (e.g., cytotoxic T cells, Th22, ILC3(+)) versus CC (e.g., Th17, Treg, NK) can help elucidate the different underlying mechanisms driving acute inflammatory flares versus chronic, persistent inflammation in the colon. This knowledge is critical for developing more tailored and effective therapeutic interventions for patients with inflammatory bowel conditions.
References
- Th17 cells in IBD: PubMed search: Th17 cells inflammatory bowel disease
- Tregs in IBD: PubMed search: Regulatory T cells inflammatory bowel disease
- Th22 cells: PubMed search: Th22 cells gut immunity
- ILC3: PubMed search: ILC3 intestinal barrier
8. Macrophage Subset Proportion Differences Across Colon Conditions
[Analysis Visualization Results]...
Analysis Overview
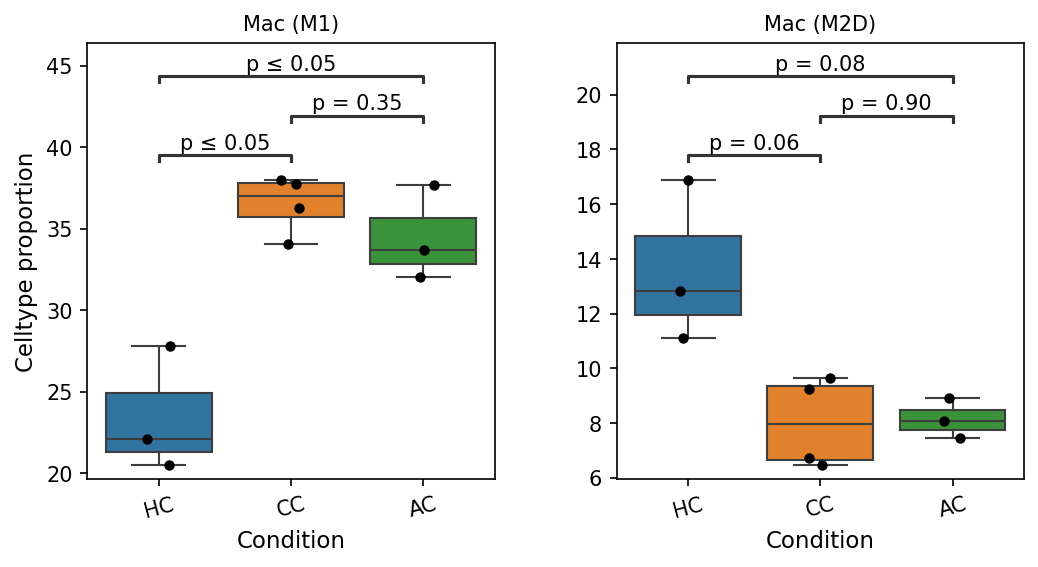
This analysis investigates the proportions of specific macrophage subsets, Mac (M1) and Mac (M2D), across three conditions (HC: Healthy Control, CC: Condition C, AC: Condition A) within the mouse colon tissue. Box plots are used to visualize the cell type proportions, and statistical significance tests were performed to identify differences between conditions, particularly comparing AC and CC against the reference condition HC, using a p-value cutoff of 0.1.
Visual Summary
The box plots illustrate the distribution of cell type proportions for Mac (M1) and Mac (M2D) across HC, CC, and AC conditions.
Mac (M1) Proportions:
- Mac (M1) cell proportions are lowest in the HC condition (median around 22-23%).
- Both CC and AC conditions show significantly higher proportions of Mac (M1) cells compared to HC (p ≤ 0.05 for both HC vs CC and HC vs AC).
- The median proportion for Mac (M1) in CC is approximately 37%, and in AC, it is around 34%. There is no statistically significant difference between CC and AC conditions (p = 0.35).
Mac (M2D) Proportions:
- Mac (M2D) cell proportions are highest in the HC condition (median around 13%).
- Compared to HC, both CC and AC conditions show lower proportions of Mac (M2D) cells. These differences are statistically significant according to the applied p-value cutoff of 0.1 (p = 0.06 for HC vs CC, and p = 0.08 for HC vs AC).
- The median proportion for Mac (M2D) in both CC and AC is approximately 8-9%. There is no statistically significant difference between CC and AC conditions (p = 0.90).
Biological Interpretation
Macrophages are critical immune cells in the colon, playing diverse roles in host defense, tissue homeostasis, and inflammation. The observed shifts in macrophage subset proportions provide insight into the immune microenvironment in the different conditions.
- M1 Macrophages and Inflammation: M1 macrophages are classically activated and are generally associated with pro-inflammatory responses, secreting cytokines such as TNF-α, IL-1β, and IL-6, and are involved in pathogen clearance and cellular immunity. The significant increase in Mac (M1) proportions in both CC and AC conditions compared to HC suggests a heightened pro-inflammatory state in these conditions within the colon. This influx or expansion of M1-like macrophages could contribute to or be a consequence of inflammation [UniProt].
- M2D Macrophages and Immune Regulation/Resolution: M2 macrophages are alternatively activated and are generally involved in anti-inflammatory processes, wound healing, tissue repair, and immune regulation. M2D macrophages, a subtype of M2, have been associated with immune suppression and promotion of angiogenesis, often found in chronic inflammatory contexts or tumors. The observed decrease in Mac (M2D) proportions in CC and AC compared to HC suggests a potential reduction in regulatory or pro-resolution macrophage populations, which could further imbalance the immune response towards inflammation or indicate a failure in resolving inflammatory processes [PubMed Search].
- Overall Shift in Macrophage Polarization: The concurrent increase in pro-inflammatory M1 macrophages and decrease in potentially regulatory/pro-resolution M2D macrophages in AC and CC conditions suggests a significant shift in macrophage polarization. This indicates a dysregulated immune environment in the colon in conditions AC and CC, characterized by an enhanced inflammatory phenotype. Such shifts are commonly observed in inflammatory diseases like Inflammatory Bowel Disease (IBD), where an imbalance between pro- and anti-inflammatory macrophages contributes to chronic inflammation and tissue damage [PubMed Search].
Clinical or Translational Implications
The distinct changes in M1 and M2D macrophage populations observed in the AC and CC conditions relative to healthy controls could have significant clinical implications:
- Disease Biomarkers: The specific proportions of M1 and M2D macrophages could serve as potential biomarkers for disease activity or severity in colon-related pathologies represented by conditions AC and CC.
- Therapeutic Targets: Targeting macrophage polarization is a promising strategy for inflammatory diseases. Strategies aimed at reducing M1 activation or promoting M2D presence (or other beneficial M2 subtypes) could be explored to modulate the inflammatory response in the colon.
- Understanding Pathogenesis: These findings provide crucial insights into the immune cell dynamics underpinning the pathogenesis of the conditions studied, highlighting the macrophage compartment as a key player in disease progression or maintenance. Further investigations into the specific triggers for these polarization shifts and their functional consequences would be valuable.
9. Condition-Specific Cell-Cell Interaction Patterns in Mouse Colon

[Analysis Visualization Results]...
Analysis Overview
This analysis visualizes cell-cell interaction (CCI) patterns across different samples and conditions (AC, CC, HC) in mouse colon tissue, derived from single-cell RNA-seq data. The plot displays the top 80 most significant cell-cell interactions for each condition, selected based on the lowest p-value. The color intensity of each dot represents the standardized sample mean of the interaction strength, with darker red indicating stronger interactions. The size of the dot corresponds to the -log10(p-value), where larger dots signify more statistically significant interactions. This helps to identify prevalent and robust communication pathways specific to different physiological or pathological states.
Visual Summary
The dot plot clearly differentiates cell-cell interaction profiles between the conditions.
- HC (Healthy Control) Condition: Samples HC1, HC2, and HC3 consistently show very few and generally weak cell-cell interactions (pale red, small dots). This suggests a relatively quiescent state of cell communication in healthy colon tissue.
- AC Condition: Samples AC1, AC2, and AC3 exhibit a widespread increase in cell-cell interactions. Many dots are dark red and large, indicating strong and highly significant interactions. The pattern of strong interactions is broad across many CCI pairs shown on the x-axis.
- CC Condition: Samples CC1, CC2, CC3, and CC4 also display significantly elevated cell-cell interactions, similar to or even more pronounced than the AC condition for certain interaction pairs. Particularly, CC4 appears to show some of the most intense and widespread interactions among all samples.
- Overall Pattern: There is a clear shift from sparse and weak interactions in HC to abundant, strong, and highly significant interactions in both AC and CC conditions. This suggests a dramatically altered cellular communication landscape in AC and CC conditions compared to HC. The specific sets of interactions that are upregulated are numerous and diverse, involving various cell types and ligand-receptor pairs.
Biological Interpretation
The observed upregulation of cell-cell interactions in AC and CC conditions compared to HC strongly suggests an active biological process, likely associated with inflammation, tissue remodeling, or immune activation, given the colon tissue context. The specific interaction pairs shed light on the nature of these processes:
- Immune Cell Recruitment and Adhesion: A prominent feature is the high frequency and strength of interactions involving adhesion molecules such as ICAM1, VCAM1, and various integrins (e.g., ITGAL, ITGAM, ITGAX, ITGB2) between endothelial cells (Endo), macrophages (Mac), T cells (T CD4+), and fibroblasts (Fib). These molecules are crucial for leukocyte adhesion to endothelial cells and subsequent extravasation into tissues during inflammation. For instance, ICAM1-integrin_aLb2_complex (LFA-1) and VCAM1-integrin_a4b1_complex are key for T cell and macrophage migration into inflamed sites [1].
- Inflammatory Signaling: Interactions involving IL1A-IL1 receptor and JAG1-NOTCH are also notably upregulated. Interleukin-1 alpha (IL1A) is a pro-inflammatory cytokine that can activate various immune and stromal cells, driving inflammation [2]. Notch signaling (JAG1-NOTCH) is involved in diverse cellular processes including cell fate determination, angiogenesis, and immune cell activation and differentiation, all of which can be altered in inflammatory or diseased states of the colon [3].
- Extracellular Matrix (ECM) Remodeling: Several interactions involve collagen components (e.g., COL15A1-integrin_a11b1_complex) and other ECM-related molecules with fibroblasts and endothelial cells. This points towards active tissue remodeling, repair, or potentially fibrotic processes, which are common sequelae of chronic inflammation in the colon.
- Lymphangiogenesis and Angiogenesis: The presence of VEGFC/D-FLT4 interactions suggests active lymphangiogenesis or angiogenesis, crucial processes in inflammation and tissue repair that involve endothelial cells.
- Cell-type Specificity: The interactions are not confined to a single cell type but span across immune cells (Macrophage, T cell CD4+, ILC, DC), stromal cells (Fibroblast, Smooth muscle cell), and endothelial cells, indicating a complex multicellular interplay in the diseased colon environment. For example, Macrophage-T cell CD4+ interactions highlight adaptive immune responses, while Endothelial-Macrophage interactions emphasize immune cell recruitment.
The differential patterns between AC and CC conditions, while broadly similar in their heightened activity, might reflect distinct pathological mechanisms or stages of disease, suggesting condition-specific biological responses.
Clinical or Translational Implications
The drastically altered cell-cell interaction landscape in AC and CC conditions has significant clinical and translational implications for colon diseases, potentially indicating inflammatory bowel disease (IBD) or other inflammatory colon pathologies.
- Biomarkers of Disease Activity: The specific sets of highly active cell-cell interactions in AC and CC could serve as novel biomarkers for disease activity, severity, or even specific disease subtypes. Monitoring these interaction patterns could provide insights into disease progression or response to therapy.
- Therapeutic Targets: The identified key ligand-receptor pairs represent potential therapeutic targets. For instance, blocking specific adhesion molecules like VCAM1, ICAM1, or integrins could reduce immune cell infiltration and subsequently dampen inflammation in the colon. Inhibiting pro-inflammatory cytokine signaling (e.g., IL1A pathway) or modulating Notch signaling could also be viable strategies.
- Understanding Disease Heterogeneity: The subtle differences in interaction patterns between AC and CC might reflect distinct underlying pathobiological processes. This could inform the development of more personalized treatment strategies tailored to the specific cellular communication networks active in a patient's disease state.
- Preclinical Model Insights: As this data is from mouse colon, these findings provide valuable insights for understanding human colon pathologies and for evaluating potential drug candidates in preclinical models. Further validation of these interactions in human colon samples would be a crucial next step.
---
References:
[1] GeneCards: ICAM1. https://www.genecards.org/cgi-bin/carddisp.pl?gene=ICAM1
[2] PubMed Search: IL1A inflammation colon. https://pubmed.ncbi.nlm.nih.gov/?term=IL1A+inflammation+colon
[3] PubMed Search: JAG1 NOTCH signaling colon inflammation. https://pubmed.ncbi.nlm.nih.gov/?term=JAG1+NOTCH+signaling+colon+inflammation
10. Condition-Specific Cell-Cell Interaction Patterns in Mouse Colon
[Analysis Visualization Results]...
Analysis Overview
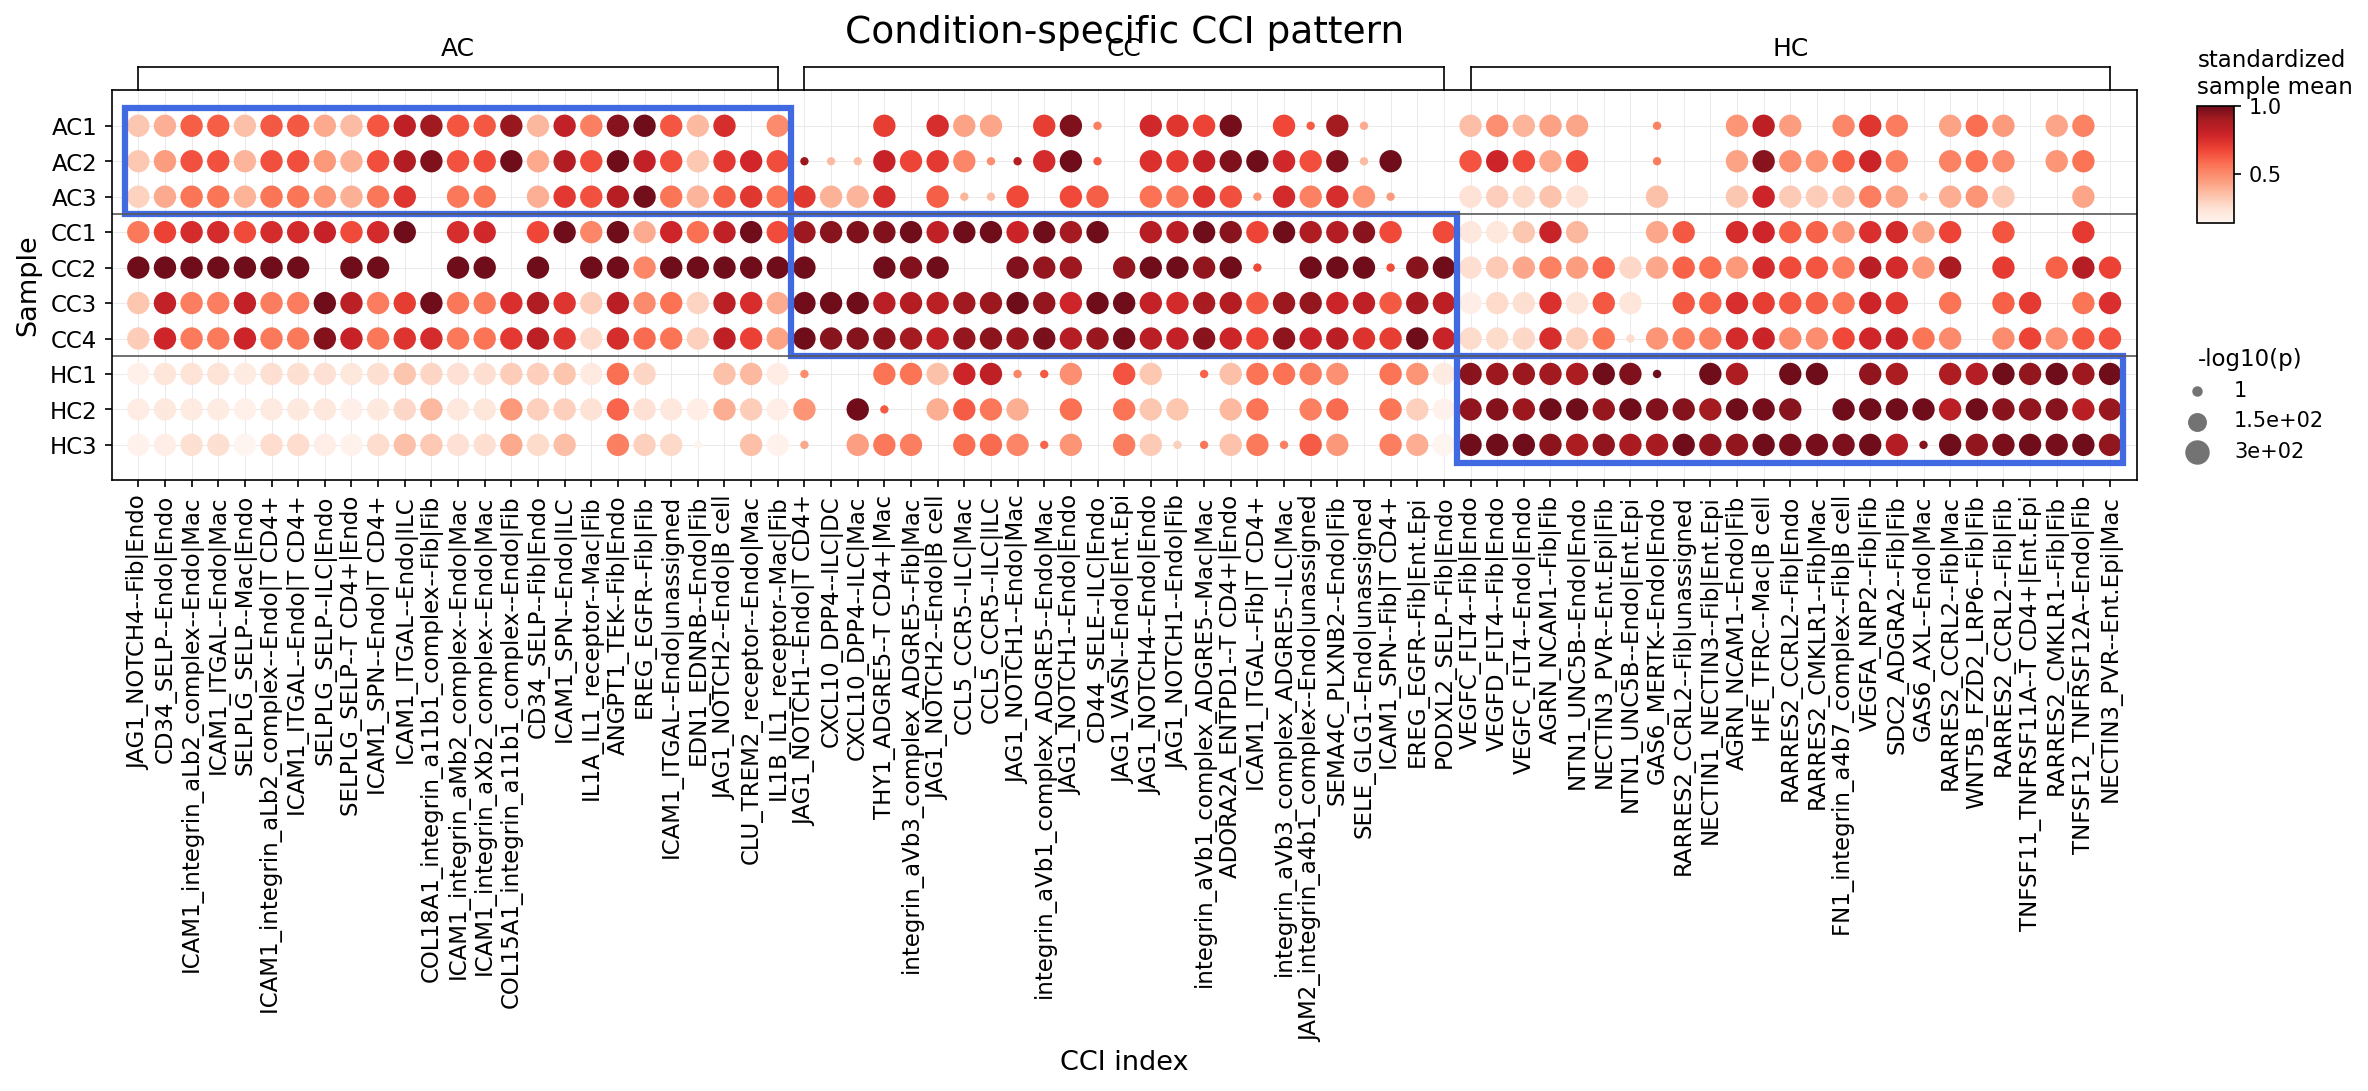
This analysis investigates statistically significant differences in cell-cell interactions (CCIs) among major immune and stromal cell populations in the mouse colon across three conditions: AC, CC, and HC (Healthy Control). CellPhoneDB was used to infer ligand-receptor interactions, and the results are presented as a dot plot, showing the standardized mean interaction strength (dot color) and statistical significance (-log10(p-value), dot size) for selected interactions in each sample and condition. The analysis focuses on interactions involving Myeloid cells, T cells, B cells, Stromal cells, and Endothelial cells, with up to 25 key interactions per condition highlighted for their significant differential activity.
Visual Summary
The dot plot clearly visualizes distinct cell-cell interaction landscapes across the AC, CC, and HC conditions.
- Overall Pattern: There is a striking difference between the Healthy Control (HC) condition and the AC and CC conditions. HC samples generally show a much sparser pattern of interactions, with lower mean expression (lighter red/pink dots) and smaller dot sizes (less statistical significance) for most displayed interactions compared to AC and CC. This indicates that AC and CC conditions are characterized by a significantly higher number and stronger intensity of active cell-cell communications.
- AC Condition (Left Panel): This condition displays a rich network of strong and significant interactions (dark red, large dots) across all AC samples (AC1, AC2, AC3). Prominent interactions involve:
- Adhesion and Immune Cell Recruitment: Multiple ICAM1-integrin pairs (e.g., ICAM1_integrin_aLb2_complex--Endo|Mac, ICAM1_integrin_aLb2_complex--Endo|T CD4+) are highly active, suggesting strong endothelial-macrophage and endothelial-T cell adhesion. SELPLG-related interactions (e.g., SELPLG_SELP--Endo|T CD4+) are also prominent, indicating leukocyte rolling and extravasation.
- Stromal-Endothelial Crosstalk: Interactions like COL18A1-integrin_a11b1_complex--Endo|Fib and ANGPT1-TEK--Fib|Endo are evident, pointing towards active processes in angiogenesis and extracellular matrix remodeling involving fibroblasts and endothelial cells.
- Developmental/Signaling Pathways: JAG1-NOTCH4--Fib|Endo also shows notable activity.
- CC Condition (Middle Panel): Similar to AC, the CC condition (CC1, CC2, CC3, CC4 samples) also shows numerous strong and significant interactions, but with a largely distinct set of ligand-receptor pairs compared to AC. Key patterns include:
- Immune-Stromal Signaling: Interactions such as integrin_aVb3_complex-ADGRE5--Fib|Mac are highly active, highlighting specific communication between fibroblasts and macrophages.
- Chemokine Signaling: CXCL10-DPP4--ILC|DC and CCL5-CCR5--ILC|Mac are prominent, suggesting robust chemokine-mediated recruitment and activation of innate lymphoid cells (ILCs), dendritic cells (DCs), and macrophages.
- Notch Signaling: A cluster of JAG1-NOTCH1 interactions (e.g., JAG1_NOTCH1--Endo|Mac, JAG1_NOTCH1--Endo|ILC) is highly active.
- Immune Adhesion: CD44-SELE--ILC|Endo indicates ILC adhesion to endothelial cells.
- HC Condition (Right Panel): In contrast to AC and CC, HC samples (HC1, HC2, HC3) exhibit a minimal set of highly active interactions. The few interactions that are prominent in HC, typically show lower mean expression values and smaller dot sizes compared to the disease conditions, and are generally distinct from those in AC and CC. Noteworthy interactions include:
- Homeostatic Epithelial-Stromal/Endothelial Crosstalk: NTN1-UNC5B--Endo|Ent.Epi and NECTIN3-PVR--Ent.Epi|Fib suggest specific epithelial communication with endothelial and fibroblast cells, potentially related to tissue maintenance or neuronal guidance.
- Lymphangiogenesis/Angiogenesis: VEGFC-FLT4--Fib|Endo is observed.
- Immune-B Cell Regulation: RARRERS2-CMKLR1--Fib|B cell.
- T Cell-Epithelial Interactions: TNFSF11-TNFRSF11A--T CD4+|Ent.Epi suggests a role in T cell activation and epithelial cell regulation in a healthy state.
Biological Interpretation
The observed condition-specific CCI patterns provide critical biological insights into the distinct physiological and pathological states of the mouse colon. The significant upregulation and diversification of CCIs in AC and CC conditions, compared to HC, strongly suggest active inflammatory and tissue remodeling processes associated with disease.
- Inflammatory Activation in AC and CC: The extensive array of strong CCIs in AC and CC points to a highly activated microenvironment. Many of these interactions involve immune cells (Macrophages, T cells, ILCs, DCs) and stromal cells (Endothelial cells, Fibroblasts), which are central players in driving inflammation, immune cell trafficking, and tissue repair/fibrosis in the colon.
- AC-Specific Inflammation: The dominance of ICAM1-integrin interactions reflects robust adhesion and transmigration of leukocytes (macrophages, T cells) through the endothelium into the inflamed tissue, a hallmark of inflammation [1]. SELPLG (P-selectin glycoprotein ligand 1) interactions further support leukocyte recruitment [2]. ANGPT1-TEK (Tie-2) signaling between fibroblasts and endothelial cells is crucial for angiogenesis and vascular stability, which can be altered in inflammatory conditions and cancer [3].
- CC-Specific Inflammation: The prominent CXCL10-DPP4 and CCL5-CCR5 axes are key chemokine signaling pathways that recruit and activate various immune cells, including ILCs, DCs, and macrophages, orchestrating inflammatory responses [4, 5]. JAG1-NOTCH1 signaling, which is highly active in CC, is a critical pathway involved in cell fate determination, proliferation, and differentiation, and is often dysregulated in inflammatory diseases and cancer [6]. The integrin_aVb3_complex-ADGRE5 interaction highlights specific crosstalk between fibroblasts and macrophages that may mediate matrix remodeling and immune modulation.
- Homeostatic Interactions in HC: The relatively subdued CCI landscape in HC suggests a balanced, non-inflammatory state. The specific interactions identified, such as NTN1-UNC5B (involved in axon guidance and also reported in immune cell trafficking and angiogenesis) [7] and VEGFC-FLT4 (critical for lymphangiogenesis) [8], likely represent baseline communication essential for maintaining tissue structure, epithelial integrity, and immune surveillance in the healthy colon. The TNFSF11 (RANKL)-TNFRSF11A (RANK) interaction between T cells and intestinal epithelial cells is known to be involved in epithelial cell proliferation and survival, and immune regulation in the gut [9].
Clinical or Translational Implications
The distinct and highly active CCI profiles in AC and CC conditions, as opposed to the quiescent HC state, offer significant translational potential.
- Biomarker Discovery: The identified condition-specific ligand-receptor pairs could serve as valuable biomarkers for diagnosing or distinguishing between different disease states (e.g., adenoma/carcinoma vs. colitis) in the colon. Monitoring the activity of these specific CCIs could aid in patient stratification and response to therapy.
- Therapeutic Targets: The highly active CCI axes in AC and CC represent promising therapeutic targets.
- For AC, blocking specific ICAM1-integrin interactions or SELPLG on endothelial cells could attenuate immune cell infiltration and reduce inflammation or tumor progression.
- For CC, inhibiting chemokine receptors like CCR5 or enzymes like DPP4 (which can cleave CXCL10) could modulate immune cell recruitment and dampen the inflammatory cascade. Targeting JAG1-NOTCH1 signaling, which is implicated in various inflammatory and oncogenic processes, could also be explored as a therapeutic strategy.
- Modulating fibroblast-macrophage interactions, such as the integrin_aVb3_complex-ADGRE5 axis, could be a strategy to control tissue remodeling and fibrosis often associated with chronic inflammation.
- Mechanistic Insights: Understanding these specific interactions provides deeper mechanistic insights into the pathogenesis of colon diseases. For example, the prominence of specific endothelial-immune cell interactions in AC highlights the importance of vascular activation and immune cell recruitment. In CC, the distinct chemokine and Notch signaling pathways suggest specific molecular drivers of inflammation and cellular differentiation.
These findings from mouse models provide a foundation for further investigation into human colorectal diseases, potentially leading to novel diagnostic tools and targeted therapies.
---
References
- ICAM1 (CD54) - GeneCards: https://www.genecards.org/cgi-bin/carddisp.pl?gene=ICAM1
- SELPLG (PSGL1) - GeneCards: https://www.genecards.org/cgi-bin/carddisp.pl?gene=SELPLG
- ANGPT1 - GeneCards: https://www.genecards.org/cgi-bin/carddisp.pl?gene=ANGPT1
- CXCL10 - GeneCards: https://www.genecards.org/cgi-bin/carddisp.pl?gene=CXCL10
- CCL5 - GeneCards: https://www.genecards.org/cgi-bin/carddisp.pl?gene=CCL5
- JAG1 - GeneCards: https://www.genecards.org/cgi-bin/carddisp.pl?gene=JAG1
- NTN1 - GeneCards: https://www.genecards.org/cgi-bin/carddisp.pl?gene=NTN1
- VEGFC - GeneCards: https://www.genecards.org/cgi-bin/carddisp.pl?gene=VEGFC
- TNFSF11 (RANKL) - GeneCards: https://www.genecards.org/cgi-bin/carddisp.pl?gene=TNFSF11
11. Macrophage Condition-Specific Surfaceome Markers in Mouse Colon
[Analysis Visualization Results]...
Analysis Overview
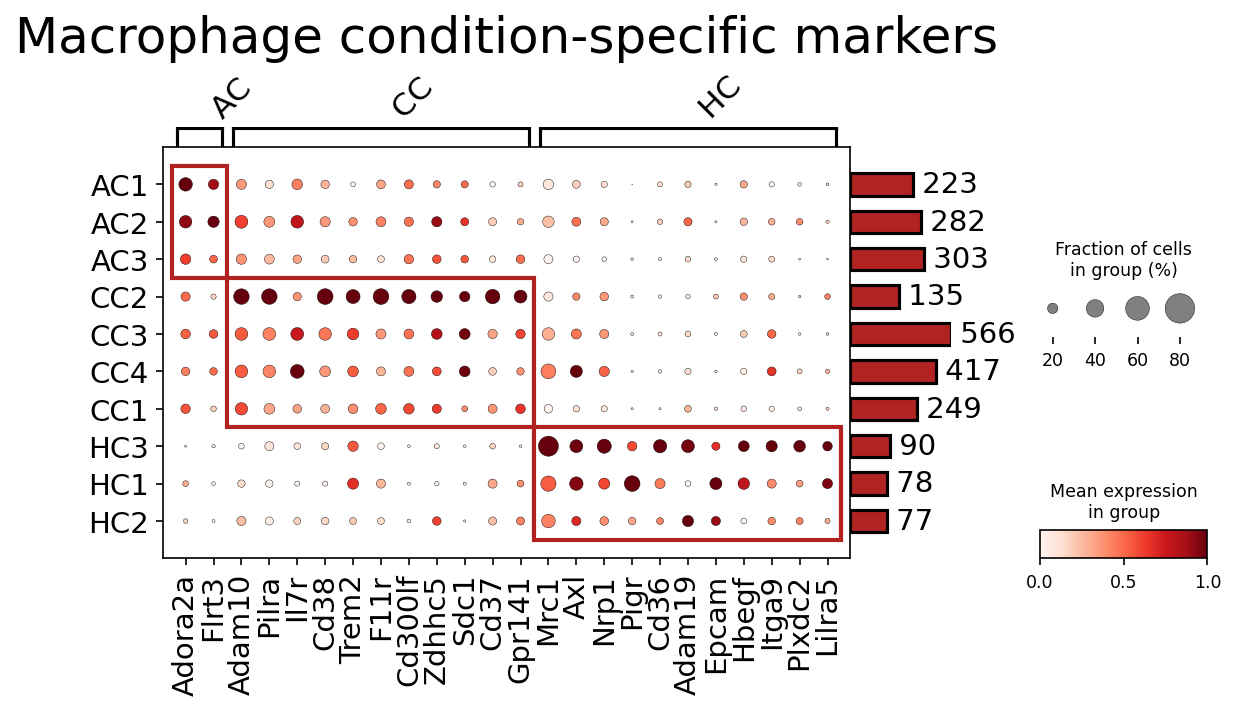
This analysis aimed to identify surfaceome markers that are specifically expressed by macrophages under different conditions (Acute Colitis (AC), Chronic Colitis (CC), and Healthy Control (HC)) in mouse colon tissue. Utilizing single-cell RNA sequencing data, the plot_markers_and_expression_dot tool was used to visualize the expression levels and prevalence of these surface markers across individual samples, which are grouped by their respective conditions. The goal was to pinpoint up to 50 surface markers per condition that could effectively distinguish macrophage states in AC, CC, and HC.
Visual Summary
The dot plot effectively visualizes two key aspects for each surface marker: the mean expression level (indicated by color intensity, from light to dark red for low to high expression) and the fraction of cells expressing the marker within each sample group (indicated by dot size, larger dots representing higher prevalence).
- Sample and Gene Clustering: Both samples (on the y-axis) and genes (on the x-axis) are hierarchically clustered, revealing clear condition-specific groupings. The samples neatly separate into AC, CC, and HC clusters, demonstrating distinct transcriptional programs in macrophages across these conditions.
- AC-specific Markers: A distinct cluster of genes, notably Adora2a, Flrt3, Adam10, and Pilra, shows high expression and prevalence specifically in AC samples (AC1, AC2, AC3). These markers are either absent or expressed at very low levels in macrophages from CC and HC samples, highlighting an acute inflammatory signature.
- CC-specific Markers: A larger, prominent group of markers, including Il7r, Cd38, Trem2, F11r, Cd300lf, Zdhhc5, Sdc1, Cd37, and Gpr141, demonstrates strong and widespread expression in CC samples (CC1, CC2, CC3, CC4). Genes like Trem2 and Cd38 show particularly high expression and prevalence across these samples, suggesting a specific macrophage activation state in chronic inflammation.
- HC-specific Markers: In the healthy control (HC) samples (HC1, HC2, HC3), a different set of markers, such as Mrc1, Axl, Nrp1, Pigr, Cd36, Adam19, Hbegf, Itga9, Plxdc2, and Lilra5, are predominantly expressed. These markers are largely absent or very low in AC and CC samples, indicating a unique homeostatic macrophage signature.
- Sample Variability: While clear condition-specific patterns emerge, some variability in marker expression and prevalence is observed across individual samples within each condition (e.g., CC2 shows generally higher expression for many CC-specific markers compared to other CC samples).
- Cell Numbers: The bar graph on the right indicates the number of macrophage cells per sample, with CC samples generally contributing a higher number of cells to the analysis.
Biological Interpretation
The identified condition-specific surfaceome markers provide crucial biological insights into the distinct functional states of macrophages during acute colitis, chronic colitis, and healthy homeostasis in the colon.
- Healthy Colon Macrophages (HC): The high expression of Mrc1 (CD206) [GeneCards] and Cd36 [GeneCards] suggests a predominant population of tissue-resident, "M2-like" or anti-inflammatory macrophages. These cells are typically involved in efferocytosis, pathogen recognition, and maintaining tissue integrity. Axl [GeneCards] and Nrp1 [GeneCards] are also associated with immune tolerance, tissue repair, and resolution of inflammation, reinforcing a homeostatic and regulatory macrophage phenotype in the healthy gut. Hbegf is a growth factor involved in cellular proliferation and survival, potentially contributing to tissue maintenance.
- Acute Colitis Macrophages (AC): The enrichment of markers like Adora2a (Adenosine A2a receptor) [GeneCards] and Adam10 [GeneCards] points to macrophages actively involved in modulating acute inflammatory responses. Adora2a signaling often dampens excessive inflammation, potentially as a feedback mechanism to control acute immune activation. Adam10, a "sheddase" protease, is involved in cleaving various cell surface proteins, which can regulate inflammation, cell adhesion, and receptor signaling, suggesting its role in early inflammatory events and tissue remodeling. Pilra is an inhibitory receptor that helps regulate myeloid cell activation.
- Chronic Colitis Macrophages (CC): The diverse set of specific surface markers found in CC macrophages indicates a unique and potentially dysregulated functional state associated with persistent inflammation. Trem2 (Triggering Receptor Expressed on Myeloid Cells 2) [GeneCards] is involved in phagocytosis, lipid metabolism, and can influence both pro- and anti-inflammatory responses, suggesting its role in sensing tissue damage or altered metabolic environments during chronic inflammation. Cd38 [GeneCards] is a multifaceted ectoenzyme involved in calcium signaling, immune cell activation, and migration, often highly expressed in inflammatory conditions. Il7r (CD127) [GeneCards], though primarily a T cell marker, can be expressed by other immune cells and implies altered cytokine responsiveness. Sdc1 (Syndecan-1) [GeneCards] is a proteoglycan involved in cell adhesion, growth factor binding, and tissue repair, frequently upregulated in chronic inflammation and fibrosis. This marker profile collectively suggests macrophages undergoing significant phenotypic plasticity, possibly engaged in persistent immune activation, tissue damage response, or maladaptive repair processes during chronic colitis.
Clinical or Translational Implications
The identification of condition-specific surfaceome markers on macrophages in the colon holds substantial clinical and translational potential, particularly for diagnostic applications, therapeutic targeting, and refining our understanding of disease mechanisms.
- Diagnostic and Prognostic Biomarkers: These distinct sets of surface markers could serve as valuable diagnostic or prognostic biomarkers for differentiating between acute and chronic phases of colitis, or distinguishing diseased states from healthy tissue. For instance, the unique combination of Trem2 and Cd38 on macrophages might indicate chronic inflammation, while Adora2a could be a signature of an acute inflammatory response. These markers could be assessed in colon biopsies or circulating immune cells using techniques like flow cytometry or immunohistochemistry.
- Therapeutic Targets: As these are cell surface proteins, they represent highly accessible targets for therapeutic intervention.
- For chronic colitis (CC), targeting markers such as Trem2 or Cd38 could offer avenues to modulate macrophage function, aiming to reduce persistent inflammation or promote disease resolution. For example, inhibition of CD38 has shown therapeutic potential in other inflammatory and autoimmune diseases [NCBI].
- In acute colitis (AC), modulating Adora2a signaling could help fine-tune the early inflammatory cascade, potentially preventing excessive tissue damage.
- Understanding the roles of markers like Mrc1 and Cd36 on healthy macrophages is crucial to develop therapies that specifically target pathogenic macrophage populations while sparing beneficial, homeostatic cells.
- Cell-Specific Drug Delivery: These markers could be exploited for targeted drug delivery strategies. Therapeutic agents conjugated to antibodies specific for Trem2 or Cd38 on CC macrophages, or Adora2a on AC macrophages, could allow for precise drug delivery to diseased cells, thereby enhancing efficacy and reducing off-target side effects.
- Ex Vivo Cell Sorting and Functional Studies: The identified markers provide valuable tools for the precise isolation and characterization of distinct macrophage subpopulations from colon samples using methods like Fluorescence-Activated Cell Sorting (FACS). This would facilitate further in-depth functional studies to elucidate the specific roles of these macrophage states in disease pathogenesis.
- Experimental Validation: Future research should focus on experimentally validating the functional significance of these identified markers in relevant mouse models of colitis and, critically, in human patient cohorts. This would involve *in vitro* functional assays (e.g., cytokine production, phagocytosis) and *in vivo* manipulation (e.g., genetic knockout or antibody-mediated blockade) of these surface molecules to confirm their roles in disease progression and therapeutic response.
12. Fibroblast Condition-Specific Surfaceome Markers in Colon Tissue
[Analysis Visualization Results]...
Analysis Overview
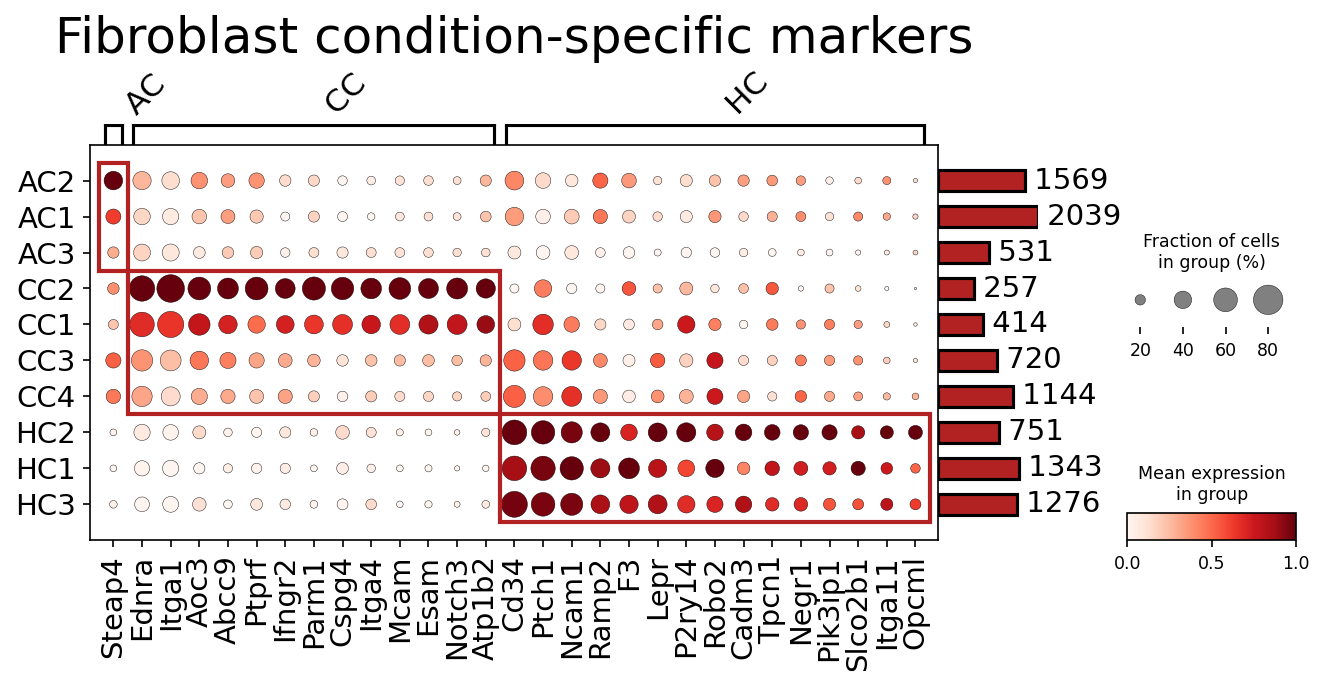
This analysis identifies and visualizes surfaceome markers specifically expressed by Fibroblasts across different conditions (AC, CC, HC) and individual samples within mouse colon tissue. The dot plot displays the mean expression level (color intensity) and the fraction of cells expressing each marker (dot size) for each sample. The goal is to pinpoint surface proteins that are uniquely associated with particular conditions, offering insights into fibroblast biology in health and disease and potential targets for therapeutic intervention or diagnostic applications.
Visual Summary
The dot plot clearly segregates Fibroblast surfaceome markers into three main groups, each predominantly associated with one of the experimental conditions: AC, CC, or HC.
- Condition AC (Samples AC1, AC2, AC3): A distinct cluster of markers, including *Steap4*, *Ednra*, *Itga1*, *Aoc3*, and *Abcc9*, shows higher expression and prevalence in AC samples. While the expression and fraction of cells for these markers are notable, they are generally less intensely expressed and in a smaller fraction of cells compared to the predominant markers in CC and HC.
- Condition CC (Samples CC1, CC2, CC3, CC4): A prominent and strongly expressed set of markers characterizes the CC condition. Key genes in this cluster include *Ptprf*, *Ifngr2*, *Parm1*, *Cspg4*, *Itga4*, *Mcam*, *Esam*, *Notch3*, and *Atp1b2*. These markers show high mean expression (dark red) and are present in a large fraction of cells (large dot size) within the CC samples, particularly in CC1 and CC2.
- Condition HC (Samples HC1, HC2, HC3): The healthy control samples exhibit another distinct set of highly expressed and prevalent surfaceome markers, such as *Cd34*, *Ptch1*, *Ncam1*, *Ramp2*, *F3*, *Lepr*, *P2ry14*, *Robo2*, *Cadm3*, *Tpcn1*, *Negr1*, *Pik3ip1*, *Slco2b1*, *Itga11*, and *Opcm1*. These markers are specifically enriched in HC samples, with minimal expression in AC and CC samples.
The number of Fibroblast cells analyzed per sample, indicated by the bar plot on the right, varies considerably (e.g., CC2 has 257 cells, while AC2 has 2039 cells). The consistent pattern of marker expression within each condition, despite varying cell numbers, reinforces the condition-specific nature of these markers.
Biological Interpretation
The observed condition-specific surfaceome profiles of Fibroblasts in the colon suggest distinct functional states and roles in the different pathological or physiological contexts.
Condition AC Fibroblasts (e.g., *Ednra*, *Itga1*, *Aoc3*):
- _Ednra_ (Endothelin receptor type A): Endothelin-1/EDNRA signaling plays a role in vasoconstriction, fibrosis, inflammation, and cell proliferation, often implicated in various pathological processes including cancer progression and chronic inflammation. Its upregulation in AC could signify a pro-fibrotic or pro-inflammatory activation of fibroblasts, potentially contributing to early disease development or a specific inflammatory response. GeneCards: EDNRA
- _Itga1_ (Integrin alpha 1): Integrins are cell adhesion molecules involved in cell-extracellular matrix (ECM) interactions. ITGA1 typically heterodimerizes with ITGB1 to form VLA-1, which binds to collagens and laminins. Its presence might indicate altered ECM remodeling or cell-matrix interactions in AC. UniProt: P56199 (ITGA1_MOUSE)
- _Aoc3_ (Amine oxidase, copper containing 3) / VAP-1: This enzyme is involved in inflammation and immune cell trafficking, often expressed on endothelial cells but also on activated fibroblasts. Its upregulation could indicate an inflammatory or immune-modulatory role of AC fibroblasts. GeneCards: AOC3
These markers collectively point towards an activated fibroblast phenotype in AC, potentially involved in early inflammatory responses or pathological remodeling.
Condition CC Fibroblasts (e.g., *Ptprf*, *Ifngr2*, *Cspg4*, *Mcam*, *Notch3*):
- _Ifngr2_ (Interferon gamma receptor 2): IFN-gamma signaling is central to immune responses and inflammation. Upregulation of IFNgR2 suggests that CC fibroblasts are highly responsive to IFN-gamma, indicating their active involvement in the chronic inflammatory milieu of colitis. This could drive pro-inflammatory or anti-fibrotic (or pro-fibrotic, depending on context) responses in these cells. GeneCards: IFNGR2
- _Cspg4_ (Chondroitin sulfate proteoglycan 4) / NG2: NG2 is a proteoglycan expressed on pericytes, some glia, and certain activated fibroblasts. It's involved in cell proliferation, migration, and angiogenesis, and can mark mesenchymal stem cells or cancer-associated fibroblasts. Its presence in CC could indicate a proliferative, migratory, or stem-like phenotype for these fibroblasts, potentially contributing to tissue repair, fibrosis, or chronic inflammation. UniProt: Q62089 (CSPG4_MOUSE)
- _Mcam_ (Melanoma cell adhesion molecule) / CD146: CD146 is expressed on endothelial cells, pericytes, and some mesenchymal stromal cells, mediating cell adhesion and migration. Its increased expression in CC fibroblasts could contribute to vascular remodeling, immune cell interaction, or fibroblast recruitment in the inflamed colon. GeneCards: MCAM
- _Notch3_: Notch signaling is critical for cell-fate determination, proliferation, and differentiation. NOTCH3 activation has been implicated in fibrosis and inflammation in various tissues, suggesting that CC fibroblasts are actively participating in tissue remodeling and potentially maintaining a chronic inflammatory state. GeneCards: NOTCH3
These markers collectively highlight an activated, highly inflammatory, and remodeling fibroblast phenotype characteristic of conditions like colitis, actively interacting with immune cells and modifying the ECM.
Condition HC Fibroblasts (e.g., *Cd34*, *Ptch1*, *Ncam1*, *F3*, *Lepr*):
- _Cd34_: CD34 is a well-known marker of hematopoietic stem cells and endothelial progenitor cells, but also identifies specific stromal fibroblast subpopulations, including those with progenitor or quiescent properties in various tissues. Its high expression in HC fibroblasts suggests a role in maintaining tissue homeostasis or a quiescent, possibly progenitor-like, state in healthy colon. GeneCards: CD34
- _Ptch1_ (Patched homolog 1): PTCH1 is a receptor for Hedgehog ligands and a key component of the Hedgehog signaling pathway, important in embryonic development, tissue regeneration, and stem cell maintenance. Its presence on healthy fibroblasts could indicate their role in maintaining tissue integrity and regenerative capacity through homeostatic signaling. GeneCards: PTCH1
- _Ncam1_ (Neural cell adhesion molecule 1) / CD56: NCAM1 is involved in cell-cell adhesion, cell migration, and neurite outgrowth. While associated with neuronal cells, it can also be found on some stromal cells and its expression here might indicate unique adhesive properties or interactions within the healthy colon niche. GeneCards: NCAM1
- _Lepr_ (Leptin receptor): Leptin, a hormone mainly produced by adipocytes, plays roles in metabolism, inflammation, and fibrosis. LEPR expression on fibroblasts can mediate pro-fibrotic effects. Its presence in healthy colon fibroblasts might suggest a role in metabolic regulation or maintaining baseline tissue composition. GeneCards: LEPR
These markers collectively suggest a quiescent, homeostatic, and potentially stem-like or developmentally regulated fibroblast phenotype in healthy colon tissue, distinct from activated disease states.
Clinical or Translational Implications
The identification of condition-specific surfaceome markers on Fibroblasts holds significant clinical and translational potential:
- Biomarkers for Disease Diagnosis and Prognosis: The unique surface marker profiles could serve as diagnostic or prognostic biomarkers for distinguishing between different colon conditions (AC, CC, HC). For example, a panel of CC-specific markers (*Ifngr2*, *Cspg4*, *Mcam*, *Notch3*) could be used to identify or grade active colitis. These could be detected in tissue biopsies via immunohistochemistry or immunofluorescence, or potentially in circulating cells (if fibroblasts exfoliate) or extracellular vesicles from liquid biopsies.
- Therapeutic Targets: Surface proteins are highly accessible targets for therapeutic interventions.
- For Condition AC (e.g., *Ednra*, *Aoc3*), targeting EDNRA with antagonists could mitigate pro-fibrotic or pro-inflammatory responses, potentially slowing disease progression or improving outcomes in early stages. AOC3 inhibition could reduce immune cell infiltration.
- For Condition CC (e.g., *Ifngr2*, *Cspg4*, *Mcam*, *Notch3*), inhibiting IFNgR2 could modulate inflammatory signaling, while targeting CSPG4 or MCAM could disrupt fibroblast proliferation, migration, or adhesion, potentially reducing fibrosis or inflammation. NOTCH3 inhibition could suppress chronic fibroblast activation. Such targets could be addressed using monoclonal antibodies or small molecule inhibitors.
- Experimental Validation: The identified markers provide excellent candidates for further experimental validation.
- Flow Cytometry or Mass Cytometry: These surface markers can be used to isolate specific fibroblast subpopulations from patient samples or animal models, allowing for functional characterization in vitro or in vivo.
- Immunohistochemistry/Immunofluorescence: Staining for these markers in colon tissue sections could spatially map these distinct fibroblast populations and confirm their localization in AC, CC, or HC contexts.
- Functional Assays: Modulating the expression or activity of these genes in fibroblast cell lines or organoid models could elucidate their precise roles in inflammation, fibrosis, or tissue repair, further validating their therapeutic potential.
13. T cell CD4+ Condition-Specific Surfaceome Markers
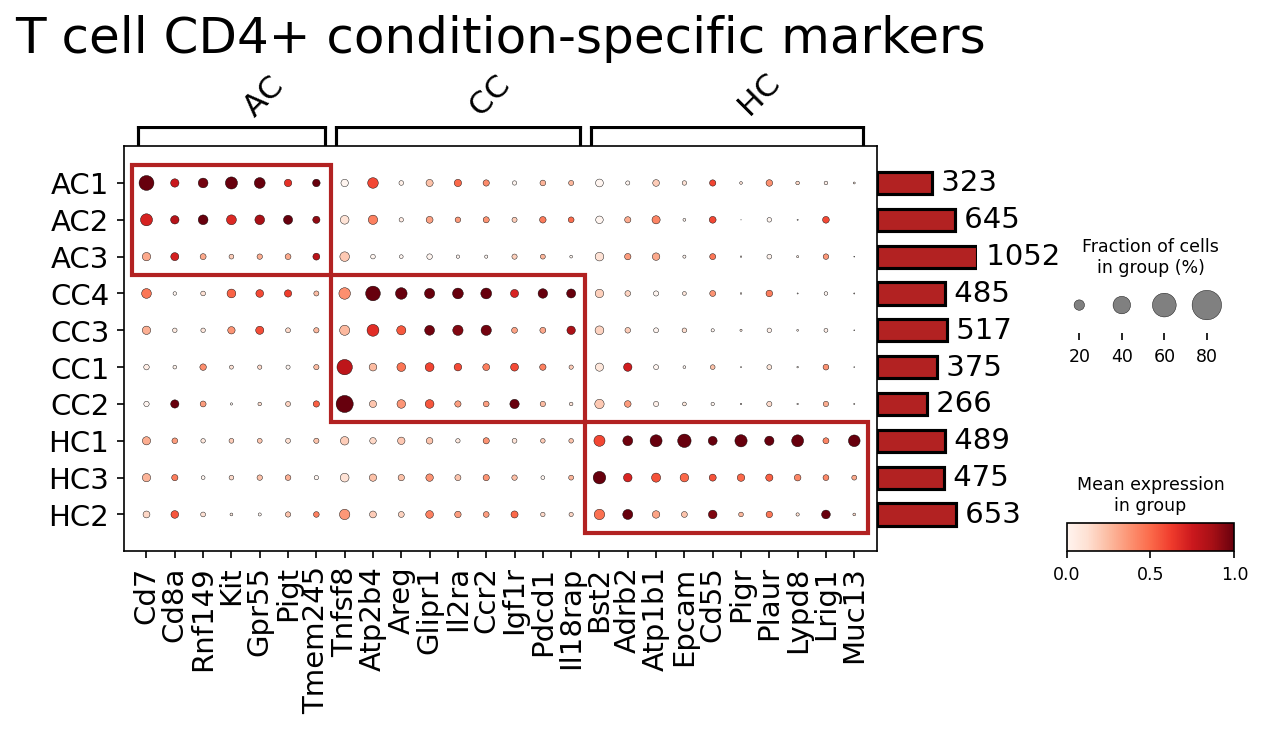
[Analysis Visualization Results]...
Analysis Overview
This analysis aimed to identify surfaceome markers that are specifically enriched in CD4+ T cells under different conditions (Acute Colitis (AC), Chronic Colitis (CC), and Healthy Control (HC)) within the colon tissue. The plot_markers_and_expression_dot tool was used, with parameters configured to find up to 50 surfaceome markers per condition based on differential expression and prevalence, comparing each condition against the rest. The results are visualized as a dot plot, showing the mean expression level and the fraction of cells expressing each marker across individual samples grouped by condition.
Visual Summary
The dot plot effectively visualizes condition-specific patterns of surfaceome gene expression in CD4+ T cells across the samples.
- Condition-Specific Clustering: Distinct clusters of markers are evident for each condition, highlighted by the red boxes. This indicates that different sets of surface proteins are upregulated or uniquely expressed in CD4+ T cells depending on the disease state (AC vs. CC) or healthy status (HC).
- AC Markers: A group of genes, including Cd7, Rnf149, Kit, Gpr55, Pigt, Tmem245, and Tnfsf8, show strong and prevalent expression specifically in AC samples (AC1, AC2, AC3).
- CC Markers: Another distinct set of genes, notably Atp2b4, Areg, Glipr1, Il2ra, Ccr2, Igf1r, Pdcd1, and Il18rap, are highly expressed across CC samples (CC1, CC2, CC3, CC4).
- HC Markers: Markers like Bst2, Adrb2, Atp1b1, Cd55, Plaur, Lypd8, Lrig1, and Muc13 are predominantly expressed in HC samples (HC1, HC2, HC3).
- Expression and Prevalence: The color intensity (darker red for higher mean expression) and dot size (larger for higher fraction of cells expressing the gene) clearly differentiate robustly expressed and widely detected markers from those with weaker or sporadic expression within a group.
- Sample-Level Variation: While general patterns are condition-specific, some variability in expression intensity and prevalence can be observed between individual samples within the same condition, which might reflect heterogeneity in disease progression or individual responses. The number of cells per sample, indicated by the bar chart on the right, shows variability (e.g., AC3 has 1052 cells, while CC2 has 266), which is important context for interpreting the robustness of marker detection in smaller samples.
Biological Interpretation
Markers Associated with Acute Colitis (AC)
The CD4+ T cells in Acute Colitis show upregulation of several surfaceome markers:
- Cd7 (CD7 molecule): A transmembrane glycoprotein found on most T cells, NK cells, and some myeloid cells. Its role in T cell activation and adhesion suggests enhanced immune cell activity in acute inflammation [GeneCards].
- Kit (c-Kit, CD117): A receptor tyrosine kinase expressed on hematopoietic stem cells, mast cells, ILCs, and some activated T cells. Its presence on CD4+ T cells in AC could indicate a specific activation state or a subset involved in inflammatory responses, potentially interacting with stem cell factor [GeneCards].
- Tnfsf8 (CD153, LIGHT): A member of the TNF superfamily, important for T cell-B cell interactions, T cell activation, and inflammation. Its upregulation suggests active immune responses and cell-cell communication driving inflammation in AC [GeneCards].
- Cd8a (CD8a molecule): While Cd8a typically marks cytotoxic CD8+ T cells, its detection here in CD4+ T cells in AC is noteworthy. Some activated or unconventional CD4+ T cell subsets have been reported to express Cd8a during specific inflammatory conditions, suggesting a potential shift towards a cytotoxic or specialized effector function [GeneCards]. This finding warrants further experimental validation to confirm co-expression on CD4+ T cells and explore its functional implications.
Markers Associated with Chronic Colitis (CC)
CD4+ T cells in Chronic Colitis exhibit a distinct set of surfaceome markers, many of which point towards persistent immune activation, tissue remodeling, and immune regulation:
- Areg (Amphiregulin): An EGF family growth factor involved in tissue repair, inflammation, and immune modulation. Expressed by various immune cells, including T cells, Areg might play a role in both perpetuating inflammation and attempting tissue repair in chronic colitis [GeneCards].
- Il2ra (CD25): The alpha chain of the IL-2 receptor, crucial for T cell activation, proliferation, and the function of regulatory T cells (Tregs). High Il2ra expression suggests sustained T cell activation and potentially an attempt at immune regulation in the chronic inflammatory environment [GeneCards].
- Ccr2 (CD192): A chemokine receptor primarily known for recruiting monocytes and macrophages. Its expression on CD4+ T cells in CC could imply their involvement in the sustained recruitment of myeloid cells to the inflamed colon, contributing to chronic inflammation [GeneCards].
- Pdcd1 (PD-1): Programmed cell death protein 1, a key immune checkpoint receptor. Upregulation of Pdcd1 on T cells is a hallmark of T cell exhaustion, often observed in chronic inflammation and cancer. This suggests that CD4+ T cells in CC may be experiencing chronic antigen stimulation leading to an exhausted phenotype, limiting their effector function [GeneCards].
- Igf1r (Insulin-like growth factor 1 receptor): A receptor tyrosine kinase involved in cell growth, differentiation, and survival. Its expression may indicate involvement in tissue remodeling, cell survival pathways, or metabolic adaptation of T cells in the chronic inflammatory milieu [GeneCards].
Markers Associated with Healthy Control (HC)
CD4+ T cells from healthy individuals show a different surfaceome profile, likely reflecting a quiescent or homeostatic state:
- Bst2 (CD317, Tetherin): An interferon-induced antiviral restriction factor, expressed on various immune cells. Its presence might reflect basal immune surveillance [GeneCards].
- Adrb2 (Beta-2 adrenergic receptor): A G protein-coupled receptor involved in modulating immune responses, often inhibitory. Its expression could suggest responsiveness to neuro-immune regulatory signals in homeostasis [GeneCards].
- Cd55 (DAF, Decay-accelerating factor): A complement regulatory protein that protects cells from complement-mediated damage. Its expression suggests a mechanism for maintaining cellular integrity and preventing inadvertent immune attack in healthy tissue [GeneCards].
- Unusual Markers (Epcam, Pigr, Muc13): Genes like Epcam (Epithelial cell adhesion molecule), Pigr (Polymeric immunoglobulin receptor), and Muc13 (Mucin 13) are typically associated with epithelial cells rather than T cells. Their detection as "surfaceome markers for T cell CD4+" in healthy controls is highly unexpected and requires careful scrutiny. Potential explanations include:
- Cell doublet capture: T cells physically associated with epithelial cells during single-cell capture.
- Contamination/misannotation: A small population of epithelial cells mistakenly classified as T cell CD4+.
- Phagocytosis: T cells having internalized epithelial cell fragments.
- Unique T cell subset: A very rare, uncharacterized subset of T cells that acquires these markers, possibly due to interaction with epithelial cells or a specific tissue-resident phenotype in the colon.
Given the strong and prevalent expression of Epcam and Pigr across HC samples, these findings highlight a potential need for further investigation, such as re-evaluating cell type annotation purity, or validating these expressions at the protein level (e.g., via flow cytometry or imaging) to understand their true cellular origin and biological significance in CD4+ T cells.
Clinical or Translational Implications
The identified condition-specific surfaceome markers in CD4+ T cells offer several potential clinical and translational implications:
- Biomarker Discovery: The distinct surfaceome profiles could serve as diagnostic or prognostic biomarkers for differentiating acute colitis, chronic colitis, and healthy states. For instance, high expression of Kit or Tnfsf8 might indicate acute inflammation, while concurrent upregulation of Areg, Il2ra, and Pdcd1 could point towards chronic disease and potential T cell exhaustion. These markers could be assessed using flow cytometry or immunohistochemistry on patient samples.
- Therapeutic Targets: Markers like Pdcd1 (PD-1) in chronic colitis suggest pathways amenable to therapeutic intervention. PD-1 blockade is a known immunotherapeutic strategy for T cell exhaustion, and its upregulation here could inform targeted approaches for chronic inflammatory bowel diseases. Similarly, Ccr2 could be explored as a target to modulate immune cell recruitment in CC.
- Experimental Validation and Functional Studies: The identified markers provide a strong basis for further experimental validation. Flow cytometry could confirm co-expression of these surface proteins on CD4+ T cells. Functional assays could then elucidate the roles of genes like Areg in tissue repair or Kit in acute inflammation, potentially leading to new mechanistic insights into colitis pathogenesis.
- Understanding Disease Mechanisms: The differential expression of these markers provides clues about the distinct immunological processes in AC versus CC. For example, Tnfsf8 in AC suggests a potent pro-inflammatory milieu, while Pdcd1 in CC points to adaptive immune suppression or exhaustion, which are critical for understanding disease progression and developing stage-specific treatments.
- Addressing Unexpected Markers: The detection of epithelial markers (Epcam, Pigr, Muc13) and an atypical T cell marker (Cd8a) on CD4+ T cells underscores the need for robust validation studies. If these are genuine expressions, they could reveal novel, context-dependent T cell phenotypes or interactions within the colon, which could have significant implications for understanding host-microbe interactions or tissue-resident immunity.
14. Differential Expression of Cell Cycle-Related Genes in Intestinal Epithelial Cells Across Colonic Conditions
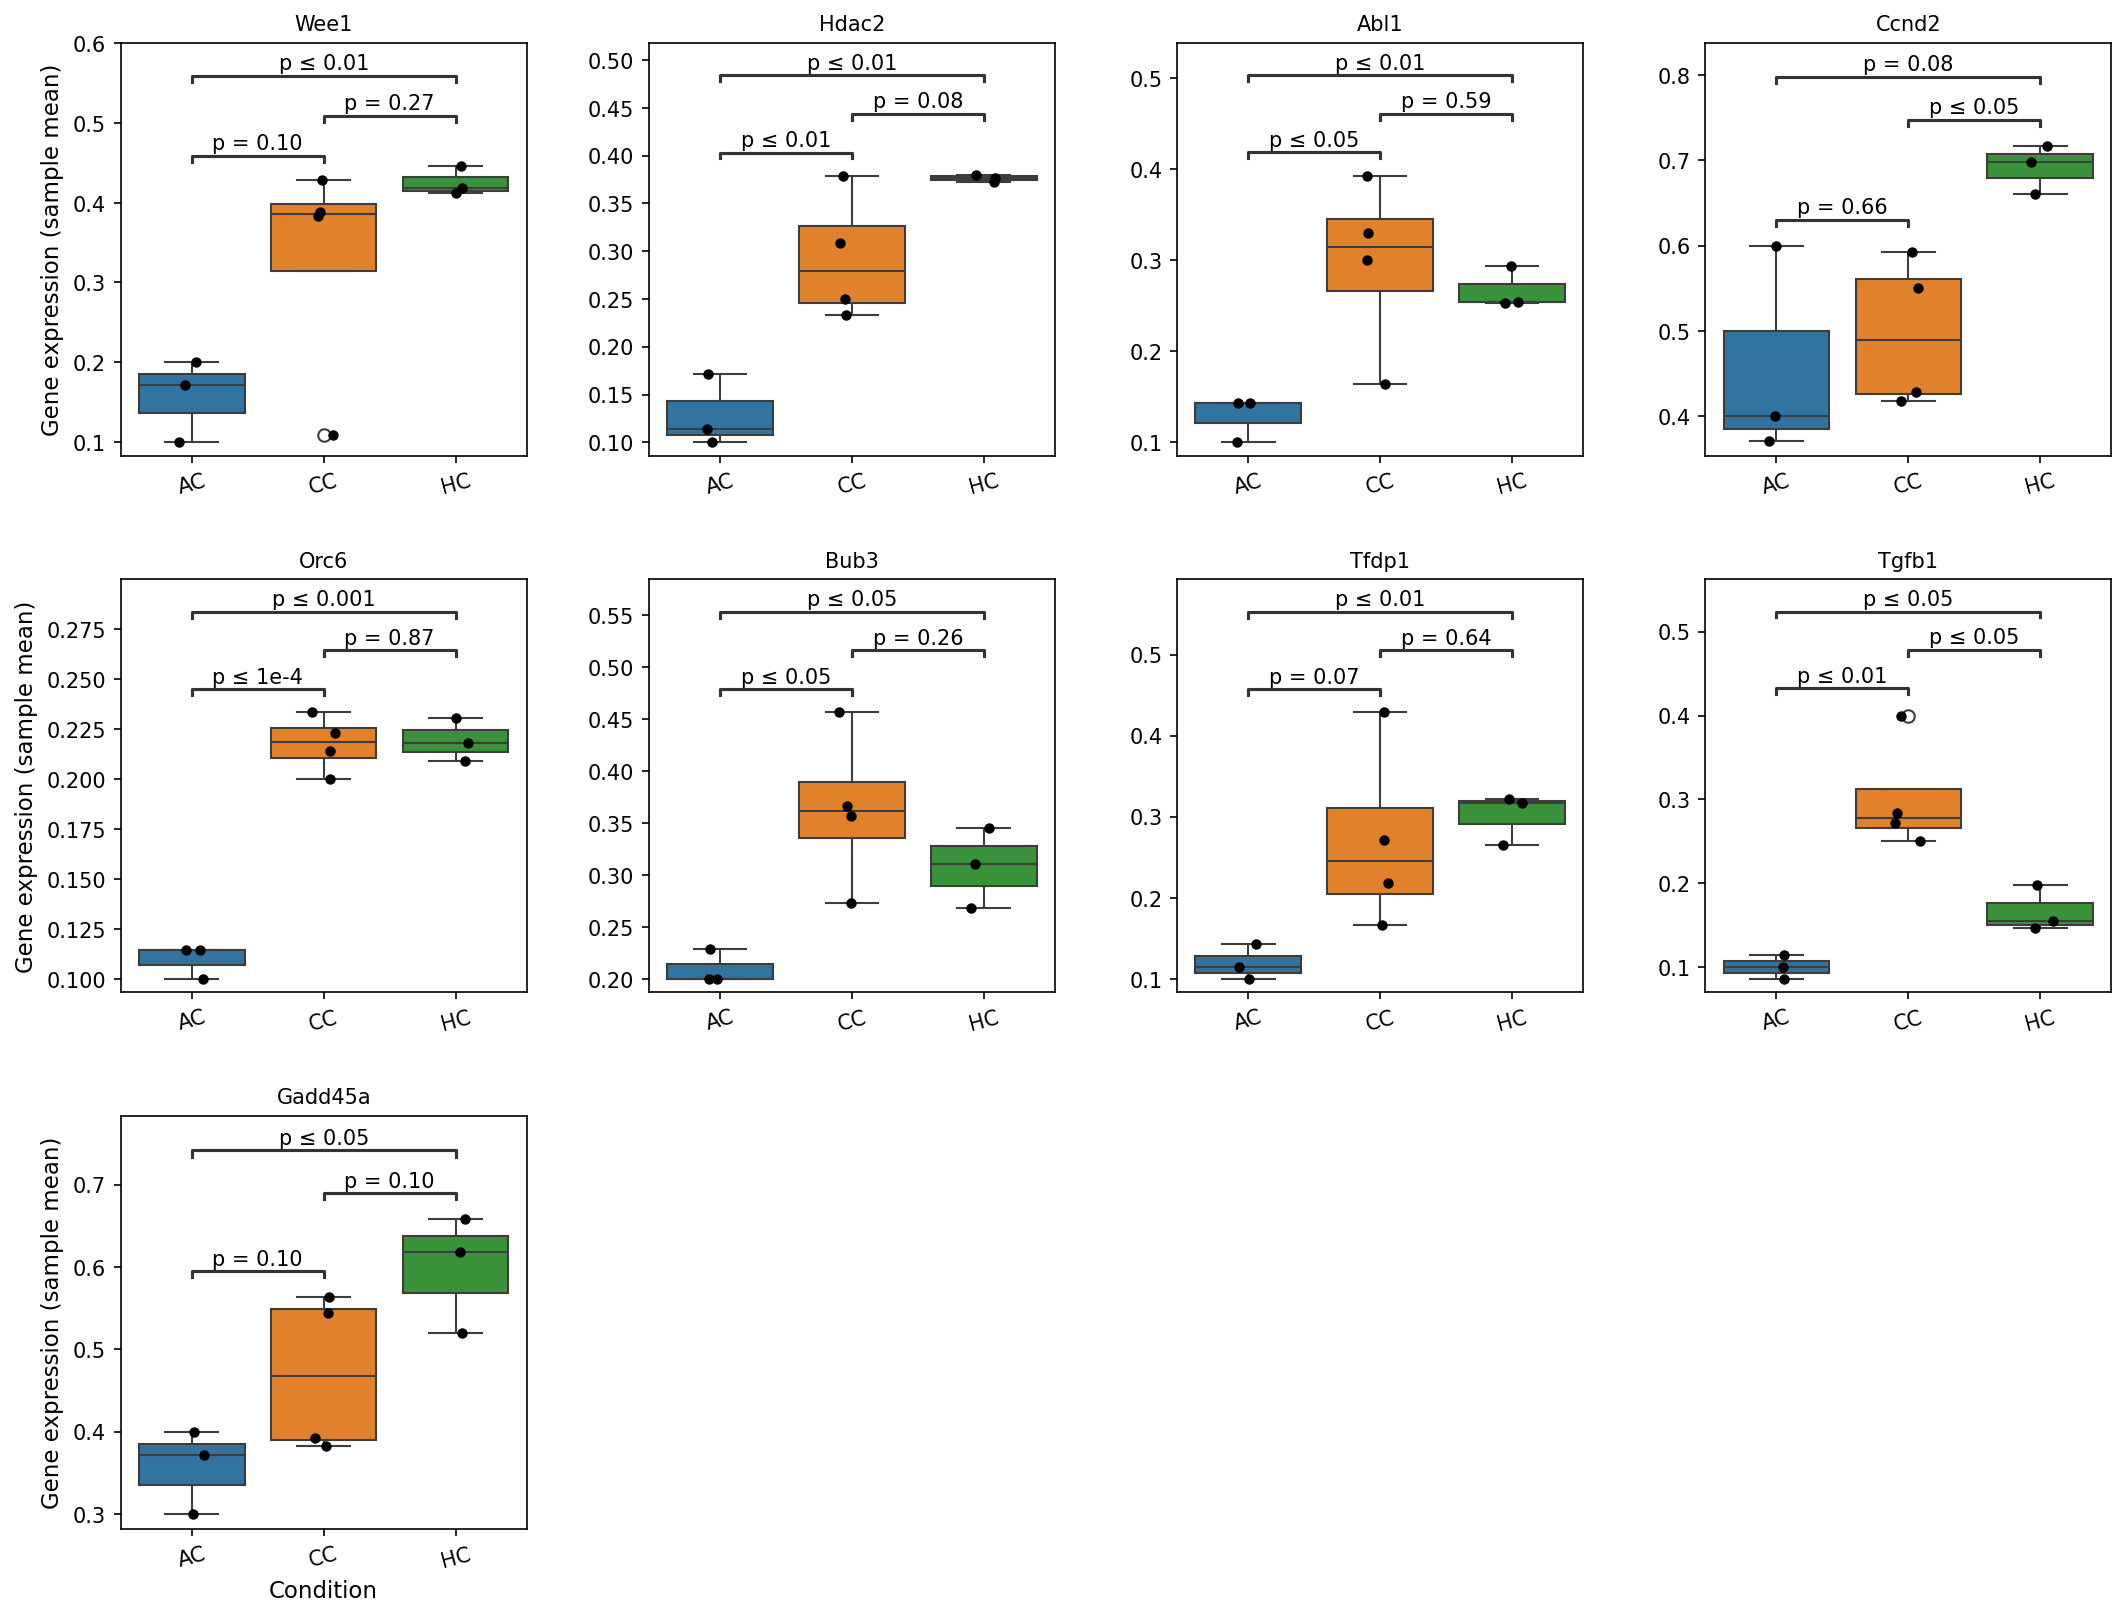
[Analysis Visualization Results]...
Analysis Overview
This analysis investigates the differential expression of a curated list of cell cycle-related genes within Intestinal Epithelial cells across three distinct colonic conditions: AC, CC, and HC (Healthy Control). Box plots illustrate the distribution of gene expression levels (sample mean) for each condition, with statistical significance (p-values) indicated for pairwise comparisons. This allows for an assessment of how cell cycle regulation in these crucial epithelial cells might vary in different physiological or pathological states of the colon.
Visual Summary
The visualization displays box plots for nine specific cell cycle-related genes: Wee1, Hdac2, Abl1, Ccnd2, Orc6, Bub3, Tfdp1, Tgfb1, and Gadd45a. These genes were selected from a broader cell cycle pathway list based on statistically significant differences in expression (p-value cutoff of 0.1) between conditions for Intestinal Epithelial cells.
Key observations include:
- General Trend (AC vs. HC): For the majority of plotted genes (Wee1, Hdac2, Abl1, Orc6, Tfdp1, Gadd45a), expression in Intestinal Epithelial cells is significantly lower in the AC condition compared to the HC (Healthy Control) condition (p ≤ 0.01 or p ≤ 0.05). This suggests a generally attenuated proliferative or cell cycle-regulatory activity in AC.
CC Condition as Intermediate/Distinct:
- For Wee1, Hdac2, Abl1, Bub3, Orc6, and Tfdp1, the CC condition shows significantly higher expression compared to AC (p ≤ 0.05 to p ≤ 1e-4), often reaching levels comparable to or slightly lower than HC.
- Ccnd2: Expression is lowest in AC, intermediate in CC, and highest in HC. A significant increase is noted from CC to HC (p ≤ 0.05), suggesting more robust G1-S transition activity in healthy tissue.
- Tgfb1 (Transforming Growth Factor beta 1): This gene exhibits a unique pattern, being significantly upregulated in CC compared to both AC (p ≤ 0.01) and HC (p ≤ 0.05). AC also shows significantly lower expression than HC (p ≤ 0.05). This indicates a specific and pronounced role for TGFb1 in the CC condition.
- Gadd45a (Growth Arrest and DNA Damage-inducible alpha): Expression is lowest in AC, gradually increasing in CC (borderline significance vs AC, p=0.10), and highest in HC (significantly higher than AC, p ≤ 0.05).
- Consistency across samples: The individual sample points (black dots) within each box plot generally show good agreement within their respective conditions, reinforcing the observed differential expression patterns.
Biological Interpretation
The observed differential expression of cell cycle genes in Intestinal Epithelial cells strongly suggests altered proliferative and homeostatic states across the different colonic conditions.
- Reduced Cell Cycle Activity in AC: The overall downregulation of key cell cycle regulators like Wee1, Hdac2, Abl1, Orc6, Bub3, Tfdp1, and Ccnd2 in Intestinal Epithelial cells from the AC condition, relative to HC, points towards a state of reduced epithelial cell proliferation or an altered cell cycle progression. These genes are involved in various stages:
- Orc6 is part of the Origin Recognition Complex, critical for initiating DNA replication [GeneCards].
- Ccnd2 (Cyclin D2) promotes the G1-S phase transition [GeneCards].
- Wee1 is a kinase that inhibits Cdk1, preventing premature entry into mitosis [GeneCards].
- Bub3 is a component of the mitotic spindle assembly checkpoint [GeneCards].
- Hdac2 (Histone Deacetylase 2) is involved in chromatin remodeling, affecting gene expression, including those related to cell proliferation [GeneCards].
- Abl1 is a non-receptor tyrosine kinase involved in cell growth, division, and stress responses [GeneCards].
- Tfdp1 forms a complex with E2F transcription factors to regulate cell cycle-related genes [GeneCards].
Such widespread downregulation could imply a response to stress or inflammation in the AC condition, where epithelial repair might be compromised or redirected.
- Robust Homeostasis in HC: The generally higher expression of these cell cycle regulators in HC (Healthy Control) Intestinal Epithelial cells suggests a robust and well-regulated proliferative capacity, essential for the continuous turnover and repair of the intestinal epithelium. Gadd45a, involved in DNA repair and cell cycle arrest in response to stress [GeneCards], also shows highest expression in HC, indicating active maintenance of genomic integrity.
- Distinct Role of TGFb1 in CC: The significant upregulation of Tgfb1 in the CC condition is particularly notable. TGFb1 is a pleiotropic cytokine with critical roles in cell growth inhibition, differentiation, extracellular matrix production, and immune regulation. High TGFb1 levels in Intestinal Epithelial cells could suggest:
- Anti-proliferative signaling: Potentially contributing to cell cycle arrest or differentiation, counteracting unchecked proliferation.
- Pro-fibrotic responses: TGFb1 is a key mediator of fibrosis in various tissues, including the colon [PubMed Search]. Elevated levels might indicate active tissue remodeling or early fibrotic processes in the CC condition.
- Immunomodulation: TGFb1 also plays a role in regulating immune responses, which could impact epithelial-immune interactions in chronic conditions.
These findings collectively point to distinct cellular strategies adopted by Intestinal Epithelial cells in response to varying physiological or pathological demands across the different colonic conditions.
Clinical or Translational Implications
The differential expression patterns of cell cycle genes in Intestinal Epithelial cells offer valuable insights into potential mechanisms underlying colonic health and disease.
- Disease Pathogenesis: If AC and CC represent different stages or types of colonic pathology (e.g., acute vs. chronic inflammation), the altered cell cycle dynamics could explain variations in epithelial repair, regeneration, and susceptibility to damage. For instance, a reduced proliferative capacity in AC might hinder effective barrier repair.
- Therapeutic Targets: Genes like Hdac2 and Abl1 are targetable in other contexts (e.g., cancer). Understanding their regulation in colonic epithelial cells could open avenues for modulating epithelial proliferation or differentiation to promote healing or manage disease progression.
- Biomarker Potential: The distinct expression signature of Tgfb1 in the CC condition highlights its potential as a biomarker for disease activity or fibrotic risk in chronic colonic conditions. Modulating TGFb1 signaling could be a therapeutic strategy, especially in fibrotic manifestations of chronic intestinal diseases [PubMed Search].
- Epithelial Homeostasis: Maintaining balanced cell cycle progression and DNA integrity is fundamental for intestinal barrier function. Dysregulation, as observed for these genes, could contribute to compromised barrier integrity, inflammation, and disease progression.
15. Intestinal Epithelial Cell Pathway Enrichment (GO-GSA) in Colon under Different Conditions
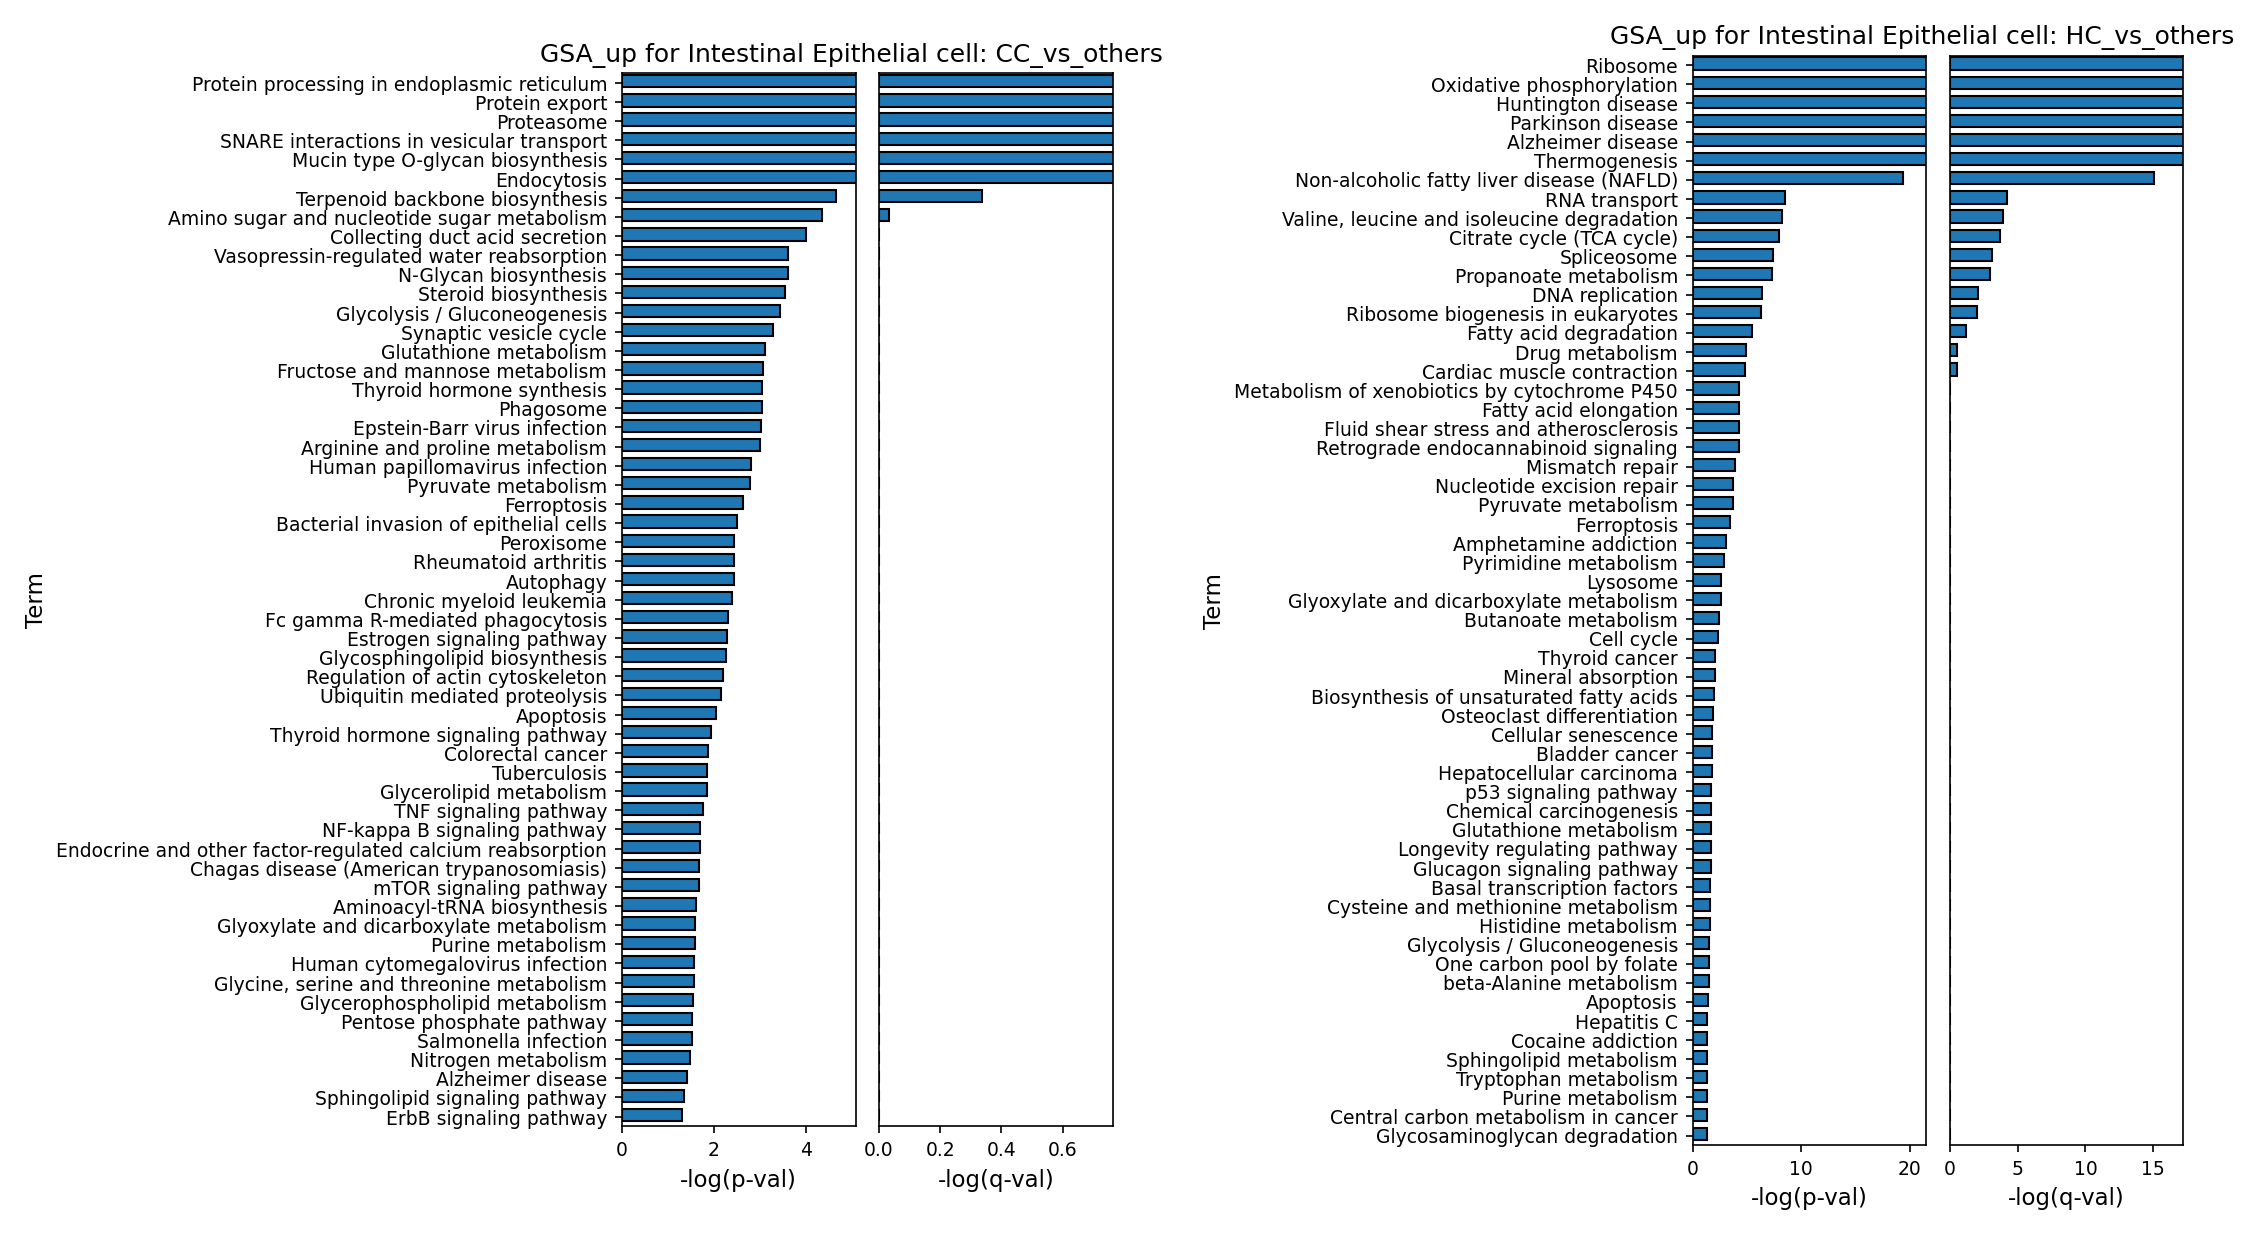
[Analysis Visualization Results]...
Analysis Overview
This analysis leverages Gene Ontology (GO) enrichment through Gene Set Analysis (GSA) to identify biological pathways that are significantly upregulated in Intestinal Epithelial cells (IECs) within mouse colon tissue. The investigation compares IECs from two distinct conditions:
- CC_vs_others: This compares Intestinal Epithelial cells from the 'CC' condition against all other conditions (AC, HC). Given the data context (Colon tissue, conditions AC, CC, HC), 'CC' likely represents an inflammatory state such as Crohn's Colitis.
- HC_vs_others: This compares Intestinal Epithelial cells from the 'HC' condition (Healthy Control) against all other conditions (AC, CC).
The provided bar plots visualize the top 60 enriched GO terms, ranked by their statistical significance (-log(p-val) and -log(q-val), where q-val is the False Discovery Rate-adjusted p-value). These enriched pathways highlight biological processes or molecular functions that are notably more active or highly expressed in the specified target condition compared to the 'others' group.
Visual Summary
The two bar plots distinctly illustrate the sets of significantly upregulated Gene Ontology (GO) terms for Intestinal Epithelial cells under the 'CC_vs_others' and 'HC_vs_others' conditions.
For 'CC_vs_others' (left plot):
- There is a strong enrichment for terms associated with protein processing, quality control, and secretion, including "Protein processing in endoplasmic reticulum," "Protein export," and "Proteasome."
- Pathways critical for cellular trafficking and vesicular transport, such as "SNARE interactions in vesicular transport" and "Endocytosis," are also highly represented.
- "Mucin type O-glycan biosynthesis," a key process for maintaining the mucosal barrier, shows significant upregulation.
- Metabolic pathways like "Glycolysis/Gluconeogenesis" and "Amino sugar and nucleotide sugar metabolism" suggest altered energy and nutrient handling.
- "Ferroptosis," a form of regulated cell death, is also notably enriched. Additionally, terms related to general immune/inflammatory responses such as "Bacterial invasion of epithelial cells" and "Rheumatoid arthritis" are observed.
For 'HC_vs_others' (right plot):
- The plot reveals prominent enrichment for fundamental energy metabolism pathways, including "Oxidative phosphorylation" and "Citrate cycle (TCA cycle)," indicating robust ATP production.
- Pathways associated with macromolecule synthesis, processing, and cellular maintenance are also highly significant: "RNA transport," "Spliceosome," "DNA replication," and "Ribosome biogenesis in eukaryotes."
- Several terms related to neurodegenerative diseases ("Huntington disease," "Parkinson disease," "Alzheimer disease") and "Non-alcoholic fatty liver disease (NAFLD)" appear, often reflecting shared underlying metabolic or protein quality control mechanisms.
- Overall, the enriched terms in healthy IECs point towards active basal metabolic functions, cell turnover, and macromolecule synthesis essential for normal tissue homeostasis.
In summary, the 'CC' condition shows pathways indicative of cellular stress responses, altered protein dynamics, barrier modulation, and specific forms of cell death/inflammation. In contrast, the 'HC' condition highlights robust core metabolic, synthetic, and proliferative activities characteristic of healthy tissue.
Biological Interpretation
The observed pathway enrichments in Intestinal Epithelial cells (IECs) provide critical insights into their functional adaptations under inflammatory (CC) versus healthy (HC) conditions in the colon.
In the 'CC' condition (likely inflammatory, e.g., Crohn's Colitis):
- Endoplasmic Reticulum (ER) Stress and Protein Homeostasis: The strong enrichment of "Protein processing in endoplasmic reticulum," "Protein export," and "Proteasome" suggests that IECs in an inflammatory 'CC' state are experiencing significant ER stress or are actively involved in high-volume protein synthesis and secretion. This could be a cellular response to damage, an attempt to produce inflammatory mediators, or an adaptation to altered luminal contents. Persistent ER stress can activate the unfolded protein response (UPR), which, if unresolved, can contribute to chronic inflammation and epithelial cell death [PubMed search: ER stress intestinal inflammation].
- Mucosal Barrier Remodeling: The upregulation of "Mucin type O-glycan biosynthesis" indicates a heightened activity in producing mucins, key components of the protective colonic mucus layer. In inflammation, this could represent an adaptive effort to reinforce a compromised barrier or reflect altered mucin composition and glycosylation patterns in response to inflammatory cues or dysbiosis [PubMed search: mucin biosynthesis IBD].
- Metabolic Reprogramming: "Glycolysis/Gluconeogenesis" and "Amino sugar and nucleotide sugar metabolism" suggest a shift in the metabolic landscape of IECs. Inflammatory conditions often induce metabolic reprogramming, with cells favoring glycolysis (even in the presence of oxygen, known as the Warburg effect) to support rapid energy generation and biosynthesis of macromolecules needed for repair or immune responses [PubMed search: metabolic reprogramming intestinal epithelium inflammation].
- Active Cellular Trafficking: "SNARE interactions in vesicular transport" and "Endocytosis" point to dynamic membrane trafficking, which may be involved in immune cell communication, altered nutrient absorption, or antigen presentation in the inflammatory context.
- Ferroptosis Activation: The enrichment of "Ferroptosis" indicates that this iron-dependent form of regulated cell death is active in IECs during inflammation. Ferroptosis is often driven by oxidative stress and lipid peroxidation, and its activation can lead to significant epithelial damage and contribute to the pathology of inflammatory bowel diseases (IBD) [GeneCards: FERR].
- Immune and Pathogen Interactions: Pathways like "Bacterial invasion of epithelial cells" and "Rheumatoid arthritis" highlight the strong inflammatory environment and potential direct or indirect interactions with the gut microbiota or broader immune system dysregulation.
In the 'HC' condition (Healthy Control):
- Robust Energy Metabolism: The prominent enrichment of "Oxidative phosphorylation" and "Citrate cycle (TCA cycle)" underscores that healthy IECs primarily rely on highly efficient mitochondrial respiration for ATP generation. This is crucial for supporting their high metabolic demands associated with nutrient absorption, secretion, and rapid cellular turnover [PubMed search: intestinal epithelial cell metabolism].
- Active Macromolecule Synthesis and Cellular Turnover: Pathways such as "RNA transport," "Spliceosome," "DNA replication," and "Ribosome biogenesis in eukaryotes" indicate vigorous basal cellular processes of gene expression, RNA splicing, DNA synthesis, and protein production. These are characteristic of the rapidly regenerating intestinal epithelium, which constantly renews itself.
- General Metabolic Maintenance: The appearance of terms related to neurodegenerative diseases (Huntington, Parkinson, Alzheimer) and NAFLD often reflects the importance of fundamental metabolic and protein quality control pathways that are universally critical for cellular health, even if not directly related to primary pathology in the colon.
Overall Contrast: This analysis clearly demonstrates a fundamental shift in IEC biology from a state of robust basal metabolism and macromolecule synthesis in healthy tissue to a condition characterized by significant cellular stress (ER stress), adaptive barrier modification (mucin), metabolic reprogramming (glycolysis), and specific cell death pathways (ferroptosis) in the inflammatory (CC) state.
Clinical or Translational Implications
The distinct pathway enrichments in Intestinal Epithelial cells between healthy and inflammatory conditions hold significant clinical and translational implications for colon diseases, particularly Inflammatory Bowel Disease (IBD), which 'CC' likely represents:
- Targeting ER Stress in IBD: The pronounced ER stress response in 'CC' IECs suggests that pharmacological modulation of the UPR or ER chaperones could serve as a therapeutic strategy to alleviate epithelial dysfunction and inflammation in IBD patients [PubMed search: ER stress therapy IBD].
- Restoring Barrier Function: While the upregulation of mucin biosynthesis in 'CC' might be an adaptive response, its efficacy could be impaired. A deeper understanding of specific changes in mucin types and glycosylation patterns could lead to novel approaches for reinforcing the epithelial barrier in IBD, potentially through targeted dietary interventions, probiotics, or specific drug therapies that support mucin production and integrity [PubMed search: gut barrier integrity IBD].
- Metabolic Reprogramming as a Therapeutic Avenue: The observed metabolic shift towards glycolysis in 'CC' IECs suggests that interventions targeting specific metabolic enzymes or pathways (e.g., glycolytic inhibitors) could alter the inflammatory phenotype of IECs and potentially reduce disease severity. Conversely, strategies aimed at enhancing oxidative phosphorylation might aid in restoring epithelial health and function [PubMed search: IBD metabolic intervention].
- Ferroptosis as a Novel Therapeutic Target: The activation of ferroptosis in 'CC' IECs indicates that this specific cell death pathway contributes to epithelial damage. Inhibitors of ferroptosis could offer a novel therapeutic approach to protect the epithelial lining, mitigate inflammation, and promote healing in patients with active colonic inflammation [PubMed search: ferroptosis IBD treatment].
- Biomarker Discovery: The identified condition-specific pathways and the genes within them could be valuable sources for novel biomarkers. For example, specific gene expression signatures related to ER stress, mucin glycosylation, or ferroptosis, detectable in biopsies or stool samples, might serve as indicators of disease activity, prognosis, or predictors of treatment response.
- Enhanced Understanding of Disease Pathogenesis: This detailed GO analysis moves beyond generic inflammation markers to provide specific cellular mechanisms by which IECs respond to and contribute to colonic inflammation. This mechanistic understanding is crucial for developing more precise and effective therapeutic strategies tailored to the specific cellular perturbations in IBD and other colon inflammatory conditions.
16. Colon Inflammation and Cell-Type-Specific Pathway Dysregulation in Disease States
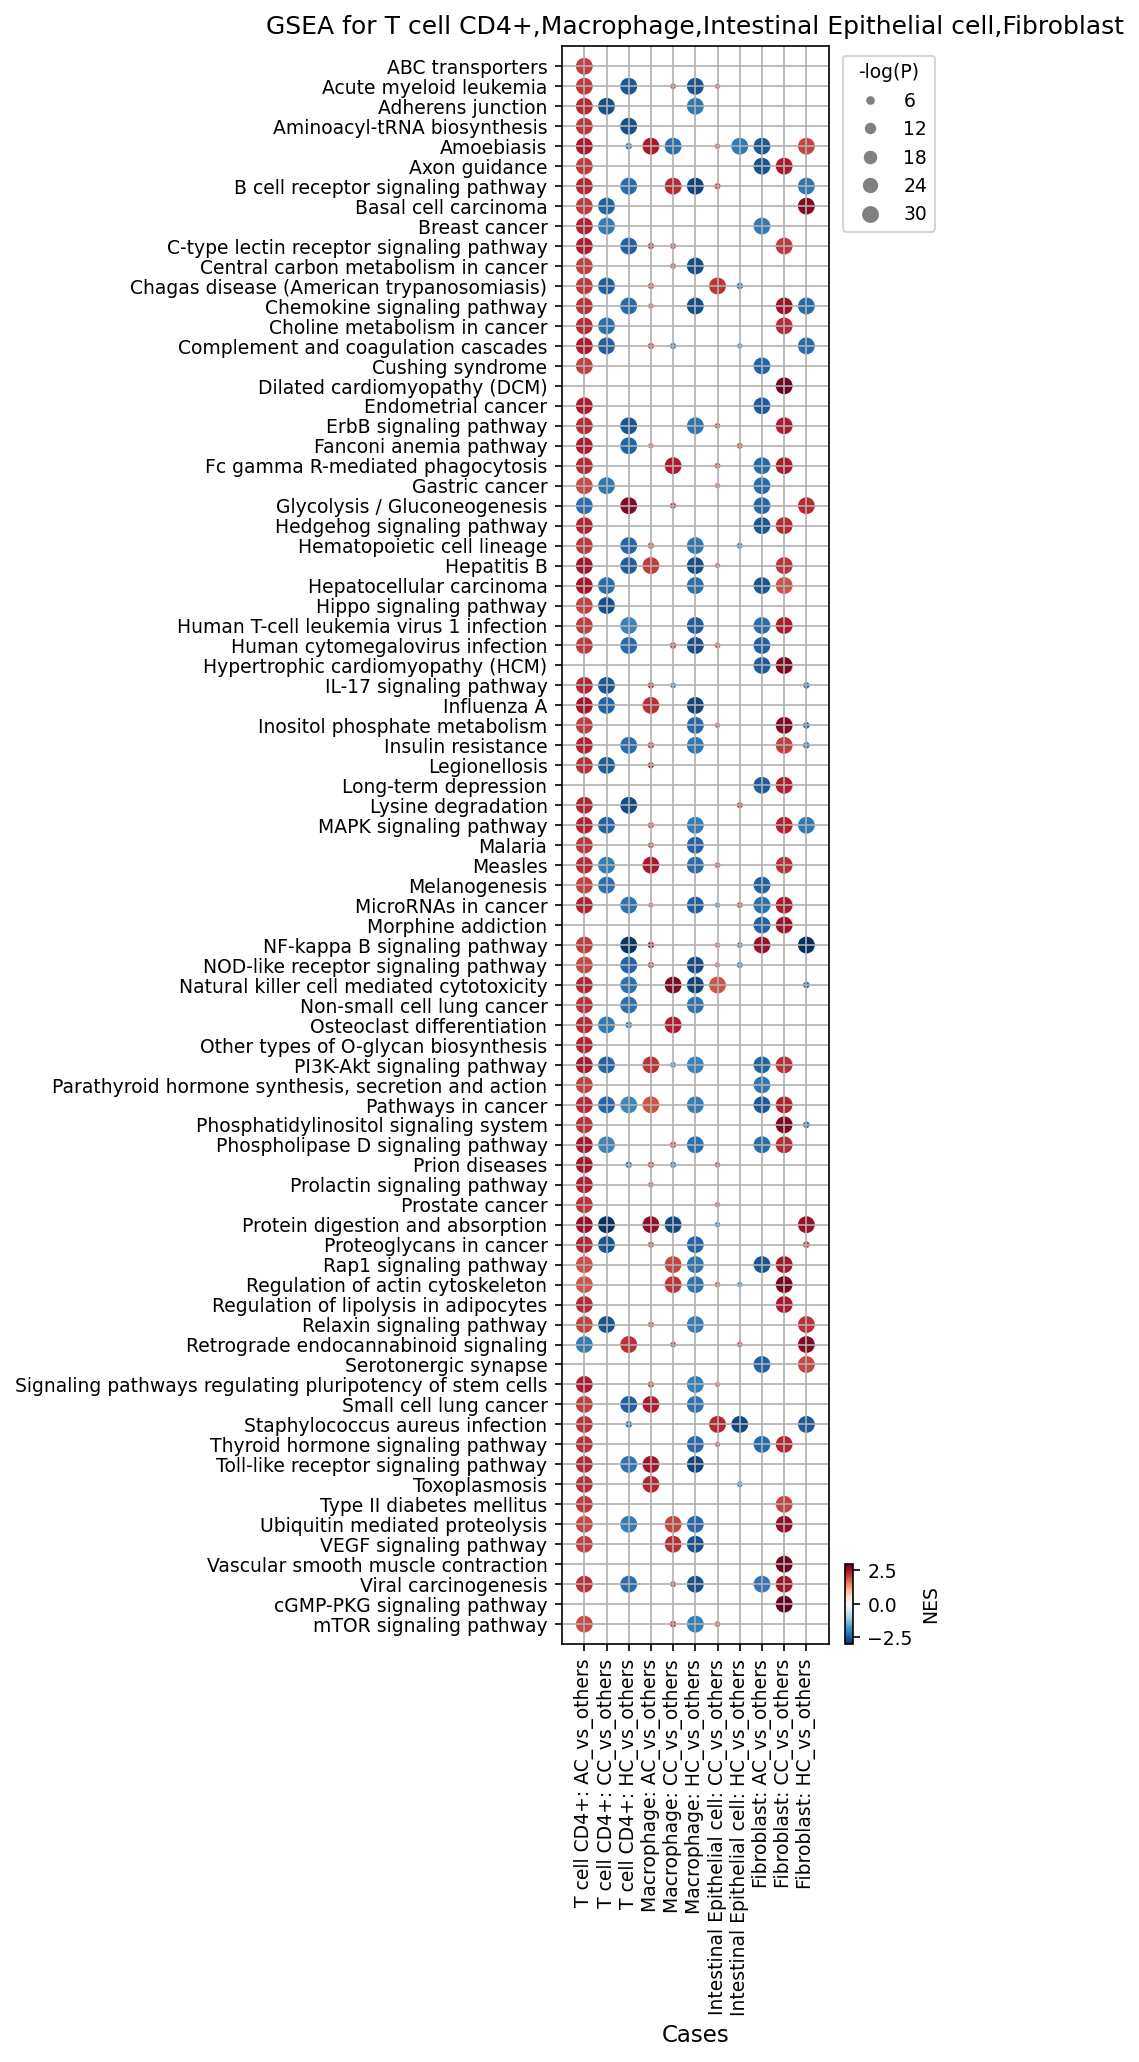
[Analysis Visualization Results]...
Analysis Overview
This analysis presents Gene Set Enrichment Analysis (GSEA) results for T cell CD4+, Macrophage, Intestinal Epithelial cell, and Fibroblast populations isolated from mouse colon tissue. The analysis compares gene expression patterns in three conditions (AC: Acute, CC: Chronic, HC: Healthy Control) against the combined expression of the other two conditions (e.g., AC vs. (CC + HC)). The dot plot visualizes the Normalized Enrichment Score (NES) and statistical significance (-log(p-value)) for 80 selected gene sets, providing insights into condition-specific biological pathway alterations in key cell types of the colon.
Visual Summary
The dot plot displays various biological pathways on the y-axis and different cell type-condition comparisons on the x-axis. The color of each dot indicates the Normalized Enrichment Score (NES), where red signifies upregulation/enrichment of the pathway in the test condition relative to "others," and blue indicates downregulation/depletion. The size of the dot represents the statistical significance, with larger dots corresponding to more significant p-values (-log(p-val)).
Key visual patterns observed:
- Widespread Pathway Activation in AC and CC: Across all four analyzed cell types (T cell CD4+, Macrophage, Intestinal Epithelial cell, Fibroblast), many pathways show strong upregulation (red dots) in both AC_vs_others and CC_vs_others comparisons. This suggests a broad activation of pro-inflammatory, proliferative, and remodeling processes in the acute and chronic disease conditions compared to a baseline that includes healthy controls.
- Quiescent Profile in HC: Conversely, the HC_vs_others comparisons generally show downregulation (blue dots) or absence of significant enrichment for many of the pathways activated in AC and CC. This indicates a relatively quiescent or homeostatic state in healthy conditions, characterized by lower activity in inflammatory and proliferative pathways.
- Cell-Type-Specific Responses: While general trends are shared, specific pathways show differential enrichment across cell types. For example, immune signaling pathways are more prominent in T cells and Macrophages, while pathways related to barrier function are notable in Intestinal Epithelial cells, and remodeling pathways in Fibroblasts.
- High Significance: Many observed enrichments are highly significant, as indicated by the large dot sizes across various pathways and comparisons.
Biological Interpretation
The GSEA results highlight significant cell-type-specific pathway dysregulations in the colon during acute (AC) and chronic (CC) conditions, consistent with inflammatory processes and potential tissue remodeling, contrasting sharply with the healthy (HC) state.
Immune Cell Activation (T cell CD4+, Macrophage):
- Inflammatory Signaling: Both T cell CD4+ and Macrophages in AC and CC conditions show consistent upregulation of critical immune signaling pathways, including Chemokine signaling pathway, Toll-like receptor signaling pathway, NOD-like receptor signaling pathway, and IL-17 signaling pathway. This indicates a robust and sustained inflammatory response characterized by immune cell recruitment, activation by pathogen-associated molecular patterns (PAMPs) or danger-associated molecular patterns (DAMPs), and involvement of Th17-mediated immunity, all hallmarks of intestinal inflammation such as Colitis.
- *Reference on TLRs/NOD-like receptors in IBD:* PubMed search: "Toll-like receptor NOD-like receptor inflammatory bowel disease"
- *Reference on IL-17 in IBD:* PubMed search: "IL-17 inflammatory bowel disease"
- Macrophage Metabolic Reprogramming: Macrophages in AC and CC exhibit upregulation of Glycolysis / Gluconeogenesis, suggesting a metabolic shift towards glycolysis, which is characteristic of M1-like pro-inflammatory macrophages. This metabolic reprogramming supports their effector functions in inflammation.
- Immune Cell Effector Functions: Upregulation of Fc gamma R-mediated phagocytosis in both T cells and Macrophages further points to active immune responses involving cellular clearance and antigen presentation.
Intestinal Epithelial Cell Dysregulation:
- Impaired Barrier and Function: In AC and CC, Intestinal Epithelial cells show downregulation of Protein digestion and absorption, indicating compromised digestive and absorptive functions, a common feature of gut inflammation and epithelial damage.
- Epithelial Stress and Repair/Dysplasia: Concurrently, these cells in AC and CC exhibit upregulation of pathways such as Adherens junction, HIF-1 signaling pathway, MAPK signaling pathway, mTOR signaling pathway, and VEGF signaling pathway. The upregulation of Adherens junction could reflect attempts at barrier repair or altered cell-cell adhesion dynamics under stress. The activation of HIF-1 (often associated with hypoxia in inflamed tissues), MAPK, mTOR, and VEGF pathways suggests increased cell proliferation, survival, angiogenesis, and metabolic adaptations, potentially indicative of epithelial repair, hyperplasia, or early dysplastic changes induced by chronic inflammation.
- *Reference on HIF-1 in IBD:* PubMed search: "HIF-1 inflammatory bowel disease epithelial"
Fibroblast Activation and Remodeling:
- Pro-inflammatory and Pro-fibrotic Phenotype: Fibroblasts in AC and CC conditions show robust activation of pathways like HIF-1 signaling pathway, MAPK signaling pathway, PI3K-Akt signaling pathway, Regulation of actin cytoskeleton, and VEGF signaling pathway. These indicate an activated fibroblast phenotype involved in tissue remodeling, extracellular matrix production, angiogenesis, and cell migration—processes crucial for wound healing but also contributing to fibrosis in chronic inflammation. Upregulation of Toll-like receptor signaling pathway also suggests direct activation of fibroblasts by inflammatory cues.
- *Reference on Fibroblasts in IBD:* PubMed search: "fibroblasts inflammatory bowel disease remodeling"
Pervasive "Pathways in cancer" Enrichment:
- A striking observation is the widespread and significant upregulation of various "Pathways in cancer" (e.g., General Pathways in cancer, Small cell lung cancer, Gastric cancer, Melanogenesis, Viral carcinogenesis) across all four cell types in both AC and CC conditions. Given the context of colon tissue and the established link between chronic inflammation and increased risk of colorectal cancer, this suggests that the disease microenvironment in both acute and chronic phases drives molecular changes that prime cells towards oncogenic transformations. This can include altered cell cycle control, increased proliferation, anti-apoptotic mechanisms, and metabolic shifts.
Healthy State (HC_vs_others) Contrast:
- In stark contrast, the HC_vs_others condition generally shows downregulation or non-enrichment of these pro-inflammatory, proliferative, and cancer-associated pathways. Instead, for Intestinal Epithelial cells, Protein digestion and absorption is upregulated, confirming healthy functional status. This highlights how the healthy colon maintains a quiescent immune state and normal epithelial function, distinct from the perturbed states of AC and CC.
Clinical or Translational Implications
The differential pathway enrichment identified through GSEA offers critical insights into the underlying pathophysiology of acute and chronic colonic conditions, likely inflammatory bowel disease (IBD) or colitis, and their progression.
- Biomarker Discovery: The consistently activated pathways (e.g., Chemokine signaling, IL-17 signaling, HIF-1 signaling, specific "Pathways in cancer") and cell types (Macrophage, Fibroblast) in AC and CC could serve as a source for identifying novel diagnostic or prognostic biomarkers for disease activity and severity.
- Therapeutic Targets: The identified upregulated pathways in disease states, particularly those involved in inflammation (TLR, IL-17 signaling), proliferation (MAPK, mTOR, PI3K-Akt, VEGF), and metabolic reprogramming (Glycolysis), represent potential therapeutic targets. For example, inhibitors of IL-17, MAPK, or PI3K-Akt pathways could be explored for their efficacy in mitigating inflammation and tissue damage in acute and chronic colon diseases.
- Cancer Risk Stratification: The broad enrichment of "Pathways in cancer" across multiple cell types in both AC and CC underscores the neoplastic risk associated with chronic colon inflammation. Monitoring the activity of these pathways could aid in identifying patients at higher risk for colitis-associated colorectal cancer (CAC), potentially guiding more aggressive surveillance or preventive strategies.
- Understanding Disease Progression: Comparing AC vs. CC patterns helps differentiate acute flares from chronic disease progression. While many pathways overlap, subtle differences or magnitudes of enrichment could indicate distinct molecular mechanisms contributing to acute inflammation versus persistent tissue remodeling and fibrosis in chronic stages.
- Epithelial Barrier Repair: The downregulation of "Protein digestion and absorption" coupled with altered "Adherens junction" signaling in epithelial cells highlights the importance of strategies aimed at restoring intestinal barrier function and epithelial integrity in patients with colonic inflammation.
17. Discussion
The single-cell RNA sequencing data from mouse colon effectively distinguishes healthy tissue (HC) from acute (AC) and chronic (CC) inflammatory and potentially neoplastic states. UMAP visualizations show distinct cellular landscapes for AC and CC, indicating significant condition-specific perturbations compared to HC.
Immune cell populations undergo substantial shifts in disease. In the CC condition, there is a pronounced expansion of B cells, T cell CD4+, and T cell CD8+ populations, reflecting a robust adaptive immune response. Further granular analysis reveals significant increases in pro-inflammatory Th17 cells and immunoregulatory T regulatory (Treg) cells in CC, suggesting a complex and potentially imbalanced immune regulation characteristic of chronic inflammation. AC, conversely, is characterized by an elevated proportion of cytotoxic T cells (T_Cyto) and Th22 cells, indicating a more acute effector response and mechanisms for epithelial defense and repair. Both AC and CC show an increase in ILC3 populations, suggesting altered mucosal immune environment and barrier responses.
Macrophages exhibit significant polarization shifts, with a notable increase in pro-inflammatory M1-like macrophages and a decrease in potentially regulatory M2D macrophages in both AC and CC conditions compared to HC. This points to a skewed macrophage phenotype driving inflammation rather than resolution in diseased states. Fibroblasts, critical stromal components, also demonstrate distinct activated phenotypes. HC fibroblasts maintain a quiescent or progenitor-like state (marked by CD34, Ptch1), while AC fibroblasts show early inflammatory/pro-fibrotic markers (Ednra, Itga1, Aoc3). CC fibroblasts are highly activated, expressing markers like Ifngr2, Cspg4, Mcam, and Notch3, indicative of intense tissue remodeling, chronic inflammation, and altered proliferation.
Cell-cell interaction (CCI) networks are dramatically altered in disease. HC samples exhibit sparse and weak CCIs, representing a homeostatic state. In contrast, both AC and CC conditions show abundant, strong, and highly significant CCIs, facilitating immune cell recruitment and tissue remodeling. AC-specific interactions involve adhesion molecules (ICAM1-integrin, SELPLG) and angiogenesis-related pathways (ANGPT1-TEK), suggesting robust leukocyte extravasation and vascular remodeling. CC-specific interactions highlight chemokine signaling (CXCL10-DPP4, CCL5-CCR5), JAG1-NOTCH1, and specific fibroblast-macrophage crosstalk (integrin_aVb3_complex-ADGRE5), orchestrating chronic immune cell recruitment and differentiation.
Intestinal epithelial cells (IECs) also display functional dysregulation. In AC, IECs show a general downregulation of cell cycle regulators, potentially indicating compromised proliferative capacity and repair. In CC, IECs upregulate TGFb1, a key mediator of fibrosis, and show pathway enrichments for endoplasmic reticulum stress, protein processing, metabolic reprogramming towards glycolysis, and ferroptosis. These changes suggest epithelial stress, altered barrier function, and a specific cell death mechanism contributing to chronic inflammation. Gene Set Enrichment Analysis (GSEA) across all major cell types (T cell CD4+, Macrophage, IEC, Fibroblast) in AC and CC consistently highlights widespread activation of inflammatory (Chemokine, Toll-like receptor, NOD-like receptor, IL-17 signaling), proliferative (MAPK, mTOR, PI3K-Akt, VEGF), and tissue remodeling pathways. Notably, the pervasive upregulation of various "Pathways in cancer" across all cell types in both AC and CC conditions underscores a microenvironment that is primed for oncogenic transformation, thereby strengthening the established link between chronic inflammation and colorectal cancer risk in the colon.
Hypotheses:
- Chronic colonic inflammation (CC) drives a pronounced adaptive immune response characterized by B cell hyperplasia and a Th17/Treg imbalance, contributing to persistent tissue damage and impaired resolution.
- Fibroblasts in chronic colonic inflammation (CC) adopt an activated, pro-fibrotic phenotype, as evidenced by upregulation of Notch3, CSPG4, and MCAM, actively contributing to extracellular matrix remodeling and disease progression.
- Intestinal epithelial cells in chronic inflammation (CC) undergo significant metabolic reprogramming towards glycolysis, experience endoplasmic reticulum stress, and are susceptible to ferroptotic cell death, collectively compromising barrier function and driving inflammation.
- The distinct upregulation of specific cell-cell interaction pathways (e.g., ICAM1-integrin in AC, CXCL10-DPP4 and JAG1-NOTCH1 in CC) orchestrates condition-specific immune cell trafficking and stromal-immune crosstalk, critical for shaping the inflammatory microenvironment.
- The shared enrichment of "Pathways in cancer" across immune, epithelial, and stromal cells in both acute and chronic colitis conditions indicates that chronic inflammation primes the colonic microenvironment for oncogenic transformation.
Potential therapeutic targets:
- IL-17 Signaling Pathway: The IL-17 signaling pathway is consistently upregulated in T cell CD4+ and Macrophages in both acute and chronic colitis conditions, and Th17 cells (major producers of IL-17) are significantly increased in chronic colitis, highlighting IL-17 as a key driver of inflammation. Evidence: GSEA shows robust upregulation of 'IL-17 signaling pathway' in T cell CD4+ and Macrophages in AC and CC. Box plots demonstrate a significant increase in Th17 cell proportions in CC compared to AC and HC (p ≤ 0.05). Validation: In vivo blockade of IL-17 or its receptor using neutralizing antibodies in mouse colitis models, followed by assessment of inflammation markers, tissue damage scores, and Th17 cell populations via flow cytometry or immunohistochemistry.
- CD38 (on Macrophages): CD38 is a multifaceted ectoenzyme highly expressed on macrophages in chronic colitis, implying its involvement in chronic immune cell activation and migration, which contributes to persistent inflammation. Evidence: Macrophage condition-specific surfaceome markers show high mean expression and prevalence of 'Cd38' specifically in CC samples, with minimal expression in HC. Validation: Use anti-CD38 antibodies or small molecule CD38 inhibitors in mouse colitis models to assess their impact on macrophage activation states, inflammatory cytokine production, and histological disease severity. Changes in CD38 expression can be monitored by flow cytometry.
- Notch Signaling Pathway (e.g., JAG1-NOTCH1/3): Notch signaling is implicated in various inflammatory and oncogenic processes. Specific interactions like JAG1-NOTCH1 are highly active in chronic colitis, and NOTCH3 is prominently expressed on activated fibroblasts in CC, suggesting its role in cell fate, proliferation, differentiation, and tissue remodeling during chronic disease. Evidence: Cell-cell interaction analysis highlights highly active 'JAG1-NOTCH1' interactions (e.g., between Endothelial and Macrophage/ILC cells) in CC. Fibroblast surfaceome markers show high expression of 'Notch3' in CC fibroblasts. Validation: Inhibit Notch signaling (e.g., using gamma-secretase inhibitors or anti-Notch3 antibodies) in mouse colitis models and assess the impact on fibroblast activation, proliferation, immune cell infiltration, and overall disease pathology using histology and gene expression analysis.
- Ferroptosis Pathway: Ferroptosis, an iron-dependent form of regulated cell death, is significantly enriched in Intestinal Epithelial cells during chronic colitis, indicating its contribution to epithelial damage and inflammation. Evidence: Gene Ontology (GSA) analysis for Intestinal Epithelial cells in the 'CC_vs_others' comparison shows significant enrichment of the 'Ferroptosis' pathway. Validation: Administer known ferroptosis inhibitors (e.g., Ferrostatin-1 or Liproxstatin-1) in mouse colitis models to assess their ability to protect intestinal epithelial cells, improve barrier integrity, and reduce overall disease severity. Epithelial cell death can be quantified via immunostaining.
Follow-up validation ideas:
- Use flow cytometry or mass cytometry to quantitatively validate the observed shifts in immune cell populations (e.g., B cell, T cell subsets, M1/M2D macrophages) and the expression of key surfaceome markers (e.g., TREM2/CD38 on CC macrophages, KIT/TNFSF8 on AC CD4+ T cells) in larger cohorts of mouse models and human patient samples.
- Perform immunohistochemistry, immunofluorescence, or spatial transcriptomics to spatially map and confirm the localization and expression patterns of key fibroblast markers (e.g., IFNGR2, CSPG4, NOTCH3) and epithelial cell markers related to ER stress and ferroptosis, validating their roles within the colon tissue architecture.
- Conduct in vitro perturbation assays using isolated macrophages, T cells, or fibroblasts treated with inflammatory stimuli or specific inhibitors (e.g., anti-Notch3 antibodies, ferroptosis inhibitors) to assess functional changes (e.g., cytokine production, proliferation, migration, ECM remodeling).
- Employ in vivo genetic mouse models (e.g., conditional knockouts for Trem2, Notch3, or components of ferroptosis pathways) or administer specific inhibitors/agonists (e.g., anti-CD38 antibody, ferroptosis inhibitors, anti-IL-17 therapies) in mouse colitis models to assess therapeutic efficacy and functional impact on cell populations and disease progression.
- Utilize organoid models or co-culture systems to study cell-cell interactions (e.g., fibroblast-macrophage, endothelial-T cell) and the impact of specific ligand-receptor pairs or pathway activations on epithelial barrier function, immune cell recruitment, and tissue repair in a controlled environment.
- Analyze independent human IBD/colorectal cancer datasets using bulk or single-cell RNA-seq to confirm the generalizability of observed cell population shifts, pathway enrichments, and marker expressions to human disease.
Limitations:
The findings are derived from a mouse model, and their direct translation to human disease requires careful validation due to potential species-specific immunological and pathological differences. The observed changes are primarily correlative, necessitating further functional studies to establish causality. While comprehensive, single-cell RNA sequencing may not capture all rare cell types or transient cell states. Furthermore, the precise pathological staging and etiology of the 'AC' and 'CC' conditions, though interpreted as acute and chronic colitis/neoplasia, were based on inference from the provided context rather than explicit definition.
18. Query List
- Show UMAPs including condition, sample, major cell type, minor cell type, and celltype_subset in 2 columns and save.
- Show UMAP gene expression for CD3D, CD4, CD8A, CD79A, MS4A1, MZB1, CD14, LYZ, FBLN1, NOTCH3, EPCAM, MUC1, CD34, along with minor cell type annotation. Use ncols=4 and save.
- Show the overall Celltype_subset marker expression dot plot and save it. Keep target_cell as None and keep the other arguments at their default values.
- Show a population bar plot for minor cell types and save.
- Show a subset population bar plot for T cells and save.
- Show a subset population bar plot for Macrophages and save.
- For T cell subset populations, show box plots for statistically significant differences between conditions, if any, and save. Set ncols appropriately based on the total number of panels.
- For Macrophage subset populations, show box plots for statistically significant differences between conditions, if any, and save. Set ncols appropriately based on the total number of panels.
- Show cell-cell interactions by condition and save the result. Select at most 80 cell-cell interactions for each condition.
- For major immune and stromal cells, find statistically significant differences in cell-cell interactions between conditions and show them as a dot plot, and save. Set max_n_items_per_group = 25.
- Extract condition-specific surfaceome markers for Macrophage, up to 50 markers per condition, show as a dot plot, and save.
- Extract condition-specific surfaceome markers for Fibroblast, up to 50 markers per condition, show as a dot plot, and save.
- Extract condition-specific surfaceome markers for T cell CD4+, up to 50 markers per condition, show as a dot plot, and save.
- For genes related to the Cell cycle pathway, show box plots for statistically significant differences in expression between conditions for Intestinal Epithelial cell, and save. Set max_n_items_to_plot = 24, and ncols appropriately so that the aspect ratio is roughly 2x3.
- Show Gene Ontology (GSA) analysis results for epithelial cells as bar plots and save the result.
- Show a dot plot of Gene Set Enrichment Analysis results for T cell CD4+, Macrophage, Intestinal Epithelial cell, and Fibroblast, and save. Use color map RdBu_r and set n_pws_to_show = 80.