Single-Cell Transcriptomic Analysis Reveals Condition-Specific Cellular Landscape and Intercellular Communication in Human Colon Inflammation
This report comprehensively analyzes single-cell RNA sequencing data from human colon tissue, distinguishing between Healthy, Inflamed, and Non-inflamed conditions. We uncover significant shifts in immune and stromal cell populations, with notable infiltration of B cells, Plasma cells, T cells, and Macrophages in inflamed states. Distinct cell-cell interaction networks and gene expression profiles characterize each condition, highlighting active immune responses, tissue remodeling, and metabolic adaptations. The 'Non-inflamed' condition often presents an intermediate or distinct molecular signature, suggesting subclinical activity or a state of persistent alteration, providing critical insights into the pathogenesis and potential therapeutic avenues for colonic inflammatory diseases.
Contents
- Dataset overview
- UMAP Embedding of Colon Single-Cell RNA-seq Data by Condition, Sample, and Cell Type Annotation
- UMAP Visualization of Key Marker Gene Expression and Cell Type Annotation in Colon Single-Cell RNA-Seq Data
- Celltype_subset Marker Gene Expression Dot Plot Interpretation
- Colon Minor Cell Type Population Analysis Across Health and Disease Conditions
- T Cell and Innate Lymphoid Cell Subset Composition Across Colon Tissue Conditions
- Macrophage Subset Population Barplot Analysis
- Macrophage Subset Proportion Differences Across Colon Conditions
- Non-inflamed Colon Cell-Cell Interaction Landscape
- Immune Checkpoint and Cell Cycle Gene-Associated Cell-Cell Interactions in Colon Conditions
- Condition-Specific Cell-Cell Interaction Patterns in Human Colon
- Macrophage Condition-Specific Surfaceome Markers in Colon
- Fibroblast Condition-Specific Surfaceome Markers in Colon
- T cell CD4+ Condition-Specific Surfaceome Markers in Colon
- Differential Expression of Cell Cycle-Related Genes in Colonic B Cells Across Conditions
- Gene Ontology (GSA) Analysis of Intestinal Epithelial Cells in Colon Health and Disease
- Colon Cell Type-Specific Gene Set Enrichment Analysis Across Inflammatory Conditions
- Discussion
- Query List
0. Dataset overview
Dataset Summary
- Type: Single-cell RNA-seq data, processed by SCODA.
- Dimensions: 76,200 cells and 18,017 genes.
Species: Human
Tissue: Colon
- Conditions: Non-inflamed, Inflamed, Healthy (with 'Healthy' as the reference condition for comparative analyses).
- Major Cell Types: B cell, Intestinal Epithelial cell, T cell, Stromal cell, unassigned, Myeloid cell, Endothelial cell, Mast cell.
- Minor Cell Types: Plasma cell, Intestinal Epithelial cell, T cell CD4+, T cell CD8+, Fibroblast, B cell, unassigned, Macrophage, Endothelial cell, Mast cell, Smooth muscle cell, ILC, Dendritic cell, NK cell.
- Subset Cell Types: A detailed list including Plasma cell, Goblet cell, T cell (Naive), Enterocyte, and many others.
Key Precomputed Results:
- Cell-Cell Interaction (CCI): Results available per condition and per sample.
- Differential Expression Genes (DEG): Results for each celltype_minor comparing one condition vs. the rest, and one condition vs. the reference ('Healthy').
- Gene Set Enrichment Analysis (GSEA): Results for each celltype_minor comparing one condition vs. the rest, and one condition vs. the reference ('Healthy').
- Gene Ontology (GSA_up): Results for each celltype_minor comparing one condition vs. the rest, and one condition vs. the reference ('Healthy').
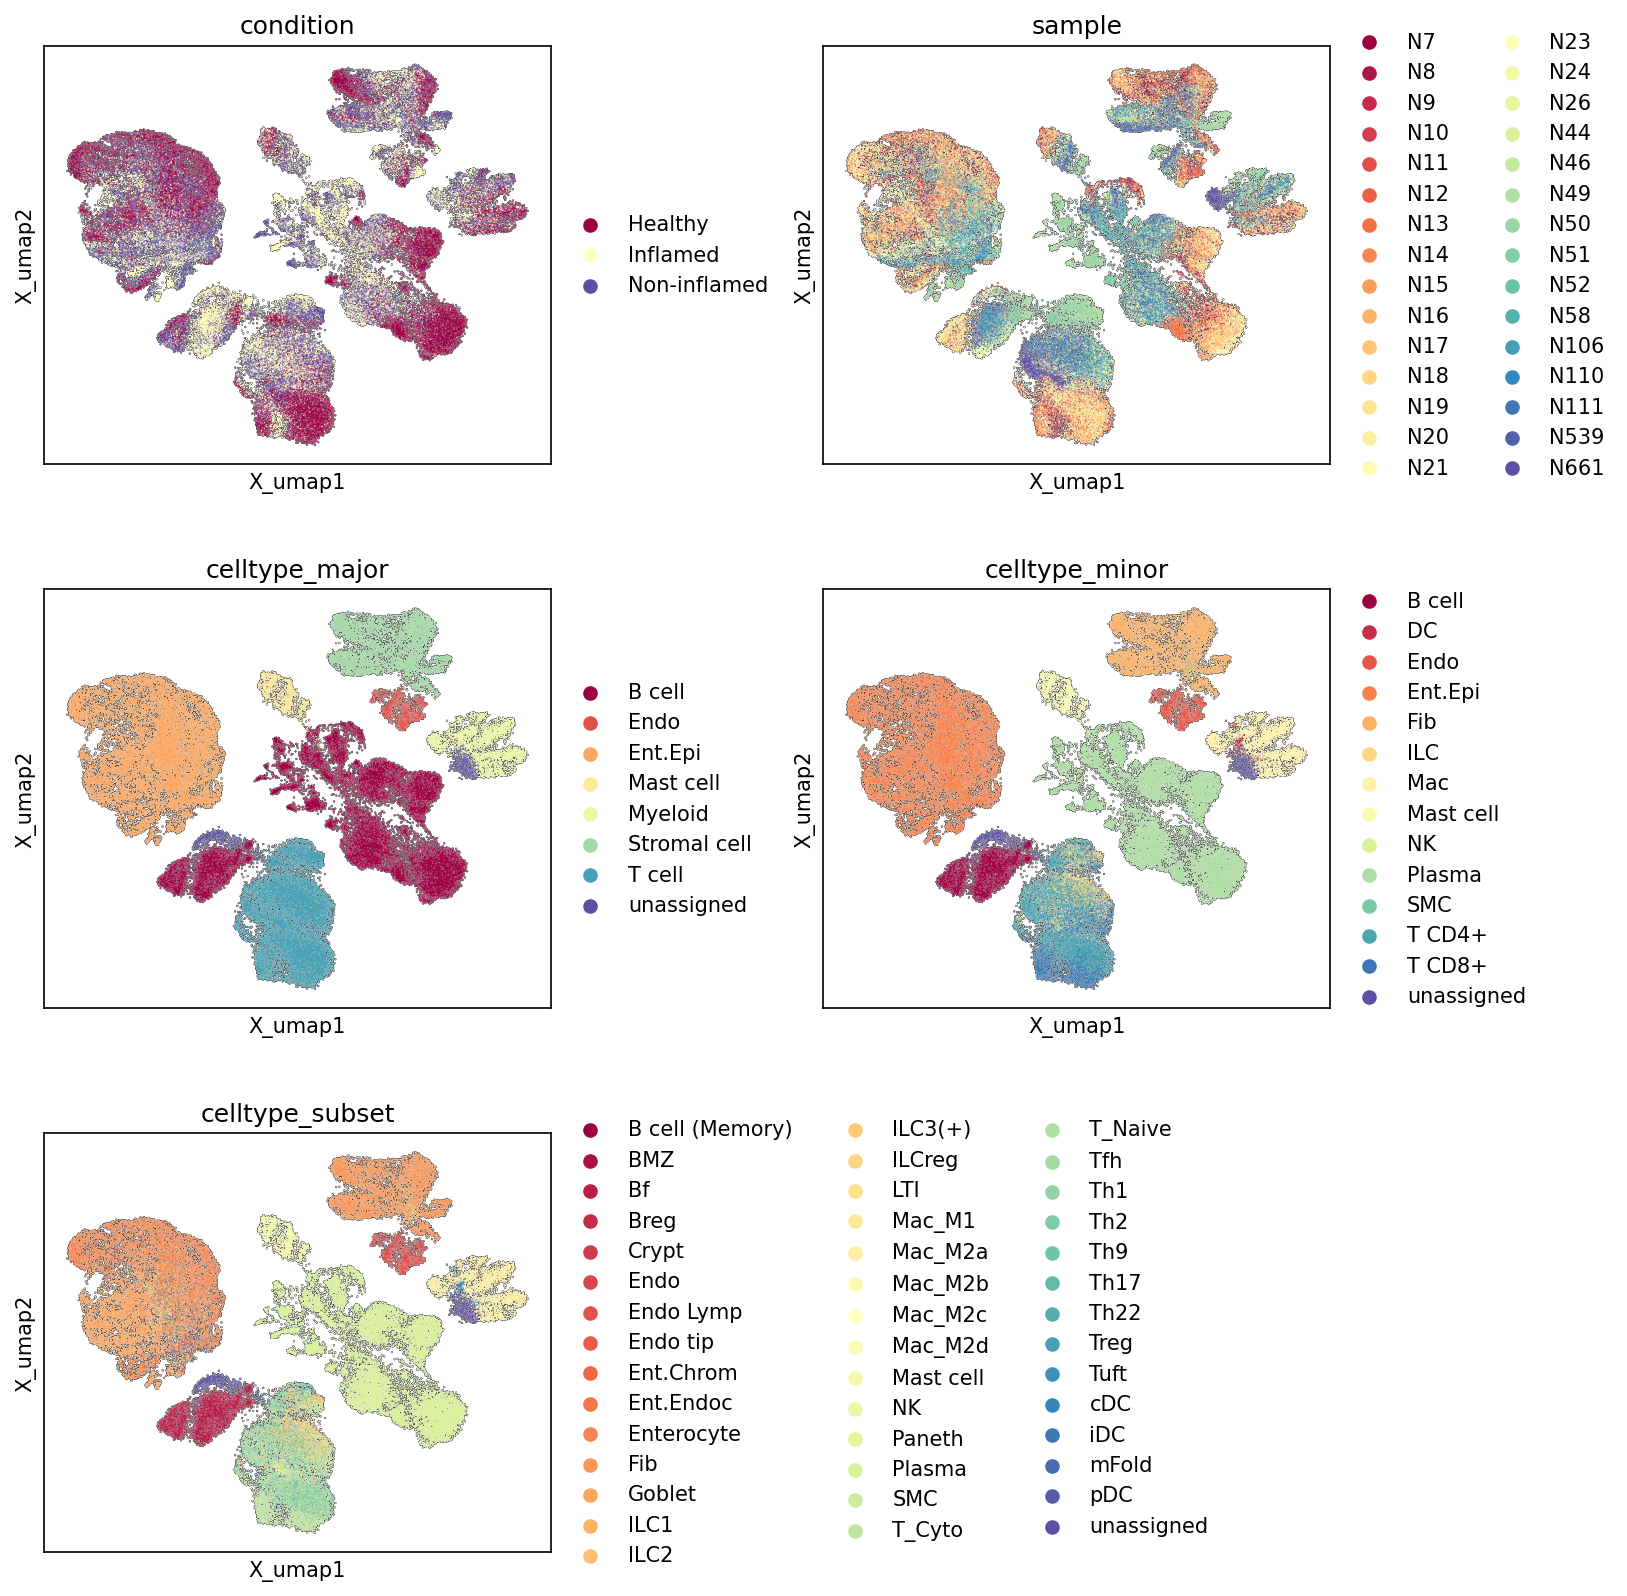
1. UMAP Embedding of Colon Single-Cell RNA-seq Data by Condition, Sample, and Cell Type Annotation
[Analysis Visualization Results]...
Analysis Overview
This analysis visualizes the cellular landscape of human colon tissue from single-cell RNA sequencing data using Uniform Manifold Approximation and Projection (UMAP). Cells are colored according to different metadata attributes: physiological condition (Healthy, Inflamed, Non-inflamed), individual sample, major cell type, minor cell type, and cell type subset. This provides a comprehensive overview of cell population distribution, assessment of data integration, and insights into condition-specific cellular changes and annotation quality.
Visual Summary
Condition
The UMAP colored by condition reveals distinct patterns associated with the physiological state of the colon. Cells from the 'Inflamed' condition (yellow) tend to cluster in specific regions, particularly enriched in the lower-left and central clusters, suggesting condition-specific cellular states or compositional shifts. 'Healthy' cells (dark red) are broadly distributed but also show enrichment in other distinct areas. 'Non-inflamed' cells (purple) appear more interspersed with 'Healthy' cells across various clusters, possibly reflecting a continuum or baseline state that shares characteristics with healthy tissue, or representing non-inflamed regions within patients with inflammation. This differential distribution highlights condition-associated cellular heterogeneity.
Sample
The sample UMAP demonstrates a generally good integration of data across individual samples (N7 to N661). Cells from multiple samples are largely intermixed within most clusters, indicating that batch effects have been effectively mitigated. No single sample predominantly drives a major cluster, which is crucial for robust downstream comparative analyses. While overall integration is good, some minor regions might show slight enrichment of specific samples, particularly in smaller or rare cell populations.
Celltype_major
The celltype_major UMAP shows clear and well-separated clusters corresponding to broad cell identities. For instance, Intestinal Epithelial cells (light orange) form a large, distinct cluster on the left side of the UMAP. T cells (cyan) form another prominent central cluster. B cells (dark red), Myeloid cells (light green), Stromal cells (blue), Endothelial cells (orange-red), and Mast cells (yellow) also form discernible, albeit sometimes smaller, clusters. The minimal presence of 'unassigned' cells (dark purple) and their scattered distribution suggests high confidence and comprehensive coverage in major cell type annotation.
Celltype_minor
Further resolution is observed in the celltype_minor UMAP, where major cell type clusters are refined into more specific populations. Within the T cell major cluster, T cell CD4+ (dark blue) and T cell CD8+ (light blue) subsets are resolved. Plasma cells (pink-red) emerge from the B cell cluster. Macrophages (light green) and Dendritic cells (dark red) become distinct within the Myeloid cluster. Fibroblasts (light orange) are clearly separated from other Stromal cells. Intestinal Epithelial cells largely remain as a cohesive block at this level, indicating its further subdivision into specialized epithelial cell types at the next level of annotation. This level of granularity confirms successful identification of key immune and stromal components in the colon.
Celltype_subset
The celltype_subset UMAP provides the highest level of annotation detail, further dissecting minor cell type clusters into highly specific cell states. Within the Intestinal Epithelial cell cluster, distinct populations like Enterocytes (light orange), Goblet cells (light orange), Paneth cells (light yellow), and Crypt cells (red) are clearly delineated. Various T cell subsets such as T cell (Naive) (light green), T cell (Cytotoxic) (dark blue), T cell (Th1) (light green), T cell (Th17) (cyan), T cell (Th22) (light green), and T cell (Treg) (dark blue) are also resolved, highlighting the diverse adaptive immune landscape. Myeloid cells further resolve into Macrophage (M1, M2A, M2B, M2C, M2D) subsets, showcasing macrophage polarization states. This detailed annotation confirms the ability to differentiate highly specialized cell populations relevant to colon biology and disease.
Biological Interpretation
The UMAP visualizations collectively provide a robust foundational analysis of the single-cell RNA-seq data from human colon.
- Comprehensive Cellular Heterogeneity: The consistent and hierarchical clustering from major to minor to subset cell types demonstrates the extensive cellular heterogeneity within the human colon, capturing both common cell types and rare, specialized populations. This rich dataset allows for deep biological investigations into the distinct functions of these cell populations in colon health and disease.
- Condition-Specific Cellular Dynamics: The clear separation and enrichment of 'Inflamed' cells in particular regions of the UMAP strongly suggest that inflammatory conditions in the colon induce significant shifts in cellular composition or cellular states. This implies specific cell types or activation states are either recruited, expanded, or undergo phenotypic changes during inflammation, which is a key biological insight for understanding inflammatory bowel diseases. PubMed search: "colon inflammation single cell RNA sequencing"
- High-Quality Cell Type Annotation: The formation of distinct and coherent clusters for each cell type at all levels of granularity (major, minor, subset) validates the quality and accuracy of the cell type annotation pipeline. The minimal presence of 'unassigned' cells across the UMAPs further strengthens the confidence in the cell identity assignments. The identification of diverse cell subsets (e.g., various T helper cell types, macrophage polarization states, specialized epithelial cells) confirms the power of this dataset for fine-grained biological discovery. GeneCards: "Enterocyte", UniProt: "IL-17A (Th17 marker)"
- Effective Data Integration: The intermixing of cells from different samples within most clusters indicates successful integration of the dataset, suggesting that observed cellular patterns are biological rather than technical artifacts. This is critical for drawing reliable conclusions from multi-sample single-cell studies.
Clinical or Translational Implications
The UMAP analyses lay crucial groundwork for translational research in colon health and disease:
- Targeted Therapies for Inflammation: The observed condition-specific cellular distributions provide initial insights into cell types or states that are critically involved in colon inflammation. Identifying these specific populations (e.g., particular T cell subsets or macrophage states) in the 'Inflamed' condition could guide the development of more targeted therapeutic strategies to modulate their activity.
- Biomarker Discovery: The robust identification and distinct clustering of various cell types and their subsets offer a strong platform for discovering novel, cell-type-specific biomarkers for inflammatory conditions. These biomarkers could aid in diagnosing disease, monitoring progression, or predicting response to treatment.
- Understanding Disease Mechanisms: By pinpointing the specific cellular changes associated with inflammation, this dataset can be used to unravel the underlying molecular mechanisms driving chronic colon inflammatory diseases, contributing to a deeper understanding of their pathophysiology.
2. UMAP Visualization of Key Marker Gene Expression and Cell Type Annotation in Colon Single-Cell RNA-Seq Data
[Analysis Visualization Results]...
Analysis Overview
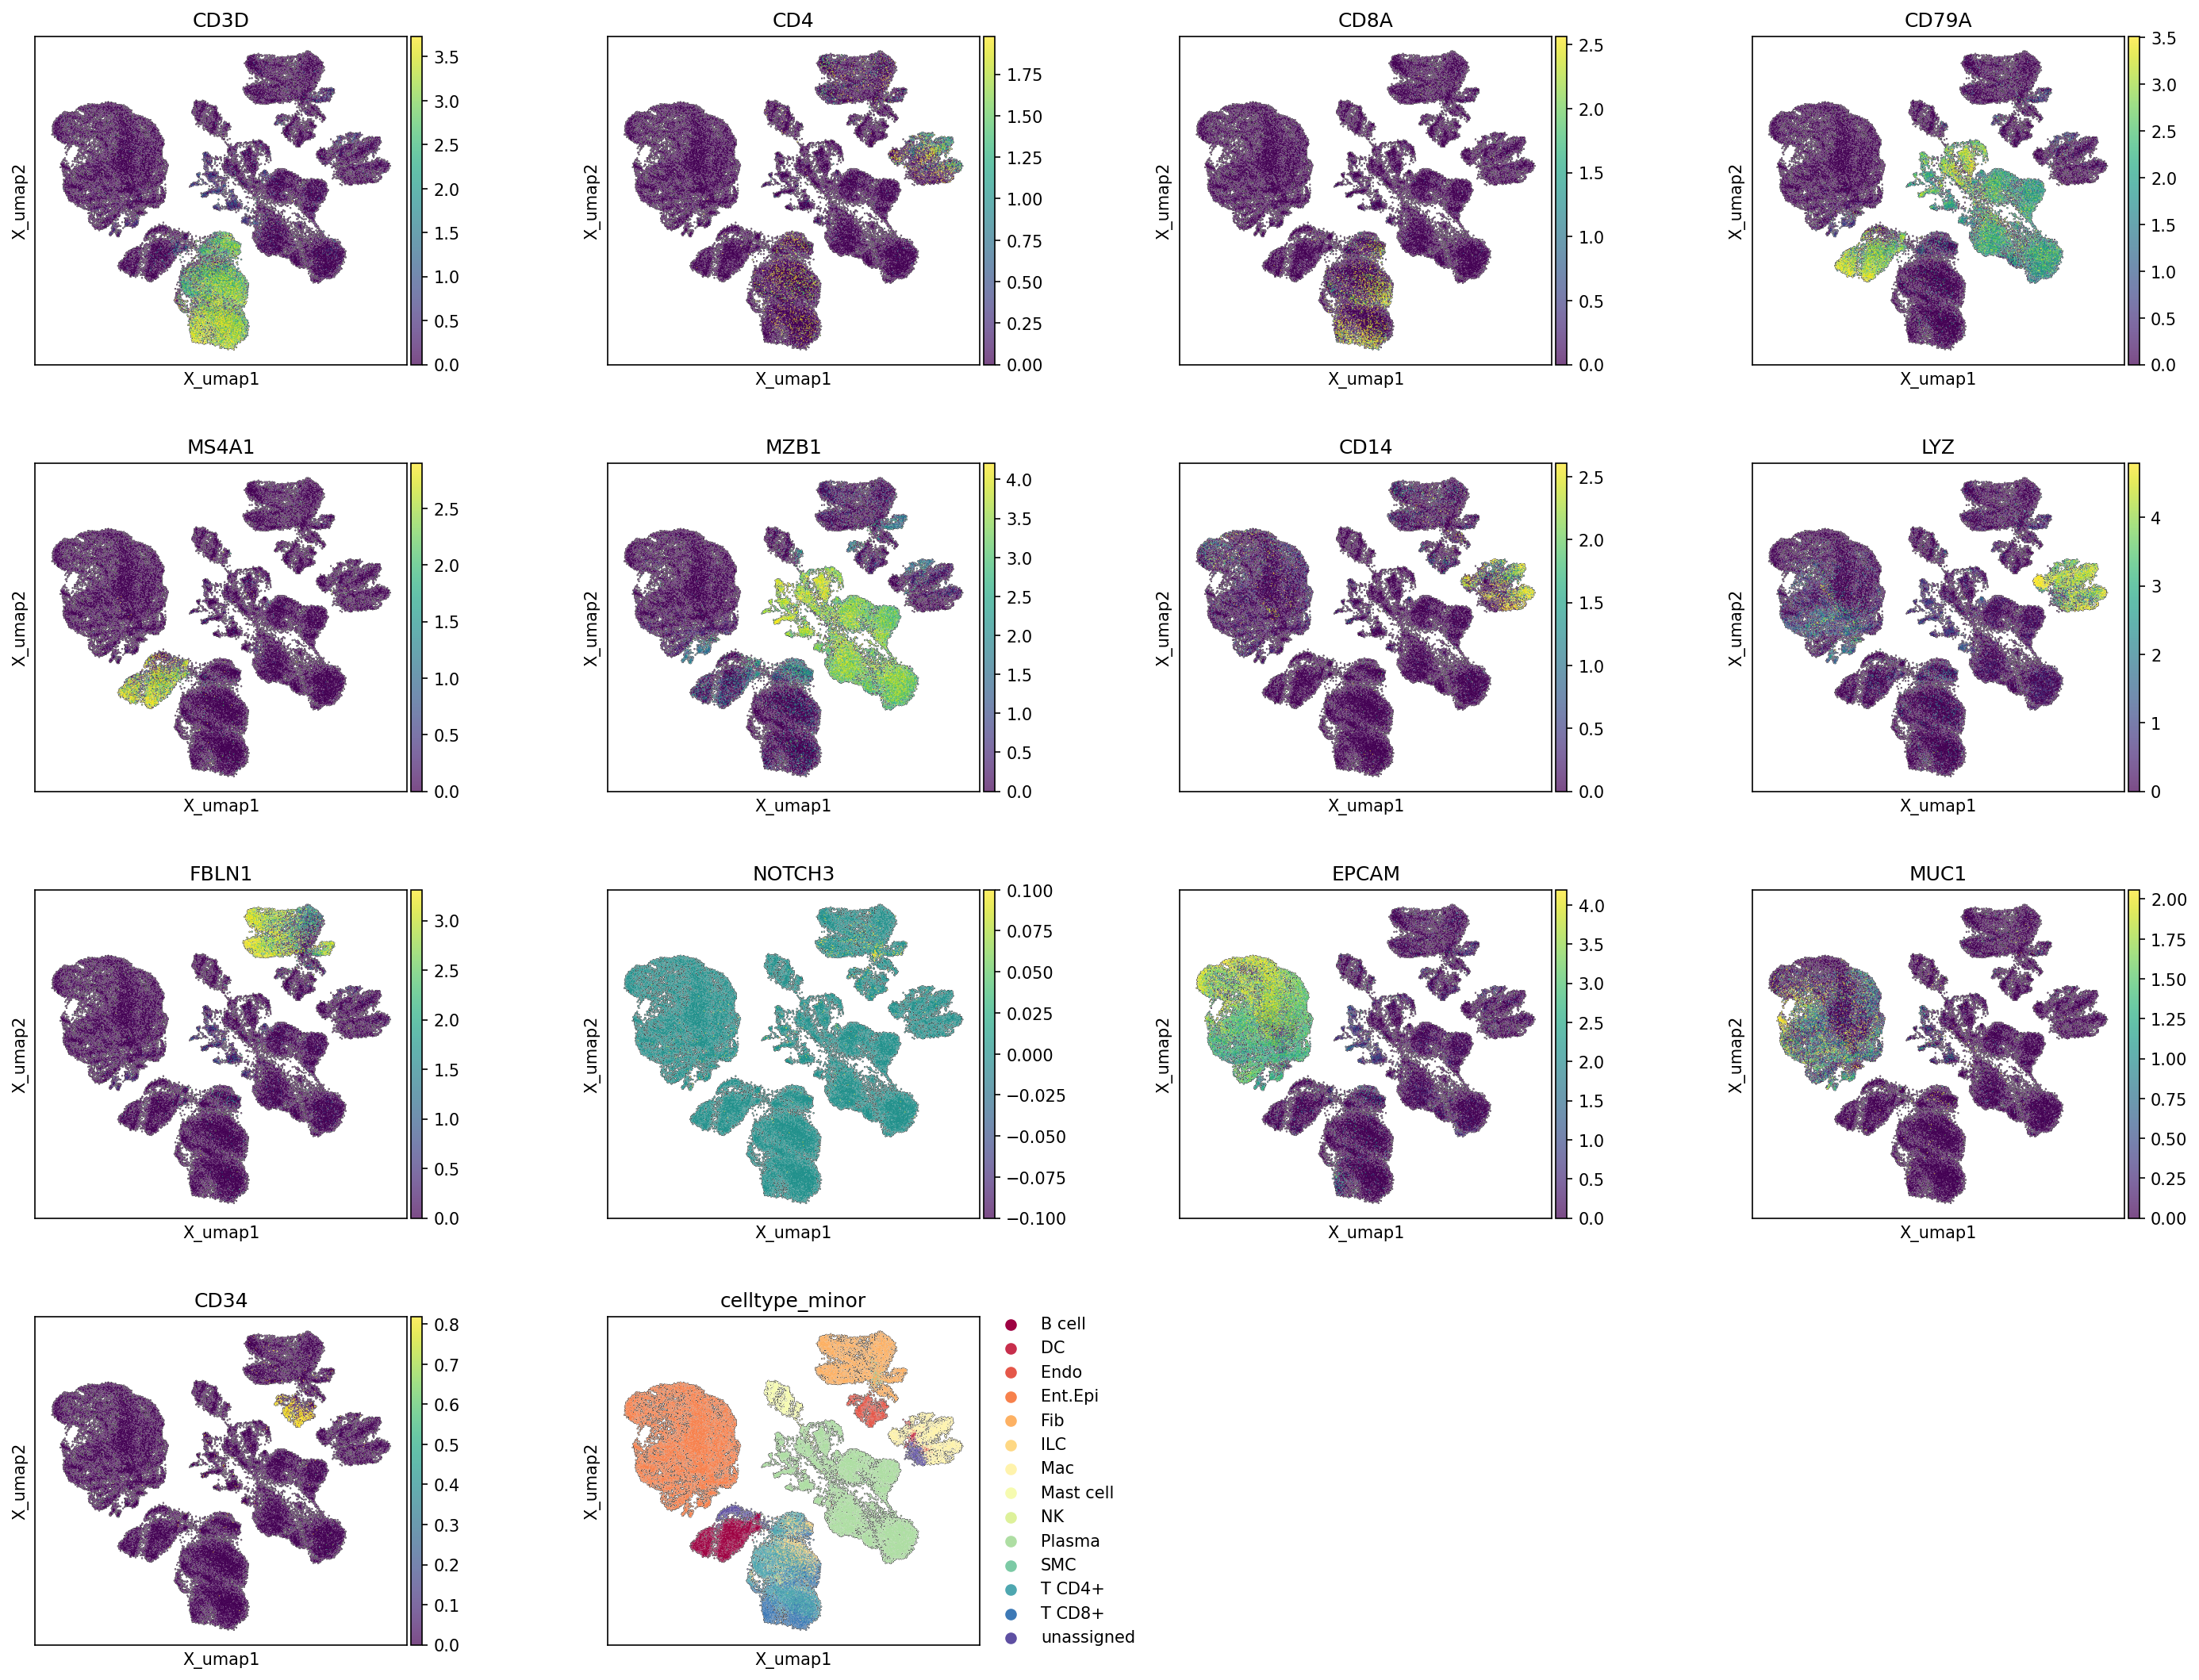
This analysis presents Uniform Manifold Approximation and Projection (UMAP) plots, illustrating the global transcriptional landscape of single cells from human colon tissue. The visualization displays the expression levels of 13 canonical marker genes and the corresponding minor cell type annotations (celltype_minor). The primary objective is to validate the quality and specificity of existing cell type annotations by correlating them with the expression patterns of well-known cell-specific genes.
Visual Summary
The UMAP projection effectively organizes the 76,200 cells into distinct clusters, reflecting their underlying biological identities. The celltype_minor annotation plot (bottom right) serves as the reference for cell identity, showing major populations such as Intestinal Epithelial cells (large upper-left cluster), T cells (bottom central cluster), B cells (lower central-left), Plasma cells (bottom right), Macrophages (central-right), and Fibroblasts (upper-right).
T Cell Lineage Markers:
- CD3D exhibits strong and ubiquitous expression across the entire bottom-central cluster, which encompasses both T CD4+ and T CD8+ populations, confirming its established role as a pan-T cell marker.
- CD4 expression is highly concentrated within a specific subset of the T cell cluster, precisely delineating the T CD4+ cell population.
- CD8A expression is similarly specific to another distinct subset within the T cell cluster, clearly marking the T CD8+ cell population. The distinct localization of CD4 and CD8A within the broader CD3D+ cluster effectively resolves helper and cytotoxic T cell subsets.
B Cell Lineage Markers:
- CD79A and MS4A1 show robust and localized expression in the lower central-left cluster, which is clearly annotated as B cells. Both are well-known markers for B lymphocytes.
- MZB1 demonstrates highly specific expression in the distinct cluster located at the bottom right, which is annotated as Plasma cells. This pattern indicates successful identification of terminally differentiated, antibody-secreting plasma cells.
Myeloid Cell Markers:
- CD14 and LYZ display concentrated expression in the central-right cluster, which aligns perfectly with the Macrophage annotation. These genes are characteristic markers for cells of the monocyte/macrophage lineage.
Stromal Cell Marker:
- FBLN1 shows high expression in the upper-right cluster, corresponding to the Fibroblast annotation, confirming the identity of this stromal cell population.
Endothelial Cell Marker:
- NOTCH3 exhibits detectable, though relatively lower, expression primarily in a smaller cluster adjacent to the epithelial cells, which partially overlaps with regions identified as Endothelial cells in the celltype_minor plot.
Epithelial Cell Markers:
- EPCAM and MUC1 are strongly and broadly expressed in the large upper-left cluster, which is annotated as Intestinal Epithelial cells. EPCAM is a classical pan-epithelial marker, while MUC1 is a mucin protein often associated with secretory epithelial cells, suggesting the presence of diverse epithelial cell types.
Endothelial/Hematopoietic Stem Cell Marker:
- CD34 displays expression in a small cluster near the Fibroblast population and also in the cluster identified as Endothelial cells, consistent with its known role as a marker for both endothelial cells and hematopoietic stem/progenitor cells.
Biological Interpretation
The observed expression patterns of the selected marker genes provide strong validation for the celltype_minor annotations across the UMAP projection. This analysis demonstrates a high degree of concordance between transcriptional profiles and assigned cell identities, which is fundamental for reliable downstream analyses.
- Confirmation of Immune Cell Identities: The precise localization of T cell (CD3D, CD4, CD8A), B cell (CD79A, MS4A1), and Plasma cell (MZB1) markers, along with myeloid markers (CD14, LYZ), within their respective annotated clusters, confirms the robust identification and segregation of major immune cell populations. This accurate immune cell profiling is critical for understanding immune surveillance and inflammatory processes in the colon.
- Validation of Tissue-Specific Components: The clear definition of Intestinal Epithelial cells by EPCAM and MUC1, Fibroblasts by FBLN1, and Endothelial cells by NOTCH3 and CD34, highlights the successful characterization of the principal tissue-resident cell types. These cells are essential for maintaining gut homeostasis and barrier function.
- High Confidence in Annotations: The highly specific and localized expression of these canonical markers within their corresponding annotated clusters substantially increases confidence in the accuracy and quality of the celltype_minor annotations. This foundational validation ensures that subsequent differential expression, pathway enrichment, or cell-cell interaction analyses are performed on reliably identified cell populations.
Annotation Notes
This visualization serves as an excellent internal control for the quality of the cell type annotation. The observed gene expression patterns are highly consistent with established biological functions of these markers, strongly reinforcing the validity of the celltype_minor assignments. The clear partitioning of cells on the UMAP by both cell type and marker gene expression indicates a well-integrated and properly annotated dataset, making it suitable for deeper investigations into colon biology and disease. While major cell types are well-defined, further detailed analysis with additional markers might be beneficial for refining annotations of smaller or less distinctly marked populations, if such granularity is required for specific research questions.
3. Celltype_subset Marker Gene Expression Dot Plot Interpretation
[Analysis Visualization Results]...
Analysis Overview
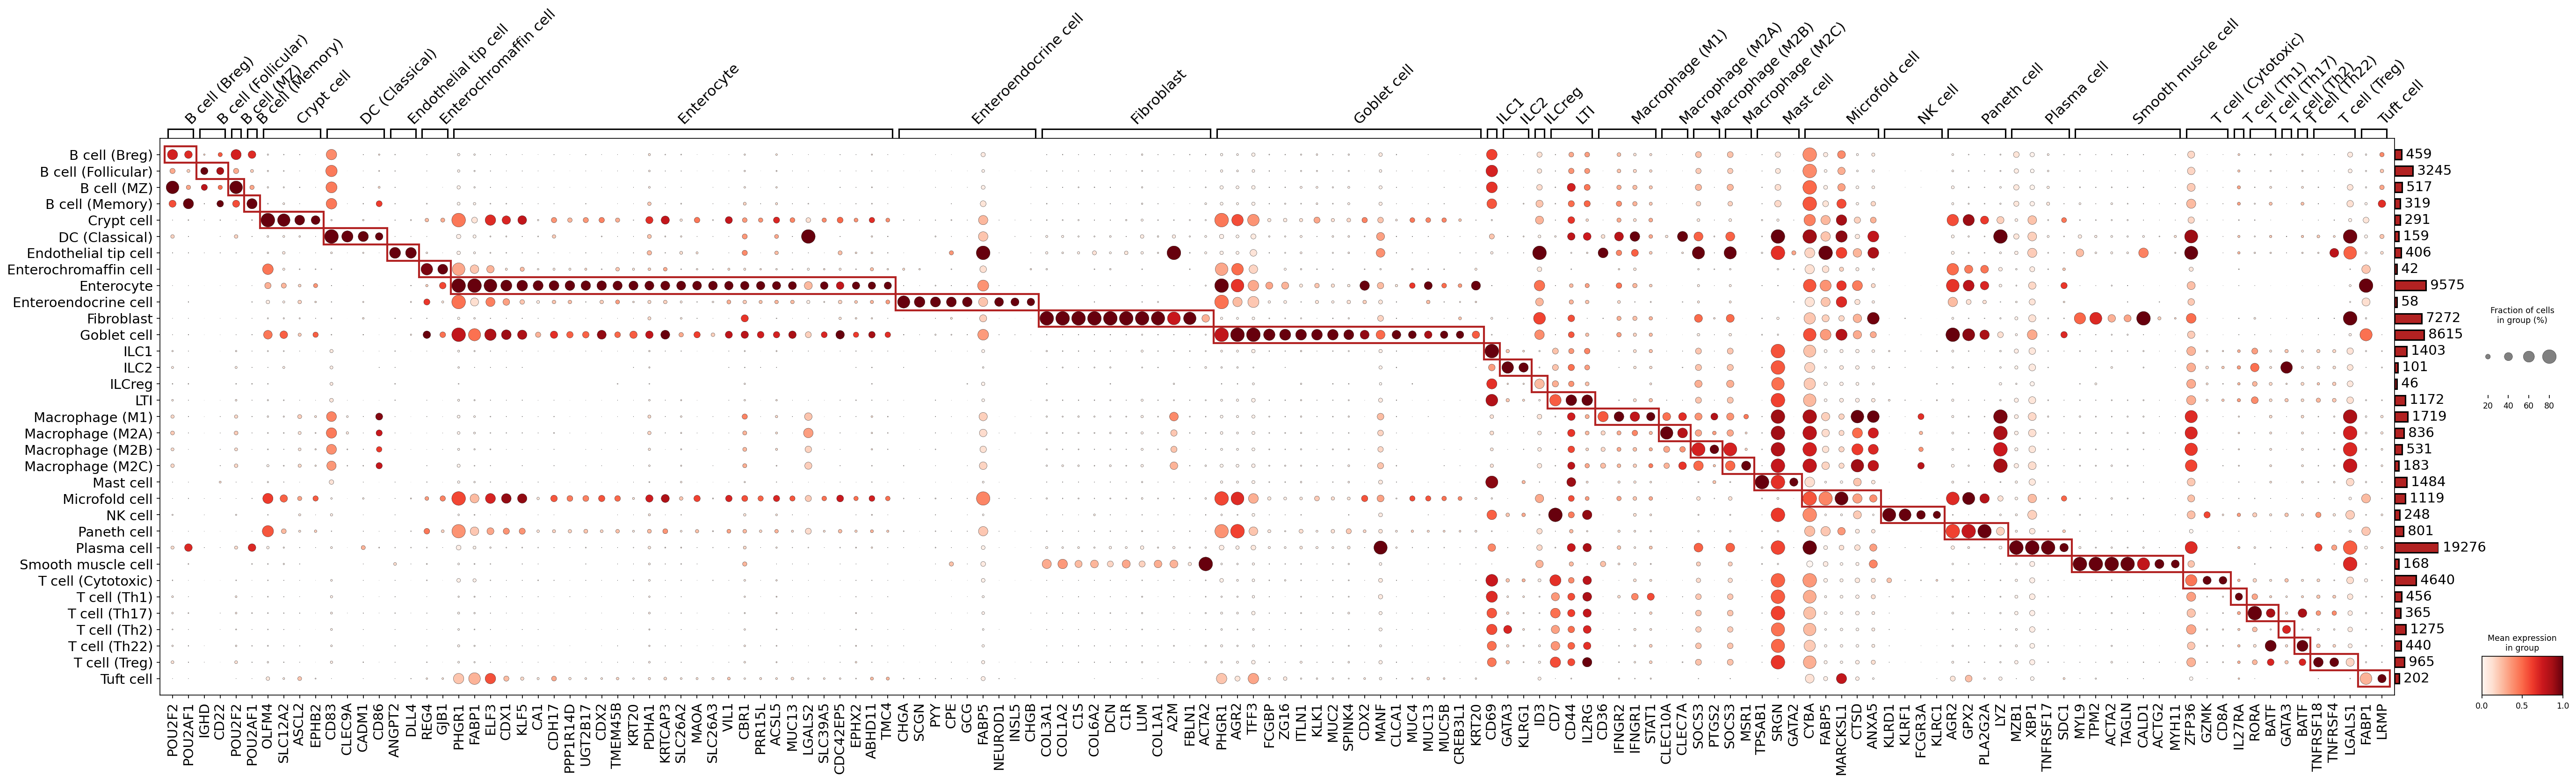
This dot plot visualizes the expression of key marker genes across various celltype_subset populations identified in the single-cell RNA-seq data from the human colon tissue. The analysis aimed to identify surface-specific marker genes (30 per group, up to 140 total) that are highly expressed (mean expression, red color intensity) and prevalent (fraction of cells, dot size) within each cell type group. This provides an overall view of cell type identity and annotation quality based on marker gene specificity.
Visual Summary
The dot plot displays celltype_subset populations along the y-axis and their corresponding marker genes along the x-axis.
- Diagonal Pattern: A prominent diagonal pattern is observed, characterized by large, dark red dots. This indicates that most celltype_subset groups express a distinct set of marker genes at high levels and in a large fraction of cells, strongly supporting their unique identities. Red boxes highlight these specific marker sets for many cell types.
- Dot Size (Fraction of Cells): The size of each dot represents the percentage of cells within a given celltype_subset that express the corresponding gene. Larger dots indicate widespread expression within the cell group. Most diagonal markers show large dots.
- Dot Color Intensity (Mean Expression): The intensity of the red color indicates the mean expression level of the gene within the expressing cells of that celltype_subset. Darker red signifies higher average expression.
- Off-Diagonal Expression: While most markers are specific to a single cell type, some genes show expression (smaller dots, lighter red) in multiple cell types, indicating shared lineage features or broader cell functions.
- Absence of Expression: Numerous small, light grey dots or empty spaces indicate genes that are not significantly expressed or not considered markers for those cell types.
Biological Interpretation
The marker gene expression patterns largely confirm the distinct identities of many celltype_subset populations in the human colon, consistent with known biology.
Immune Cell Lineages
- B cells (Breg, Follicular, MZ, Memory): Show strong expression of B cell-specific transcription factors and surface markers like POU2F2, IGHD, CD22, and POU2AF1 [GeneCards POU2F2: GeneCards]. These are classic markers across B cell subsets.
- Plasma cell: Clearly distinguished by markers such as MZB1, SDC1 (CD138), and TNFRSF17 (BCMA) [GeneCards SDC1: GeneCards], confirming their terminally differentiated state.
T cells (Cytotoxic, Th1, Th17, Th2, Th22, Treg)
- T cell (Cytotoxic): Identified by CD8A and GZMK [GeneCards CD8A: GeneCards], consistent with cytotoxic effector function.
- T cell (Th1): Marked by IFNG, a key cytokine for Th1 function.
- T cell (Th17): Characterized by transcription factors RORA and BATF, important for Th17 differentiation [GeneCards RORA: GeneCards].
- T cell (Th2): Shows expression of GATA3, a master regulator of Th2 development [GeneCards GATA3: GeneCards].
- T cell (Treg): Expresses TNFRSF18 (GITR) and TNFRSF4 (OX40), co-stimulatory receptors often found on Tregs [GeneCards TNFRSF18: GeneCards].
- NK cell: Confirmed by markers such as KLRD1, FCGR3A (CD16), KLRC1, and GZMB [GeneCards KLRD1: GeneCards], indicative of their cytotoxic potential.
- ILC1, ILC2: Show markers like KLRG1 (ILC1) and GATA3, RORA (ILC2), supporting their distinct innate lymphoid cell identities.
- Mast cell: Clearly identified by TPSAB1 (Tryptase) and GATA2 [GeneCards TPSAB1: GeneCards], consistent with their role in immune responses.
- Macrophage (M1, M2A, M2B, M2C): Express general macrophage markers such as CD68, MSR1, SRGN, and CYBA. While these confirm macrophage identity, the specific markers shown do not strongly delineate distinct M1/M2 polarization states, suggesting potential phenotypic overlap or the limitations of surface-only markers for these subtypes in this dataset.
- DC (Classical): Identified by markers like CD83, CLEC9A (CDX2), and CADM1 [GeneCards CLEC9A: GeneCards], consistent with their antigen-presenting function.
Epithelial Cell Lineages
- Enterocyte: Displays a robust set of specific markers including FABP1, ELF3, KLF5, CDH17, CDX2, KRT20, and VIL1 [GeneCards FABP1: GeneCards], confirming their role in absorption.
- Goblet cell: Well-defined by mucin-related genes like MUC2, SPINK4, FCGBP, and AGR2 [GeneCards MUC2: GeneCards], reflecting their mucus-secreting function.
- Paneth cell: Identified by LYZ (lysozyme) [GeneCards LYZ: GeneCards], a key antimicrobial peptide.
- Crypt cell: Shows markers such as ASCL2 and EPHB2, consistent with intestinal stem cell characteristics and crypt base location [PubMed Search: "ASCL2 EPHB2 colon crypt stem cells": PubMed Search].
- Enterochromaffin cell & Enteroendocrine cell: Both show classical enteroendocrine markers like CHGA, SCGN, PYY, CPE, GCG, and NEUROD1 [GeneCards CHGA: GeneCards], reflecting their hormone-producing functions.
- Microfold cell: Distinguished by GP2, a known M cell-specific marker [GeneCards GP2: GeneCards].
Stromal and Endothelial Cells
- Fibroblast: Strongly marked by extracellular matrix components and cytoskeletal proteins like DCN, LUM, COL1A1, ACTA2 (alpha-SMA), TPM2, TAGLN, and CALD1 [GeneCards COL1A1: GeneCards], characteristic of fibroblasts and myofibroblasts.
- Smooth muscle cell: Clearly identified by genes such as ACTA2, MYL9, TPM2, TAGLN, CALD1, and ACTG2 [GeneCards MYH11: GeneCards], all indicative of contractile function.
- Endothelial tip cell: Show specific markers ANGPT2 and DLL4 [GeneCards ANGPT2: GeneCards], which are critical for angiogenesis and tip cell function.
Annotation Notes
The dot plot generally provides strong evidence for the robust annotation and distinct identity of many celltype_subset populations within the colon tissue based on their specific marker gene expression. However, a few observations suggest areas for potential refinement or deeper investigation:
- Macrophage Subtypes: The distinction between various macrophage polarization states (M1, M2A, M2B, M2C) based solely on the displayed surface markers appears limited. Many markers are shared, suggesting these subtypes might exist on a continuum or require a broader set of markers (including intracellular) for clear differentiation.
- Enteroendocrine Cell Markers: While classic enteroendocrine markers are present, the "Enteroendocrine cell" subset also shows expression of some stromal-associated genes (e.g., COL3A1, COL1A2). This could imply minor stromal contamination, shared gene expression in specific contexts, or a need for stricter marker filtering.
- Tuft Cell and Th22 Markers: The markers shown for "Tuft cell" (FABP1, LRMP) and "T cell (Th22)" (KLF5) are less specific or not primary defining markers for these cell types. FABP1 is a prominent enterocyte marker, and KLF5 has broader expression. This might indicate that the identified markers are not sufficiently unique, or that the current annotation of these specific subsets might benefit from further validation with more canonical markers or functional assays.
- Endothelial Tip Cell Marker (REG4): The presence of REG4 as a marker for "Endothelial tip cell" is unusual, as REG4 is typically associated with intestinal epithelial cells (e.g., Paneth, enteroendocrine cells). This warrants re-evaluation for potential misclassification or shared expression patterns that need clarification.
Overall, the annotation quality for most major and many minor celltype_subset populations is well-supported by this marker gene analysis. The identified ambiguities highlight specific subsets where further scrutiny of marker specificity or broader marker panels might enhance the precision of cell type assignment.
4. Colon Minor Cell Type Population Analysis Across Health and Disease Conditions
[Analysis Visualization Results]...
Analysis Overview
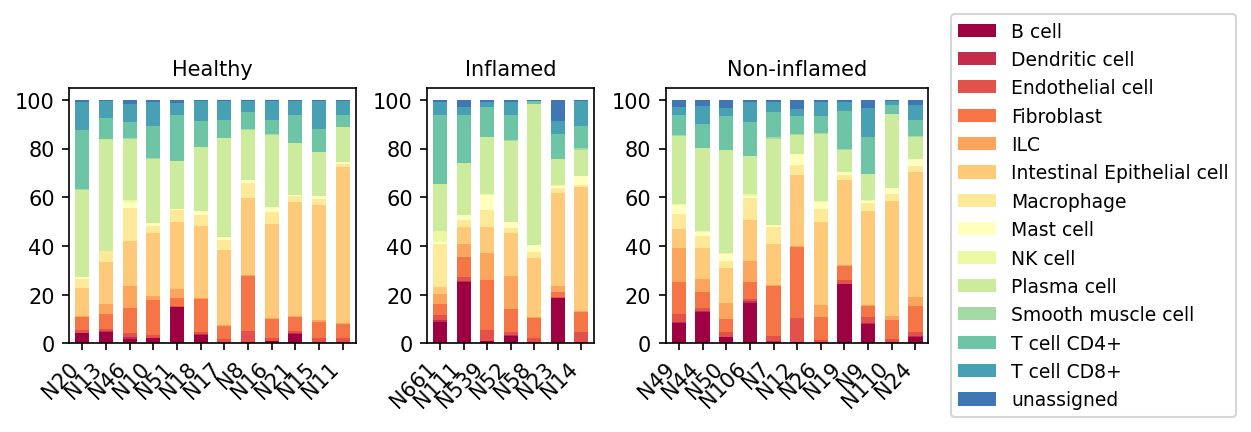
This analysis provides a visual representation of the relative proportions of minor cell types within individual samples, grouped by their disease condition: Healthy, Inflamed, and Non-inflamed. The stacked bar plots allow for an assessment of shifts in cellular composition in the colon tissue under different conditions, offering insights into disease-associated cellular microenvironment changes. Each bar represents a single sample, with cell type proportions adding up to 100%.
Visual Summary
The bar plot effectively illustrates the cellular landscape of the colon tissue at the minor cell type resolution, highlighting differences in cell type proportions across Healthy, Inflamed, and Non-inflamed conditions.
- Dominant Cell Types: In all conditions, Intestinal Epithelial cells (light orange), T cells (CD4+ in light teal, CD8+ in dark teal), and Plasma cells (light green) consistently represent a large fraction of the total cell population.
- Healthy Condition: Samples from the Healthy condition generally show a substantial proportion of Intestinal Epithelial cells. Immune cells like T cells (CD4+, CD8+), Plasma cells, and Macrophages (yellow) are present, reflecting the normal immune surveillance and barrier function of the healthy colon. B cells (dark red) and other immune subsets (Dendritic cells, ILCs, NK cells, Mast cells) are typically found in lower proportions. There is some sample-to-sample variability even within the healthy group.
- Inflamed Condition: A notable shift in cell composition is observed in the Inflamed samples.
- There appears to be a relative decrease in the proportion of Intestinal Epithelial cells. This is often an indirect effect of significant immune cell infiltration, which increases the total immune cell count, thereby reducing the relative percentage of other cell types, or it could reflect epithelial damage.
- Concomitantly, there is a clear increase in the proportion of several immune cell types. This includes B cells (dark red), Plasma cells (light green), and often an expanded proportion of T cells (CD4+, CD8+). Macrophages (yellow) and Dendritic cells (red) also appear to contribute more significantly to the overall cellularity in many inflamed samples.
- Considerable heterogeneity exists among individual samples within the Inflamed group, suggesting varying degrees or types of inflammation. For example, some samples like N661, N539, and N52 show particularly high proportions of B cells and Plasma cells.
- Non-inflamed Condition: The "Non-inflamed" samples, distinct from "Healthy," often exhibit an intermediate cellular profile or one that shares features with the Inflamed condition.
- Many Non-inflamed samples show a reduced relative proportion of Intestinal Epithelial cells compared to Healthy, similar to the Inflamed group.
- They also display an elevated presence of immune cells such as B cells, Plasma cells, and T cells, compared to Healthy controls. This suggests that "Non-inflamed" tissue from individuals with a history of inflammatory conditions or from non-lesional areas in affected patients might still harbor a distinct immune signature compared to truly healthy tissue. For instance, samples like N19 and N9 show prominent B cell populations.
- Similar to the Inflamed group, heterogeneity across samples is present, indicating diverse biological states or patient backgrounds within this category.
- "unassigned" cells: The proportion of "unassigned" cells (dark blue) is generally low across all conditions and samples, indicating good cell type annotation coverage for most cells.
Biological Interpretation
The observed shifts in minor cell type populations provide strong biological insights into the immune responses and tissue remodeling occurring in the colon during inflammation.
- Immune Cell Infiltration and Activation: The marked increase in B cells, Plasma cells, T cells (both CD4+ and CD8+), Macrophages, and Dendritic cells in Inflamed and Non-inflamed conditions compared to Healthy is a hallmark of intestinal inflammation.
- Plasma cells, which are antibody-secreting B cell derivatives, indicate a robust humoral immune response active in the inflamed colon. The presence of B cells and Plasma cells suggests active antigen presentation and germinal center-like reactions within the gut-associated lymphoid tissue, contributing to chronic inflammation [1].
- T cell expansion (CD4+ and CD8+) is central to inflammatory bowel diseases (IBD). CD4+ T helper cells orchestrate immune responses, while CD8+ cytotoxic T cells contribute to tissue damage [2].
- Macrophages and Dendritic cells are crucial antigen-presenting cells that initiate and propagate immune responses. Their increased presence suggests active immune surveillance and inflammation signaling [3].
- Epithelial-Immune Homeostasis Disruption: The relative decrease in Intestinal Epithelial cells in inflamed and even non-inflamed states suggests a disruption of the normal epithelial-immune balance. While this is a relative proportion (due to immune cell expansion), it can also reflect actual epithelial cell damage or altered proliferation dynamics under inflammatory stress, contributing to barrier dysfunction.
- "Non-inflamed" Tissue Insights: The finding that "Non-inflamed" samples resemble "Inflamed" samples more closely than "Healthy" ones, particularly concerning immune cell infiltration, is biologically significant. This supports the concept that macroscopically non-inflamed areas in patients with inflammatory conditions (e.g., IBD) are often microscopically inflamed or retain an inflammatory memory. This "field effect" or "subclinical inflammation" can contribute to disease relapse and provides a window into the chronic nature of these conditions [4].
- Stromal Remodeling: The consistent presence of Fibroblasts and Endothelial cells, with potential subtle changes in their relative proportions, suggests the involvement of stromal and vascular compartments in the inflammatory process, which can lead to tissue remodeling and angiogenesis.
Clinical or Translational Implications
The analysis of cell type populations has several important clinical and translational implications:
- Biomarker Discovery: The distinct cellular signatures, particularly the increased proportions of B cells, Plasma cells, and specific T cell subsets in Inflamed and Non-inflamed conditions, could serve as biomarkers for disease activity, severity, or even for identifying patients at risk of progression or relapse in non-inflamed regions.
- Therapeutic Targeting: An understanding of the specific cell types driving inflammation (e.g., increased B cells/Plasma cells, specific T cell subsets) can guide the development of targeted therapies. For example, therapies aimed at B cell depletion or specific T cell pathways might be more effective in patients with a prominent B cell/Plasma cell or T cell signature, respectively.
- Disease Monitoring: Monitoring changes in these cell populations could be a valuable tool for assessing treatment response or predicting disease course. A reduction in the proportion of inflammatory immune cells and a restoration of epithelial cell balance could indicate successful treatment.
- Understanding Subclinical Disease: The observation that "Non-inflamed" tissue is distinct from "Healthy" highlights the importance of analyzing seemingly unaffected areas in chronic inflammatory diseases. This subclinical inflammation could be a target for preventative strategies or sustained remission therapies.
References
- Plasma cells in IBD: Neurath, M. F. (2014). The intestinal immune system and inflammatory bowel disease. *Cell Research*, 24(5), 517–529. PubMed Search
- T cells in IBD: Sarra, M., et al. (2010). Th17 cells in inflammatory bowel disease: A new therapeutic target. *Digestive Diseases*, 28(3), 478–485. PubMed Search
- Macrophages and Dendritic cells in IBD: Cooney, R., et al. (2009). The intestinal macrophage. *Inflammatory Bowel Diseases*, 15(11), 1715–1720. PubMed Search
- Subclinical inflammation in IBD: Peyrin-Biroulet, L., et al. (2016). Endoscopic remission in ulcerative colitis: from definition to implications. *Gut*, 65(5), 870–880. PubMed Search
5. T Cell and Innate Lymphoid Cell Subset Composition Across Colon Tissue Conditions
[Analysis Visualization Results]...
Analysis Overview
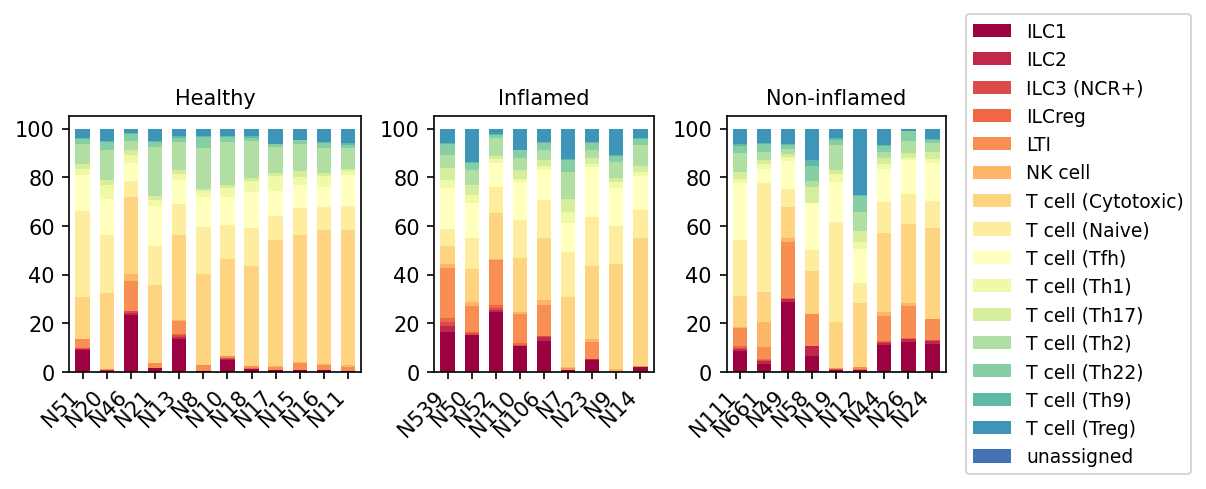
This analysis presents a bar plot illustrating the proportional distribution of T cell and other lymphoid cell subsets within the T cell major cell type category. The populations are displayed for individual samples, grouped by their corresponding health conditions: Healthy, Inflamed, and Non-inflamed colon tissue. This visualization allows for a direct comparison of the immune landscape changes in lymphoid populations across different physiological states.
Visual Summary
The stacked bar plots reveal distinct patterns in the composition of T cell and innate lymphoid cell (ILC) subsets across the Healthy, Inflamed, and Non-inflamed conditions:
- Healthy Condition: Samples in the Healthy group generally show a diverse lymphoid population, with T cell (Naive) and T cell (Cytotoxic) making up a substantial proportion. ILC1, ILC2, and T cell (Treg) are consistently present, contributing smaller but notable fractions. The overall profile appears relatively stable across healthy samples.
- Inflamed Condition: This group demonstrates a marked shift in lymphoid cell composition. There is a prominent and consistent expansion of Innate Lymphoid Cells (ILCs), specifically ILC1, ILC2, ILC3 (NCR+), and ILCreg, which collectively constitute a significantly larger proportion of the total lymphoid compartment compared to Healthy samples. Concomitantly, the relative proportion of T cell (Naive) appears to decrease. While T cell (Cytotoxic) remains substantial, T cell (Treg) seems to represent a relatively smaller fraction in many Inflamed samples. NK cells also show an increased proportion in some inflamed samples.
- Non-inflamed Condition: The lymphoid cell profile in Non-inflamed samples appears more heterogeneous, often exhibiting characteristics that are somewhat intermediate or distinct from both Healthy and Inflamed. While ILCs (ILC1, ILC2, ILC3 (NCR+), ILCreg) are often elevated compared to Healthy, their expansion is not as uniformly pronounced as in the Inflamed group. Notably, some Non-inflamed samples show a relatively higher proportion of T cell (Treg) compared to Inflamed samples, suggesting a potential role for regulatory populations in maintaining a less inflammatory state or in immune resolution.
Biological Interpretation
The observed shifts in lymphoid cell populations provide crucial insights into the immune responses within the colon under different conditions:
- Inflammation-driven ILC Expansion: The most striking feature is the expansion of various ILC subsets (ILC1, ILC2, ILC3 (NCR+), ILCreg) in Inflamed colon tissue. ILCs are key innate immune cells that mirror the functions of T helper cells but lack T cell receptors.
- ILC1s are associated with Th1-type responses, producing IFN-$\gamma$ and contributing to cytotoxic immunity, often seen in chronic inflammation https://pubmed.ncbi.nlm.nih.gov/?term=ILC1+gut+inflammation.
- ILC2s are involved in type 2 immunity, producing IL-5 and IL-13, which can contribute to tissue repair but also allergic inflammation https://pubmed.ncbi.nlm.nih.gov/?term=ILC2+gut+inflammation.
- ILC3s (NCR+) are critical for mucosal immunity and host defense against extracellular bacteria and fungi, often by producing IL-17 and IL-22, and are implicated in the pathogenesis of inflammatory bowel disease (IBD) https://pubmed.ncbi.nlm.nih.gov/?term=ILC3+gut+inflammation.
- The concurrent increase in ILCreg suggests a complex regulatory dynamic even in inflammation, possibly attempting to dampen excessive immune responses.
- T Cell Dynamics in Inflammation: The relative decrease in T cell (Naive) in Inflamed samples likely reflects the differentiation of naive T cells into effector or memory phenotypes in response to inflammatory stimuli. The sustained presence of T cell (Cytotoxic) in inflamed tissue suggests ongoing cell-mediated immunity, potentially targeting stressed host cells or pathogens.
- Regulatory T Cells (Tregs) and Immune Homeostasis: The relatively lower proportion of T cell (Treg) in Inflamed samples, contrasted with their potentially higher presence in Non-inflamed samples, underscores their crucial role in immune regulation. Tregs suppress immune responses and maintain tolerance, and their diminished presence or functionality can contribute to sustained inflammation https://pubmed.ncbi.nlm.nih.gov/?term=regulatory+T+cells+colon+inflammation. In Non-inflamed contexts, a higher Treg proportion might indicate a state of controlled or resolving inflammation.
- NK Cells in Inflammation: The observed increase in NK cells in some inflamed samples highlights their role in innate immunity in the colon, where they can directly kill infected or stressed cells and produce pro-inflammatory cytokines.
Clinical or Translational Implications
These findings have significant clinical implications for understanding and potentially managing inflammatory conditions in the colon:
- Biomarkers of Disease Activity: The specific patterns of ILC and T cell subset expansion, particularly ILC1, ILC3 (NCR+), and T cell (Treg) depletion, could serve as potential biomarkers for assessing the severity or phase of colon inflammation.
- Therapeutic Targets: The significant involvement of ILCs suggests that targeting specific ILC subsets or their associated cytokine pathways could be a viable therapeutic strategy for managing colon inflammation. For instance, modulating ILC1/ILC3 activity might reduce pro-inflammatory signals, while enhancing Treg function could promote immune resolution.
- Disease Heterogeneity: The variability observed in the Non-inflamed group indicates that this condition might represent a spectrum from resolving inflammation to low-grade chronic inflammation, and highlights the need for personalized approaches in patient stratification and treatment.
6. Macrophage Subset Population Barplot Analysis
[Analysis Visualization Results]...
Analysis Overview
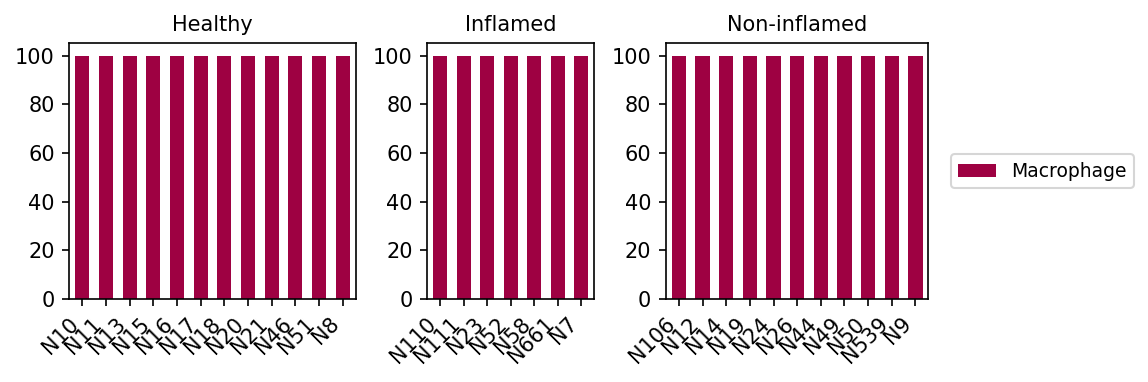
This visualization presents a barplot depicting the population composition within the Macrophage cell type, as defined by the celltype_minor annotation. The plots are organized by condition (Healthy, Inflamed, Non-inflamed) and show individual samples within each condition. The primary purpose of this plot, given the parameters, is to confirm that the cells selected for Macrophage were indeed identified as 100% Macrophages across all samples and conditions.
Visual Summary
The barplot consists of three subplots, one for each condition: Healthy, Inflamed, and Non-inflamed. Within each subplot, multiple bars represent individual samples.
- Y-axis: The y-axis ranges from 0 to 100, representing percentage.
- Bars: All bars in all three subplots consistently extend to 100%. The legend indicates that the color (maroon) represents "Macrophage".
- Labels: The x-axis labels show sample identifiers (e.g., N10, N110, N106), grouped by their respective conditions.
Biological Interpretation
The consistent observation of 100% for all bars under all conditions signifies that the selection process for cells annotated as Macrophage from the celltype_minor category was successful and accurate. When querying specifically for "Macrophage" cells, the output correctly shows that 100% of the cells in the resulting subset are indeed Macrophages.
This plot serves as an important sanity check, confirming the integrity of the celltype_minor annotation for Macrophages and the correct application of the subsetting operation across all samples and experimental conditions (Healthy, Inflamed, Non-inflamed). It indicates that downstream analyses focusing on Macrophages can confidently proceed, knowing that the cellular input has been correctly identified as this specific cell type.
Annotation Notes
This plot primarily functions as a verification of cell type annotation and subsetting. It does not provide information regarding:
- The overall abundance or relative proportion of Macrophages within the entire colon tissue or within each sample.
- Any shifts in the absolute or relative numbers of Macrophages between Healthy, Inflamed, or Non-inflamed conditions.
- Changes in Macrophage cell states or heterogeneity within the Macrophage population itself (e.g., shifts between M1/M2 subtypes or other functional states), as it only confirms the Macrophage identity at the celltype_minor level.
To investigate population changes or condition-associated biology, further analyses such as comparing the overall proportion of Macrophages to other cell types across conditions would be required.
7. Macrophage Subset Proportion Differences Across Colon Conditions
[Analysis Visualization Results]...
Analysis Overview
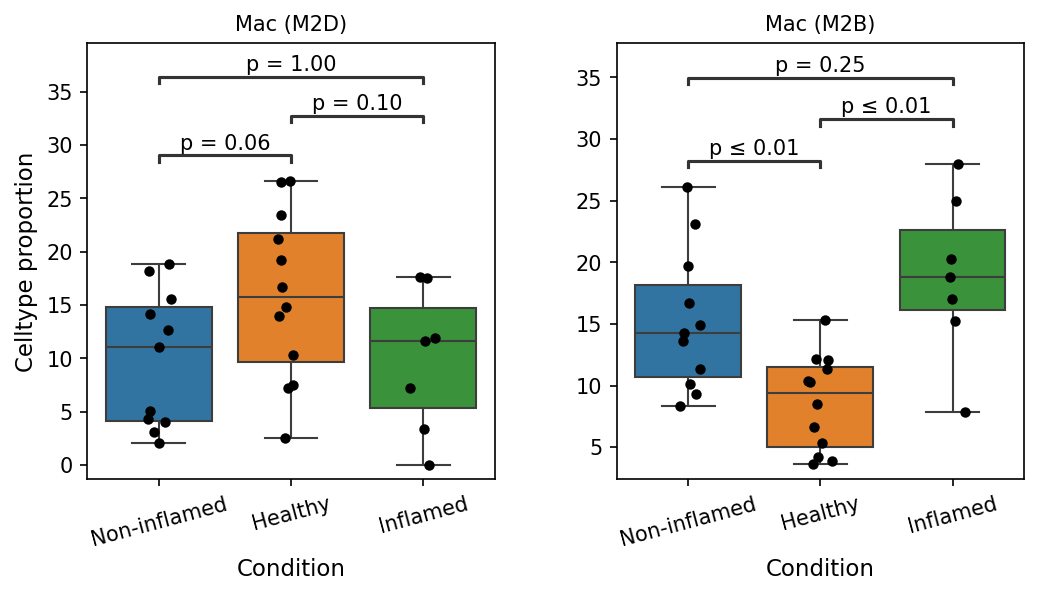
This analysis investigates the proportions of specific macrophage subsets, Mac (M2D) and Mac (M2B), across different conditions (Non-inflamed, Healthy, Inflamed) in human colon single-cell RNA-seq data. Box plots are used to visualize the celltype proportions, with statistical significance between groups indicated by p-values. The goal is to identify how the relative abundance of these macrophage populations shifts in various physiological and pathological states of the colon.
Visual Summary
The box plots display the proportion of Mac (M2D) and Mac (M2B) cells as a percentage of total cells, comparing Non-inflamed, Healthy, and Inflamed colon conditions.
Mac (M2D) Proportions:
- The median proportion of Mac (M2D) appears highest in the Healthy condition, followed by Non-inflamed, and then Inflamed.
- There is a trend towards a higher proportion of Mac (M2D) in Healthy individuals compared to Non-inflamed conditions (p = 0.06).
- The difference between Healthy and Inflamed conditions shows a trend (p = 0.10), suggesting a possible decrease in Mac (M2D) in inflamed states compared to healthy.
- No significant difference is observed between Non-inflamed and Inflamed conditions (p = 1.00).
Mac (M2B) Proportions:
- The median proportion of Mac (M2B) is lowest in the Healthy condition.
- There is a statistically significant lower proportion of Mac (M2B) in Healthy individuals compared to both Non-inflamed (p ≤ 0.01) and Inflamed (p ≤ 0.01) conditions.
- No statistically significant difference is observed between Non-inflamed and Inflamed conditions (p = 0.25) for Mac (M2B) proportions, although both show elevated levels compared to Healthy.
Biological Interpretation
Macrophages are highly plastic immune cells that play crucial roles in both maintaining tissue homeostasis and orchestrating inflammatory responses. Their polarization into distinct subsets, such as M1, M2A, M2B, M2C, and M2D, dictates their functional phenotype.
Mac (M2D) in Colon Homeostasis and Inflammation:
- The trend of higher Mac (M2D) proportions in Healthy colon compared to Non-inflamed (p=0.06) and Inflamed (p=0.10) conditions suggests that M2D macrophages might be important for maintaining the healthy state of the colon. M2D macrophages are sometimes associated with immune regulation, tissue repair, and angiogenesis, but can also be linked to immunosuppression and tumor progression in other contexts. In the colon, a reduction of this subset during inflammation might indicate a shift away from tissue-protective or homeostatic regulatory mechanisms, or that these cells are outcompeted by other macrophage subsets in an inflamed environment.
- Further investigation into the specific markers and functional programs of these M2D cells in the colon would be valuable.
Mac (M2B) in Colon Inflammation:
- The most striking finding is the significant increase in Mac (M2B) proportions in both Non-inflamed and Inflamed conditions compared to the Healthy colon (p ≤ 0.01 for both comparisons). This strongly suggests that the M2B macrophage subset is expanded during conditions that deviate from a completely healthy state, including non-inflamed disease states or pre-inflammatory conditions, and active inflammation.
- M2B macrophages are a less classically defined M2 subset, often induced by immune complexes and Toll-like receptor agonists. They exhibit a mixed phenotype, potentially having both pro-inflammatory (e.g., producing IL-6, TNF-α) and regulatory (e.g., producing IL-10) functions, thus playing complex roles in inflammation and immune regulation [1].
- The elevated presence of M2B macrophages in both Non-inflamed and Inflamed conditions could indicate their involvement in the initial stages of immune dysregulation or as a persistent component of the immune response in conditions leading to or maintaining inflammation in the colon. Their role might be to modulate or contribute to the inflammatory milieu.
Clinical or Translational Implications
The differential distribution of macrophage subsets like M2D and M2B across colon conditions carries significant clinical and translational implications:
- Biomarkers of Disease State: The observed shifts in M2B proportions could serve as potential biomarkers for distinguishing healthy colon tissue from non-inflamed or inflamed disease states. Monitoring M2B levels might aid in early detection of inflammatory processes or disease progression.
- Therapeutic Targets in Inflammatory Bowel Disease (IBD): Given the robust increase of Mac (M2B) in both Non-inflamed and Inflamed conditions, targeting this specific macrophage subset could represent a novel therapeutic strategy for inflammatory bowel diseases or other colon inflammatory conditions. Modulating the M2B phenotype or reducing their abundance might help to alleviate inflammation or restore tissue homeostasis.
- Understanding Disease Mechanisms: These findings contribute to a deeper understanding of the immune cell landscape in colon pathology. Elucidating the precise functions of colon-resident M2D and M2B macrophages in different conditions could uncover key mechanisms driving disease development and resolution. Future studies should focus on the specific molecular profiles of these cells in the human colon to fully understand their functional impact.
---
References
- M2 Macrophages and their polarization: A general overview of macrophage polarization states, including M2 subsets, and their roles in various biological processes. PubMed Search: "M2 macrophage polarization" Colon
8. Non-inflamed Colon Cell-Cell Interaction Landscape
[Analysis Visualization Results]...
Analysis Overview
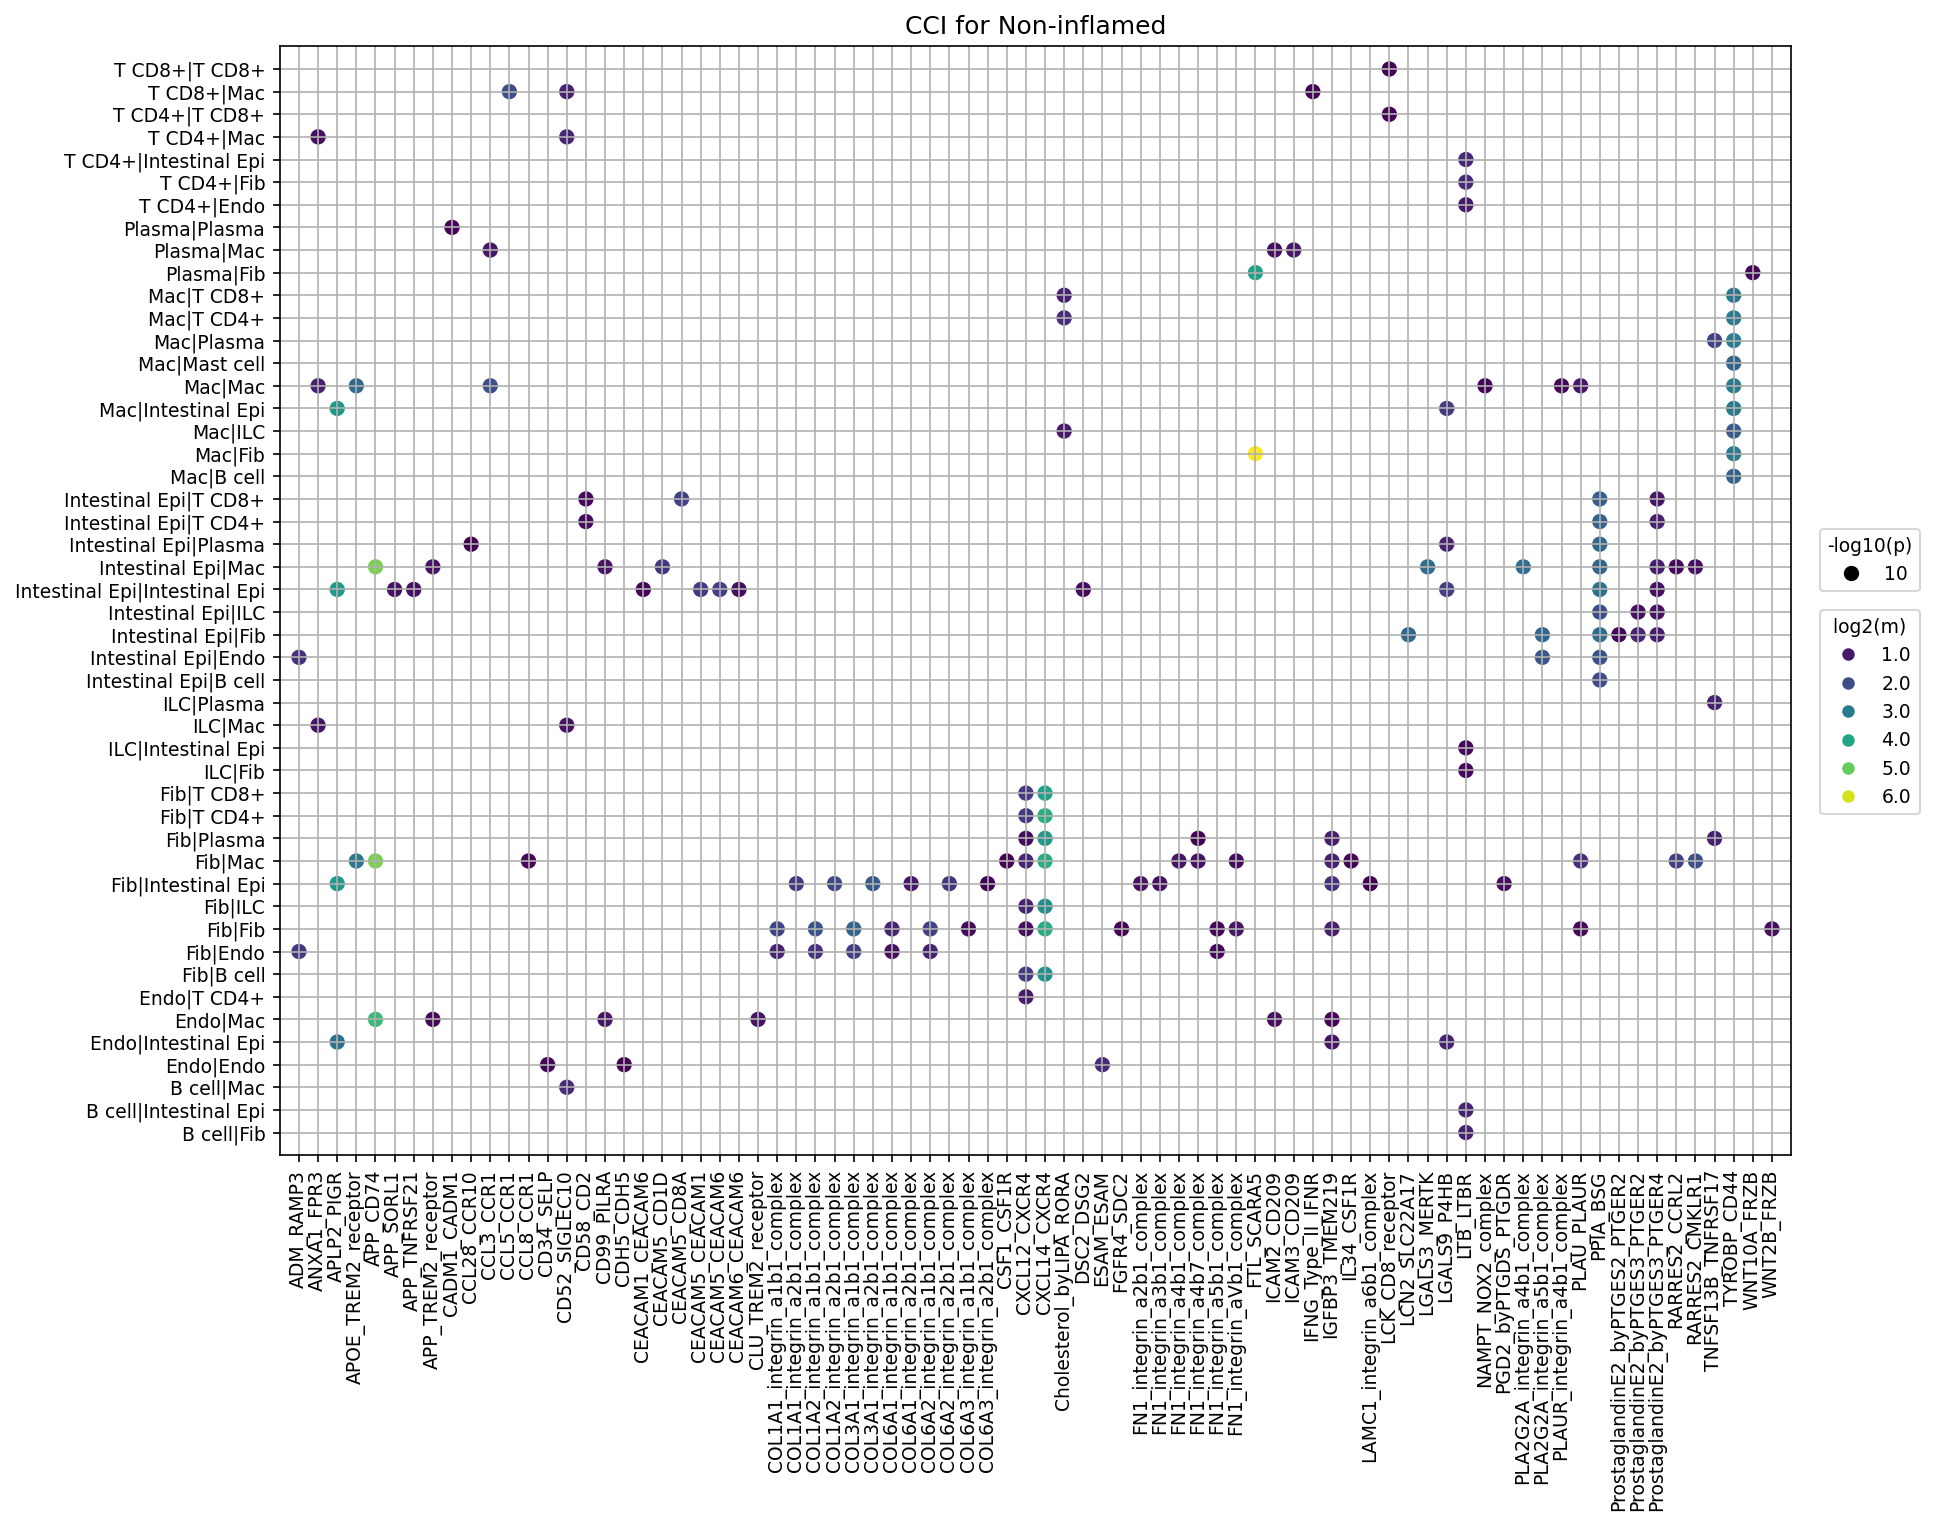
This analysis visualizes the cell-cell interaction (CCI) landscape within the colon in a "Non-inflamed" state, leveraging single-cell RNA sequencing data. CellPhoneDB was used to infer ligand-receptor interactions between different cell types, and the plot_cci_dots tool displays the most significant interactions (up to 80 pairs) based on p-value and mean expression. The goal is to understand the baseline communication networks present in a healthy or quiescent colon environment.
Visual Summary
The dot plot displays a matrix where the y-axis represents interacting cell type pairs (e.g., CellA|CellB), and the x-axis represents specific ligand-receptor gene pairs or complexes. Each dot signifies a significant cell-cell interaction.
- Dot Size (Significance): The size of each dot corresponds to the negative log10 of the interaction's p-value (-log10(p)). Larger dots indicate more statistically significant interactions.
- Dot Color (Expression Strength): The color of each dot represents the log2 mean expression of the interacting ligand-receptor pair (log2(m)). Brighter, yellow-green colors indicate higher average expression levels, while darker, purple colors indicate lower expression levels (but still above the mean_cutoff of 0.01).
Several patterns emerge:
- Prominent Cell Types: Interactions involving Intestinal Epithelial cells, Fibroblasts, Macrophages, and T cells (CD4+ and CD8+) appear frequently.
- Abundant Interaction Families: A notable feature is the high number of interactions involving Integrin complexes (e.g., COL1A1_integrin_a2b1_complex, FN1_integrin_a4b1_complex, FN1_integrin_a5b1_complex, LAMA1_integrin_a6b1_complex). These interactions are seen across various cell type pairs, particularly involving Fibroblasts and Endothelial cells, as well as interactions with T cells and Macrophages.
- CEACAM Interactions: Several CEACAM-related interactions (CEACAM1_CEACAM1, CEACAM5_CD1D, CEACAM6_CEACAM6) are also observed, often with high significance.
- Chemokine Signaling: CXCL12-CXCR4 and CXCL14-CXCR4 interactions are present, particularly with Macrophages and T cells.
- Prostaglandin Signaling: ProstaglandinE2 signaling (via PTGES2/3-PTGER2/4) shows interactions involving Fibroblasts, Intestinal Epithelial cells, and Macrophages.
- Clustering of Interactions: Specific ligand-receptor pairs like the Integrins and CEACAMs show interactions with a wide range of cell-cell pairs, suggesting their broad involvement in intercellular communication in the non-inflamed colon.
Biological Interpretation
The observed cell-cell interactions in the non-inflamed colon highlight crucial pathways involved in maintaining tissue homeostasis, barrier integrity, and immune surveillance.
- Extracellular Matrix (ECM) Remodeling and Adhesion: The strong presence of Integrin-mediated interactions (e.g., involving Collagen, Fibronectin, Laminin) between Fibroblasts, Intestinal Epithelial cells, Endothelial cells, and various immune cells (T cells, Macrophages) underscores the critical role of cell-ECM and cell-cell adhesion. Integrins are essential for cell migration, proliferation, differentiation, and tissue organization. In the colon, these interactions are vital for maintaining the structural integrity of the gut lining and regulating cell behavior within the stromal and epithelial compartments. For instance, Fibroblast-Intestinal Epithelial cell interactions via Integrins likely contribute to crypt architecture and epithelial cell turnover. GeneCards: Integrin Family
- Immune Cell Migration and Homeostasis:
- CXCL12-CXCR4 axis: This interaction, observed between various cell types including Macrophages and T cells, is a well-known chemokine signaling pathway crucial for immune cell trafficking, retention, and immune cell development in lymphoid organs and inflamed tissues. In a non-inflamed setting, it likely contributes to the homing and maintenance of resident immune cells. PubMed Search: CXCL12 CXCR4 immune homeostasis
- CEACAM interactions: Carcinoembryonic antigen-related cell adhesion molecules (CEACAMs) are involved in cell adhesion, signaling, and host-pathogen interactions. Their presence across multiple cell types suggests their role in maintaining epithelial integrity and modulating immune responses in the gut.
- Prostaglandin Signaling in Gut Homeostasis: Interactions involving Prostaglandin E2 (PGE2) and its receptors (PTGER2, PTGER4) are prominent. PGE2 is a lipid mediator that plays a multifaceted role in the gut, including maintaining epithelial barrier function, modulating immune responses, and regulating motility. In the non-inflamed state, it likely contributes to immune tolerance and tissue repair mechanisms. PubMed Search: Prostaglandin E2 gut homeostasis
- Baseline Immune Cell Cross-talk: Interactions between T cells (CD4+, CD8+) and other immune cells (Macrophages, Plasma cells), as well as with Intestinal Epithelial cells and Fibroblasts, reflect the constant immune surveillance and intricate communication necessary to maintain immune tolerance in the gut, even in the absence of overt inflammation. For example, Macrophage-T cell interactions are fundamental for antigen presentation and T cell activation/regulation.
Clinical or Translational Implications
Understanding the baseline cell-cell interaction network in the non-inflamed colon provides a crucial reference for identifying dysregulated communication in disease states, offering insights for therapeutic development and experimental validation.
- Reference for Disease States: This non-inflamed CCI map serves as a fundamental baseline. By comparing these interactions with those in "Inflamed" conditions (as provided in the conditions context), researchers can identify specific ligand-receptor pairs and cell-cell communication hubs that are gained or lost, amplified or suppressed during inflammation. This differential analysis can pinpoint disease-specific interaction targets.
- Therapeutic Target Prioritization:
- Integrin complexes: Given their broad involvement in tissue structure and cell function, specific integrin complexes could be targets for modulating fibrosis, epithelial repair, or immune cell trafficking in inflammatory bowel diseases (IBD). For example, blocking specific integrins (e.g., α4β7 for T cell gut homing) is already a strategy in IBD treatment UniProt: ITGA4. Further investigation into the specific integrin complexes highlighted here, particularly those mediating interactions between stromal cells and immune/epithelial cells, could reveal novel targets.
- Prostaglandin E2 pathway: The robust PGE2 signaling in the non-inflamed colon suggests its importance in gut health. If PGE2 production or signaling is found to be deficient in certain inflammatory conditions, augmenting this pathway could be a therapeutic strategy to restore barrier function or modulate immune responses. Conversely, if it's overactive in a detrimental way, targeting its receptors could be beneficial.
- Chemokine axes (e.g., CXCL12-CXCR4): While essential for homeostasis, these axes are often dysregulated in inflammation and cancer. If their activity is found to be aberrantly increased in disease, targeting CXCR4 or CXCL12 could limit pathogenic immune cell accumulation or stromal cell activation.
- Experimental Validation: The identified high-confidence ligand-receptor pairs provide concrete targets for further experimental validation.
- In vitro co-culture models: Co-culturing specific cell types (e.g., Intestinal Epithelial cells with Fibroblasts or Macrophages) and perturbing the identified ligand-receptor pairs (e.g., using neutralizing antibodies, receptor antagonists, or CRISPR-based knockouts/knockdowns) can validate their functional significance in processes like adhesion, migration, cytokine production, or barrier integrity.
- In vivo models: Genetically modified mouse models (e.g., conditional knockouts of specific ligands or receptors in certain cell types) or pharmacological interventions targeting these pathways can assess their role in gut homeostasis and their contribution to disease pathology in experimental colitis models.
- Spatial transcriptomics: Combining these CCI findings with spatial information could reveal the precise microenvironmental contexts where these interactions are most active, further prioritizing targets for spatial modulation.
9. Immune Checkpoint and Cell Cycle Gene-Associated Cell-Cell Interactions in Colon Conditions
[Analysis Visualization Results]...
Analysis Overview
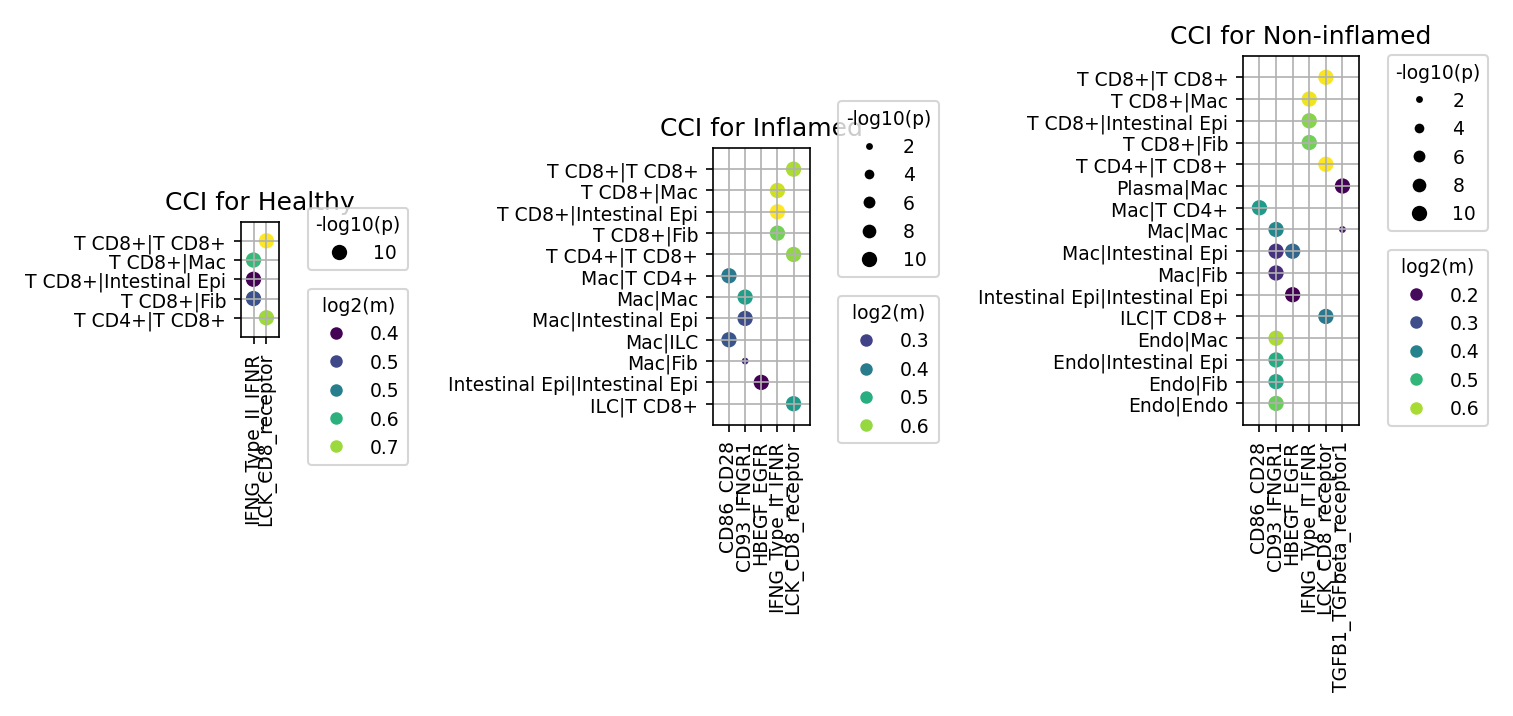
This analysis investigates cell-cell interactions (CCI) mediated by a curated set of genes related to immune checkpoints and cell cycle pathways across different colon conditions: Healthy, Inflamed, and Non-inflamed. The plot_cci_dots tool was used to visualize significant ligand-receptor interactions between various cell types, focusing on the mean interaction strength and statistical significance (p-value). The precomputed CCI results from CellPhoneDB are leveraged to understand the dynamic changes in intercellular communication within the colonic microenvironment in response to different physiological states.
Visual Summary
The provided dot plots illustrate cell-cell interactions for specific ligand-receptor pairs across Healthy, Inflamed, and Non-inflamed colon tissues.
- Healthy Condition: Shows a limited set of interactions, primarily involving T CD8+ cells. Key ligand-receptor pairs observed are IFNG_Type II_IFNR and LCK_CD8_receptor. The dominant cell-cell pairs include T CD8+ interacting with itself (T CD8+|T CD8+) and with other immune (Macrophage) and tissue-resident cells (Intestinal Epithelial cell, Fibroblast).
- Inflamed Condition: Exhibits a significantly increased number and diversity of cell-cell interactions compared to the Healthy state. New prominent ligand-receptor pairs emerge, notably CD86_CD28 and HBEGF_EGFR, alongside the sustained IFNG_Type II_IFNR and LCK_CD8_receptor. Macrophages (Mac), Intestinal Epithelial cells, and ILCs are more broadly involved in interactions, forming pairs like Mac|T CD4+, Mac|Mac, and Mac|Intestinal Epi. The interaction strengths (log2(m)) are generally higher for several pairs, and p-values (-log10(p)) are significant.
- Non-inflamed Condition: Presents a complex interaction landscape with some similarities to the Inflamed condition, but also distinct features. CD86_CD28, HBEGF_EGFR, IFNG_Type II_IFNR, and LCK_CD8_receptor interactions persist. A new significant interaction involves TGFB1_TGFbeta_receptor1. Additionally, Endothelial cells (Endo) participate in various interactions (Endo|Mac, Endo|Intestinal Epi, Endo|Fib, Endo|Endo), and Plasma cell interactions (T CD4+|Plasma) are observed. The overall number of significant interactions is high, comparable to the Inflamed state, but with unique specificities.
Biological Interpretation
The analysis of cell-cell interactions mediated by immune checkpoint and related genes reveals dynamic changes in intercellular communication across different colon conditions.
- Healthy Colon Homeostasis: In the healthy colon, interactions are primarily driven by CD8+ T cells, involving IFNG_Type II_IFNR and the LCK_CD8_receptor module. This suggests a state of immune surveillance and homeostatic maintenance where CD8+ T cells play a central role, possibly in minor tissue maintenance or early detection of threats. IFN-gamma signaling is crucial for host defense and immune regulation [PubMed search: IFN-gamma signaling].
- Inflammation-driven Immune Activation: The inflamed condition is characterized by a marked increase in immune cell activation and diversification of interacting cell types and ligand-receptor pairs.
- T Cell Co-stimulation: The strong presence of the CD86-CD28 interaction is a key indicator of T cell activation. CD86, expressed on antigen-presenting cells (APCs) like macrophages, binds to CD28 on T cells, providing the critical second signal for T cell proliferation and differentiation, central to adaptive immune responses during inflammation [GeneCards: CD28].
- Tissue Remodeling and Repair: The HBEGF-EGFR interaction, which plays roles in cell proliferation, migration, and survival, suggests active tissue remodeling, possibly related to epithelial repair or damage response in the inflamed environment [UniProt: HBEGF].
- Persistent IFN Signaling: IFNG_Type II_IFNR interactions remain prominent, reflecting a persistent pro-inflammatory state.
- Myeloid and Epithelial Cell Engagement: Macrophages and Intestinal Epithelial cells become highly engaged, indicating their critical roles in mediating and responding to inflammatory signals.
- Non-inflamed State: Transition or Chronic Low-grade Activity: The "Non-inflamed" condition, while not "Healthy," presents a complex profile. It retains features of activated immunity seen in the "Inflamed" state (e.g., CD86-CD28, HBEGF-EGFR) but also introduces new elements.
- Immune Regulation and Fibrosis: The emergence of TGFB1-TGFbeta_receptor1 signaling is particularly noteworthy. TGF-beta is a pleiotropic cytokine with profound roles in immune suppression, tissue repair, and fibrosis. Its activity in a "Non-inflamed" context could indicate ongoing processes of immune regulation to resolve inflammation, or alternatively, a predisposition towards fibrosis and tissue remodeling following acute inflammatory episodes [PubMed search: TGFB1 immune regulation fibrosis].
- Vascular Involvement: The increased interactions involving Endothelial cells suggest active angiogenesis or altered vascular permeability, which are common features in both active inflammation and subsequent tissue remodeling/repair.
- Humoral Immunity: The presence of T CD4+|Plasma cell interactions implies active involvement of humoral immune responses, potentially reflecting antigen presentation and antibody production in the gut.
The absence of direct cell cycle gene (e.g., CDK1, CCNA2) interactions as ligand-receptor pairs is expected, as these are primarily intracellular signaling molecules, and the CCI analysis focuses on surface ligand-receptor pairs. The detected interactions are indeed predominantly related to immune signaling and cell fate.
Clinical or Translational Implications
The observed patterns of cell-cell interactions offer significant insights for therapeutic targeting and understanding disease mechanisms in the colon.
- Therapeutic Targets for Inflammatory Bowel Disease (IBD):
- The prominent CD86-CD28 co-stimulation in the Inflamed condition represents a potential therapeutic target to dampen excessive T cell activation in conditions like IBD [PubMed search: CD86 CD28 IBD therapy]. Modulating this pathway could help control acute inflammation.
- IFNG signaling is a known contributor to inflammatory responses. Strategies to modulate IFN-gamma pathways could be explored.
- Biomarkers for Disease State and Prognosis:
- The shift from IFNG-dominant interactions in Healthy to a broad activation including CD86-CD28 and HBEGF-EGFR in Inflamed states could serve as diagnostic markers for active inflammation.
- The presence of TGFB1-TGFbeta_receptor1 signaling in the "Non-inflamed" condition could be a critical biomarker for identifying patients at risk of chronic complications such as fibrosis, or for monitoring the resolution phase of inflammation. Targeting TGF-beta signaling could be relevant in preventing or treating fibrosis in chronic intestinal inflammation [PubMed search: TGFB1 fibrosis IBD].
- Context-Specific Immune Modulation: Understanding how these ligand-receptor interactions vary across conditions allows for more precise therapeutic strategies. For instance, interventions might focus on T cell activation in acute inflammation (CD86-CD28), while therapies in "Non-inflamed" states might focus on regulating fibrotic responses (TGFB1-TGFbeta_receptor1) or promoting epithelial healing (HBEGF-EGFR).
- Role of Non-Immune Cells: The consistent involvement of Intestinal Epithelial cells and Fibroblasts in diverse interactions highlights that these non-immune cells are not merely passive bystanders but active participants in shaping the immune microenvironment. Targeting interactions involving these cell types could offer novel therapeutic avenues.
10. Condition-Specific Cell-Cell Interaction Patterns in Human Colon
[Analysis Visualization Results]...
Analysis Overview
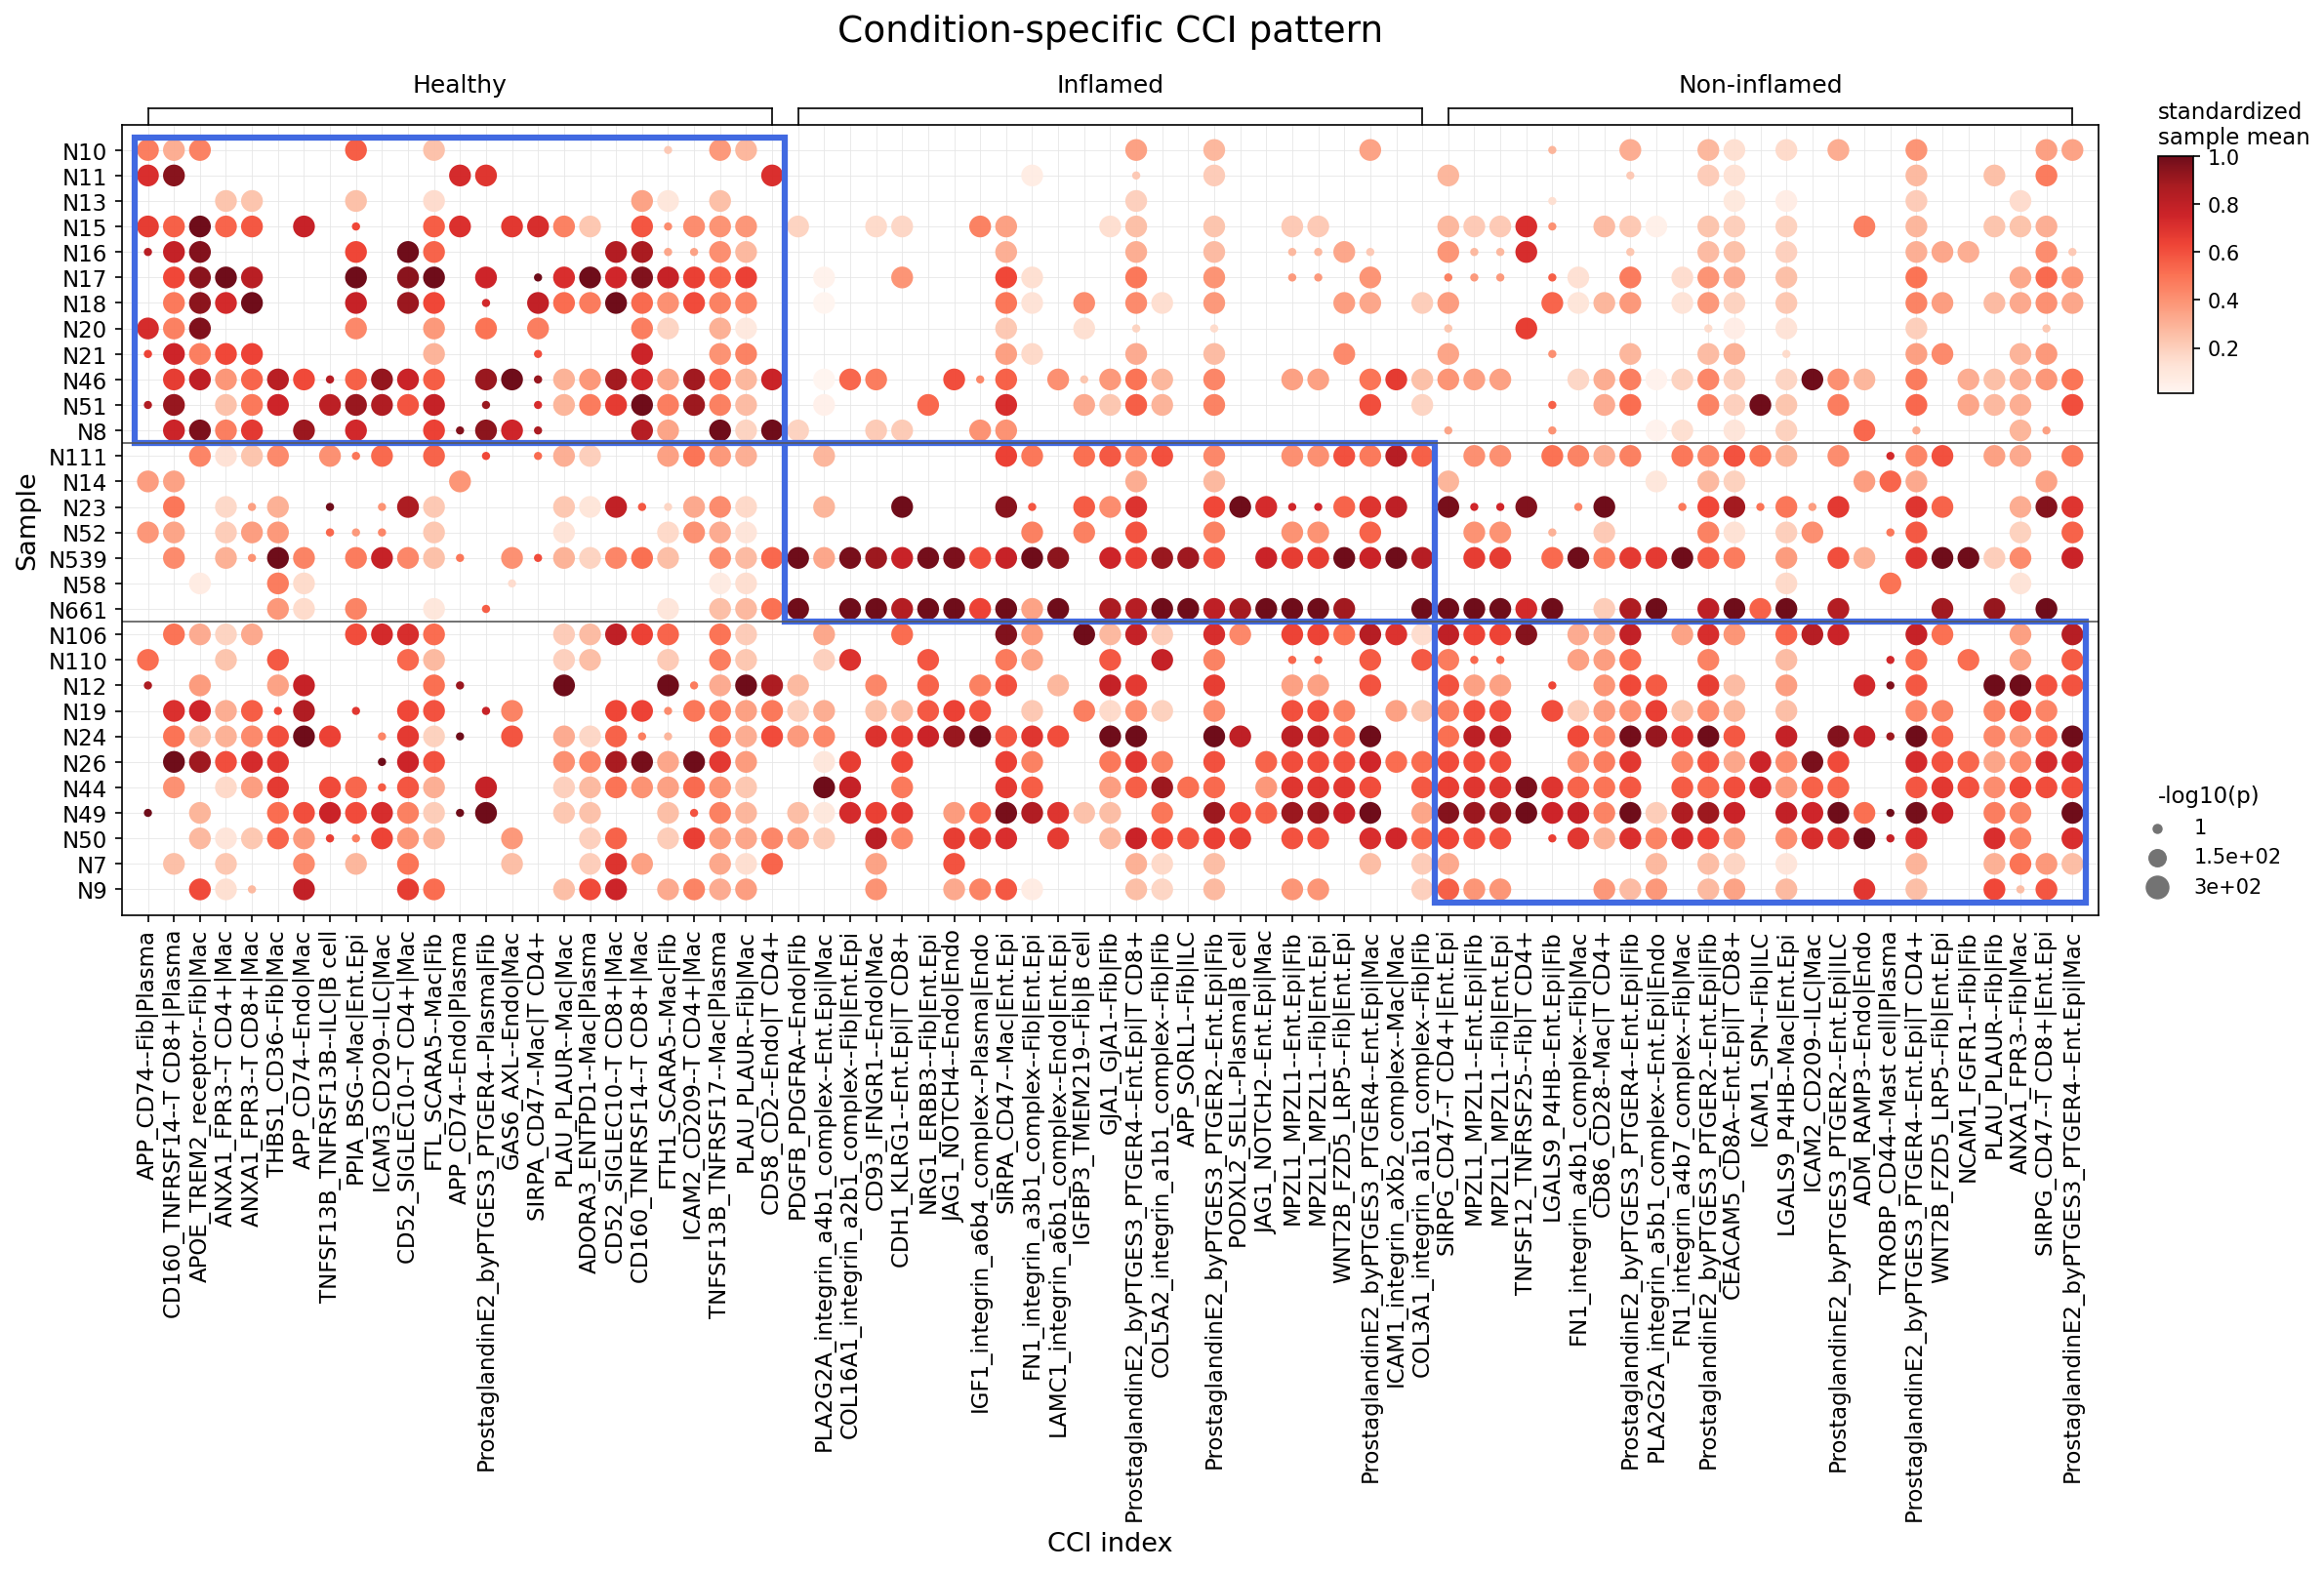
This analysis aimed to identify statistically significant differences in cell-cell interactions (CCIs) among major immune and stromal cells, including intestinal epithelial cells, across three distinct conditions: Healthy, Inflamed, and Non-inflamed colon tissue. The CellPhoneDB method was utilized to infer ligand-receptor interactions, and a statistical test (t-test) was applied to pinpoint CCIs demonstrating significantly greater interaction strength in one condition compared to the others. The results are presented in a dot plot, where the size of each dot corresponds to the significance of the difference (-log10(p-value)), and the color intensity reflects the standardized mean interaction strength within each sample. The analysis specifically considered interactions involving B cells, T cells, Myeloid cells (e.g., Macrophages), Mast cells, Stromal cells (e.g., Fibroblasts), Endothelial cells, and Intestinal Epithelial cells.
Visual Summary
The "Condition-specific CCI pattern" dot plot vividly illustrates unique cell-cell interaction profiles across the Healthy, Inflamed, and Non-inflamed colon tissue samples.
- Condition-Specific Clustering: Distinct clusters of strong and statistically significant interactions are observable within each condition's panel (Healthy, Inflamed, Non-inflamed), emphasizing condition-specific cellular communication patterns. Blue boxes clearly demarcate the samples belonging to each respective condition group.
- Healthy Colon Signature: The "Healthy" samples (e.g., N10-N8) exhibit a prominent set of highly significant (larger dots) and strong (dark red color) interactions concentrated on the left side of the plot. Key interactions include APP_CD74--Fib|Plasma, CD160_TNFRSF14--T CD8+|Plasma, and ANXA1_FPR3--T CD4+|Mac, and ANXA1_FPR3--T CD8+|Mac. These interactions are conspicuously diminished or absent in the Inflamed and Non-inflamed samples, suggesting their role in maintaining tissue homeostasis.
- Inflamed Colon Signature: "Inflamed" samples (e.g., N59-N106, N110-N9) display a robust and distinct upregulation of CCIs, predominantly in the central portion of the plot. These interactions are characterized by large, dark red dots, signifying both high statistical significance and potent interaction strength. Notable examples include extracellular matrix (ECM)-related interactions such as COL3A1_integrin_a1b1_complex--Fib|Fib and FN1_integrin_a3b1_complex--Fib|Fib, epithelial-stromal crosstalk like WNT2B_FZD5_LRP5--Fib|Ent.Epi and ProstaglandinE2_byPTGES3_PTGER4--Ent.Epi|Fib, and endothelial interactions such as JAG1_NOTCH4--Endo|Endo.
- Non-inflamed Colon Pattern: The "Non-inflamed" samples show a distinct pattern that partially overlaps with the "Inflamed" condition, particularly with a subset of the ProstaglandinE2_byPTGES3_PTGER4 interactions. However, this group generally lacks the extensive and intense fibrotic and Wnt signaling signatures observed in actively inflamed samples, suggesting a potentially milder or quiescent inflammatory state.
Biological Interpretation
The identified condition-specific CCI patterns offer crucial biological insights into the intricate cellular communications governing colon health and disease pathogenesis.
Homeostatic Interactions in Healthy Colon:
- The enrichment of interactions such as ANXA1_FPR3 involving T cells and macrophages (e.g., ANXA1_FPR3--T CD4+|Mac) in healthy colon suggests active immune regulation and pro-resolving mechanisms. Annexin A1 (ANXA1) and its receptor Formyl Peptide Receptor 3 (FPR3) are well-known mediators of inflammation resolution and tissue repair, contributing to the maintenance of immune homeostasis. PubMed: 22896574
- Interactions like APP_CD74--Fib|Plasma highlight the roles of plasma cells and fibroblasts in the healthy gut, potentially contributing to local immune surveillance and structural integrity.
Pro-inflammatory and Fibrotic Crosstalk in Inflamed Colon:
- The strong presence of Extracellular Matrix (ECM) related interactions (e.g., COL3A1_integrin_a1b1_complex--Fib|Fib, FN1_integrin_a3b1_complex--Fib|Fib) between fibroblasts indicates active ECM remodeling and deposition. This is a characteristic feature of fibrotic processes prevalent in chronic inflammatory conditions, such as Inflammatory Bowel Disease (IBD). PubMed: 29775088
- Epithelial-Stromal Interactions: Upregulated Wnt/Frizzled signaling (e.g., WNT2B_FZD5_LRP5--Fib|Ent.Epi) and Prostaglandin E2 (PGE2) signaling (e.g., ProstaglandinE2_byPTGES3_PTGER4--Ent.Epi|Fib) in inflamed samples are critical pathways for intestinal homeostasis and are frequently dysregulated in inflammation. Wnt signaling orchestrates epithelial proliferation and differentiation, while PGE2 (synthesized by PTGES3 and acting via PTGER4) is a potent inflammatory lipid mediator that impacts immune cells, epithelial cells, and fibroblasts, contributing to both inflammation and tissue repair processes. PubMed: 32269932, PubMed: 29871781
- Angiogenesis and Immune Cell Communication: The prominent JAG1_NOTCH4--Endo|Endo interaction suggests activated Notch signaling between endothelial cells, indicative of enhanced angiogenesis, a process crucial for supplying nutrients and immune cells to inflamed tissues. PubMed: 31256038 Furthermore, interactions involving macrophages (e.g., IGF1_integrin_a6b4_complex--Ent.Epi|Mac) highlight their pivotal role in orchestrating inflammatory responses through diverse crosstalk with other cell types.
- "Non-inflamed" as an Intermediate State: The "Non-inflamed" samples, while sharing some inflammatory signals, particularly those related to PGE2 pathways, lack the extensive fibrotic and Wnt-related signatures observed in actively "Inflamed" samples. This suggests that the "Non-inflamed" state, in this context, might represent a quiescent or resolving inflammatory condition that is distinct from true healthy homeostasis, where certain immune adaptations or low-level inflammatory mediators may persist.
Clinical or Translational Implications
These findings carry several significant clinical and translational implications for understanding and managing colon inflammatory conditions.
- Biomarker Identification: The distinct CCI signatures for Healthy, Inflamed, and Non-inflamed conditions could serve as valuable biomarkers for diagnosing inflammatory states in the colon, monitoring disease progression, or assessing therapeutic responses. For example, specific patterns of ECM-related or Wnt pathway interactions could help differentiate active inflammation from states of remission.
Therapeutic Target Discovery:
- The identified interactions driving inflammation and fibrosis, such as those involving integrins (e.g., COL3A1_integrin_a1b1_complex, FN1_integrin_a3b1_complex), Wnt/Frizzled receptors (e.g., FZD5_LRP5), PGE2 receptors (e.g., PTGER4), and Notch signaling components (e.g., JAG1_NOTCH4), represent promising therapeutic targets. Inhibiting these specific cell-cell communications could offer strategies to mitigate chronic colon inflammation and prevent fibrotic complications in diseases like IBD.
- Conversely, strategies aimed at enhancing pro-resolving interactions, such as ANXA1_FPR3 signaling, could promote tissue healing and restore gut homeostasis.
- Personalized Medicine: An in-depth understanding of the specific cellular crosstalk networks active in individual patients could facilitate personalized treatment approaches. This would enable more targeted interventions based on a patient's unique inflammatory signature, potentially leading to more effective and tailored therapies.
11. Macrophage Condition-Specific Surfaceome Markers in Colon
[Analysis Visualization Results]...
Analysis Overview
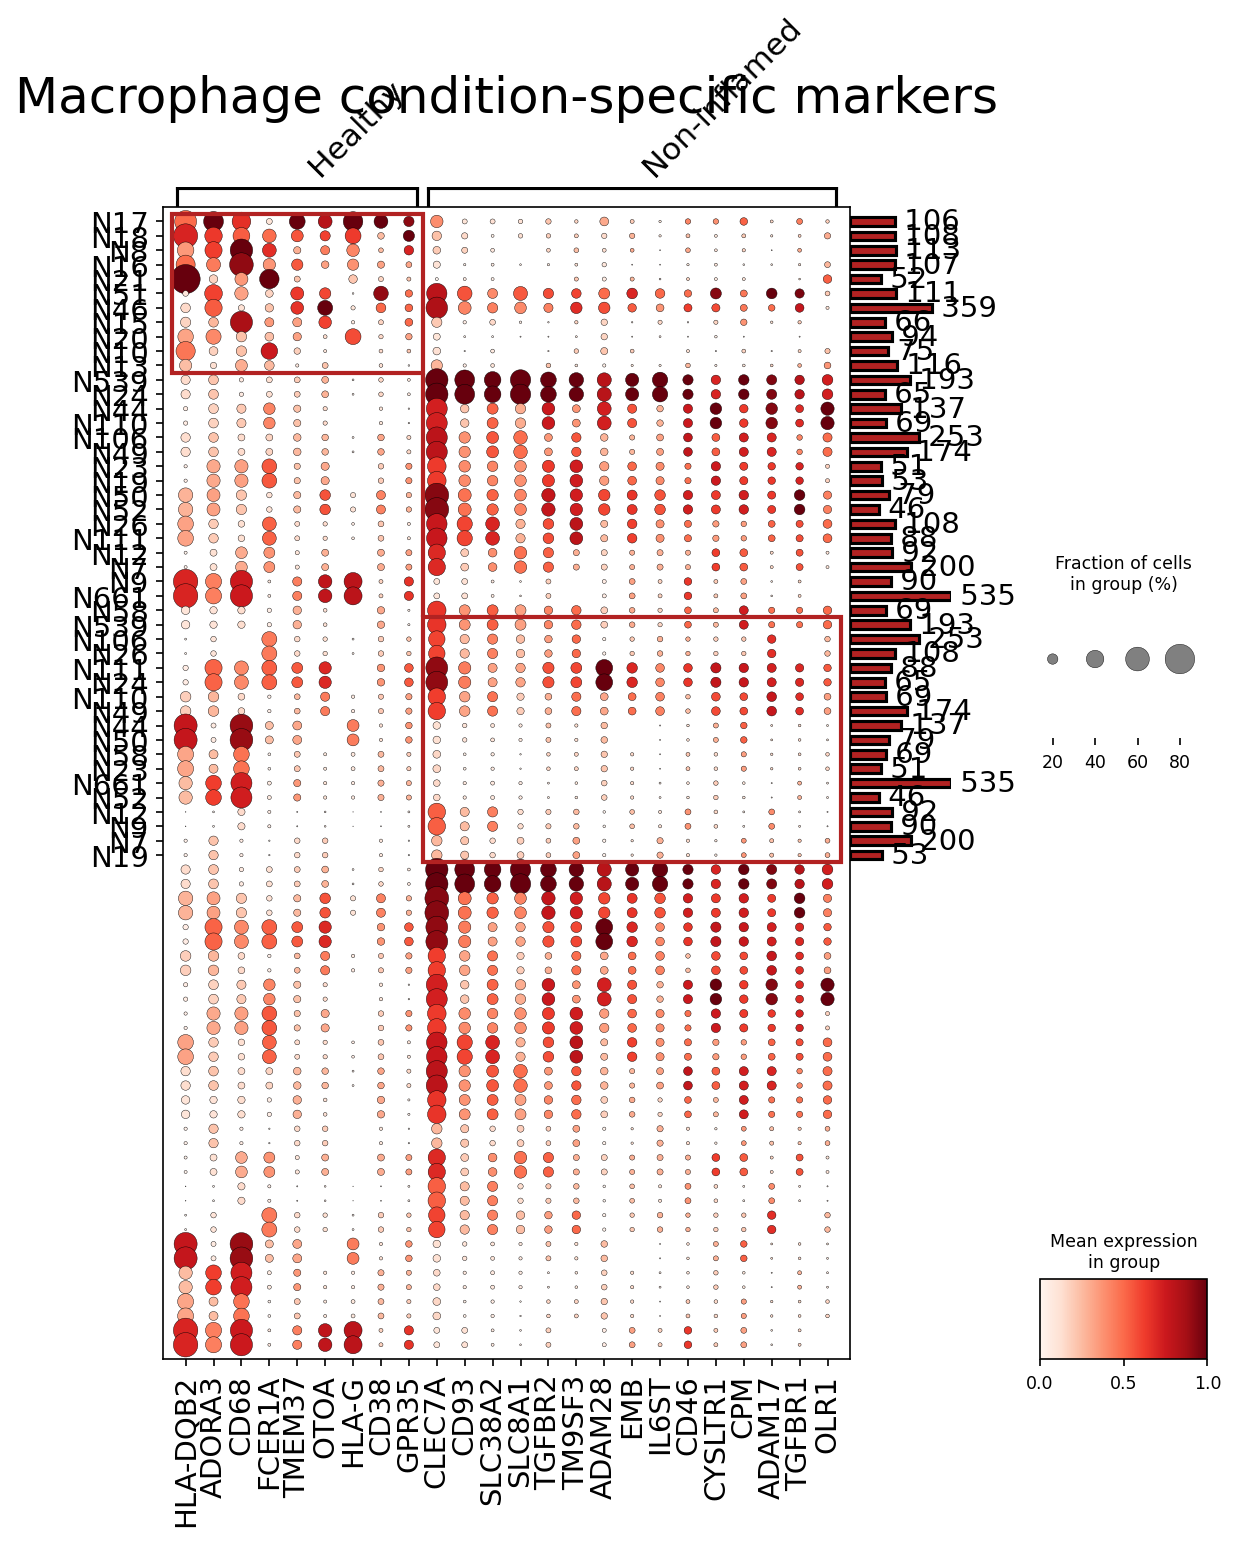
This analysis aimed to identify surfaceome markers that are specifically enriched in Macrophage cells from different colon conditions: 'Healthy' and 'Non-inflamed'. Using single-cell RNA sequencing data, differentially expressed genes (DEGs) were identified for Macrophage cells comparing each condition against others, focusing solely on surfaceome proteins. The results are visualized as a dot plot, where each row represents a distinct sample (identified by N prefix) and each column represents a selected surfaceome gene. The size of the dot indicates the fraction of cells in that sample expressing the gene, while the color intensity reflects the mean expression level of the gene in those cells.
Visual Summary
The dot plot clearly segregates Macrophage samples into two major groups based on their surfaceome marker expression profiles: 'Healthy' and 'Non-inflamed'.
- Distinct Marker Sets: Two prominent clusters of genes are highlighted by red boxes, demonstrating condition-specific expression.
- The left red box encompasses markers predominantly expressed in 'Healthy' colon Macrophages. Key markers in this group include HLA-DQB2, ADORA3, CD68, FCER1A, TMEM37, OTOA, HLA-G, CD38, and GPR35. These genes show high expression levels (darker red dots) and high detection rates (larger dot size) across most 'Healthy' samples, with minimal expression in 'Non-inflamed' samples.
- The right red box highlights markers almost exclusively expressed in 'Non-inflamed' colon Macrophages. This cluster includes genes such as CLEC7A, CD93, SLC38A2, SLC8A1, TGFBR2, TM9SF3, ADAM28, EMB, IL6ST, CD46, CYSLTR1, CPM, ADAM17, TGFBR1, and OLR1. These markers exhibit strong expression and prevalence within the 'Non-inflamed' samples, showing little to no expression in the 'Healthy' group.
- Sample Clustering: The samples on the y-axis are implicitly grouped by condition, reinforcing the visual separation of marker profiles between 'Healthy' and 'Non-inflamed' states. The number of cells per group, as indicated by the bar plot on the right, varies across samples.
Overall, the visualization effectively identifies two distinct transcriptional programs at the cell surface of Macrophages, strongly associated with the 'Healthy' versus 'Non-inflamed' states in the colon.
Biological Interpretation
The identified surfaceome markers provide significant biological insights into the functional states of colon Macrophages in healthy and non-inflamed conditions.
Healthy Macrophage Signature:
- The presence of HLA-DQB2 (MHC class II molecule) and HLA-G (non-classical MHC class I molecule) suggests that healthy colon macrophages are actively involved in antigen presentation and immune modulation, potentially maintaining immune tolerance within the gut microenvironment GeneCards: HLA-G.
- ADORA3 (Adenosine A3 receptor) is known to play a role in anti-inflammatory processes and immune regulation, consistent with a homeostatic macrophage phenotype PubMed Search: ADORA3 macrophage anti-inflammatory.
- CD68 is a commonly used pan-macrophage marker, but its specific enrichment here suggests a particular activation state or subtype dominant in the healthy colon.
- CD38 can be associated with both resting and activated immune cells and is involved in various signaling pathways.
Non-inflamed Macrophage Signature:
- Macrophages in the 'Non-inflamed' colon exhibit markers indicative of an altered, more responsive state, even if not overtly inflammatory. The expression of CLEC7A (Dectin-1), a C-type lectin receptor, suggests enhanced pattern recognition capabilities, particularly for fungal components, which can drive inflammatory responses GeneCards: CLEC7A.
- Upregulation of IL6ST (gp130, a common receptor subunit for IL-6 family cytokines) points towards increased responsiveness to cytokines that can promote inflammation, cell growth, and survival, indicating a primed state UniProt: P40189 (IL6ST Human).
- Expression of TGFBR1 and TGFBR2 (TGF-beta receptors) suggests increased sensitivity to TGF-beta signaling, which is crucial for immune suppression, tissue repair, and fibrosis. In a 'Non-inflamed' context, this could signify ongoing tissue remodeling, wound healing responses, or attempts to resolve low-grade inflammation PubMed Search: TGF-beta macrophage colon.
- ADAM17 (TACE) and ADAM28 are metalloproteases involved in shedding surface molecules (e.g., TNF-alpha, TNFR) and processing other proteins, playing critical roles in modulating immune responses and extracellular matrix. Their activation implies dynamic regulation of the macrophage surface and microenvironment.
- CYSLTR1 (Cysteinyl leukotriene receptor 1) indicates responsiveness to lipid mediators of inflammation, further supporting a pro-inflammatory or activated phenotype GeneCards: CYSLTR1.
- OLR1 (Oxidized low-density lipoprotein receptor 1) involvement suggests altered lipid metabolism and potentially increased inflammatory pathways associated with oxidative stress.
In summary, 'Healthy' colon macrophages appear to be engaged in homeostatic immune surveillance and tolerance, whereas 'Non-inflamed' macrophages show a profile consistent with a subtle shift towards immune activation, enhanced pathogen recognition, cytokine responsiveness, and tissue remodeling, reflecting a deviation from pure health, perhaps in response to environmental cues or subclinical stress in the colon.
Clinical or Translational Implications
The identification of condition-specific surfaceome markers for Macrophages in the colon has several important clinical and translational implications:
- Diagnostic Biomarkers: These distinct surface markers could serve as potential diagnostic biomarkers to differentiate 'Healthy' colon tissue from 'Non-inflamed' tissue. This distinction is particularly valuable in contexts like inflammatory bowel disease (IBD), where "non-inflamed" or quiescent areas may still harbor molecular changes that precede or contribute to disease flare-ups. Detection could be achieved through techniques like flow cytometry or immunohistochemistry on tissue biopsies.
- Therapeutic Targets: The surfaceome markers specifically enriched in 'Non-inflamed' macrophages, such as CLEC7A, IL6ST, TGFBR1/2, ADAM17, and CYSLTR1, represent potential targets for therapeutic intervention. Modulating the activity of these receptors or enzymes could alter the functional state of macrophages, potentially preventing progression from a 'Non-inflamed' to an 'Inflamed' state, or supporting tissue repair and immune resolution. For example, blocking CYSLTR1 might dampen inflammatory lipid signaling, while modulating TGF-beta signaling through its receptors could impact fibrosis or immune suppression.
- Cell-Specific Interventions: Since these are surface markers, they are amenable to cell-specific targeting strategies. For instance, antibody-drug conjugates or CAR-T cell approaches could be designed to selectively target and modulate macrophages expressing these 'Non-inflamed' markers, offering a more precise therapeutic window with potentially fewer off-target effects.
- Disease Monitoring: Monitoring the expression levels of these markers could help track disease progression, response to treatment, or predict relapse in patients with chronic colon conditions.
- Further Validation: The identified markers warrant further experimental validation using orthogonal methods (e.g., flow cytometry, immunofluorescence imaging, or spatial transcriptomics) to confirm their protein expression on the cell surface and to assess their functional roles in different colon macrophage subpopulations. This will be crucial for translating these findings into clinical applications.
12. Fibroblast Condition-Specific Surfaceome Markers in Colon
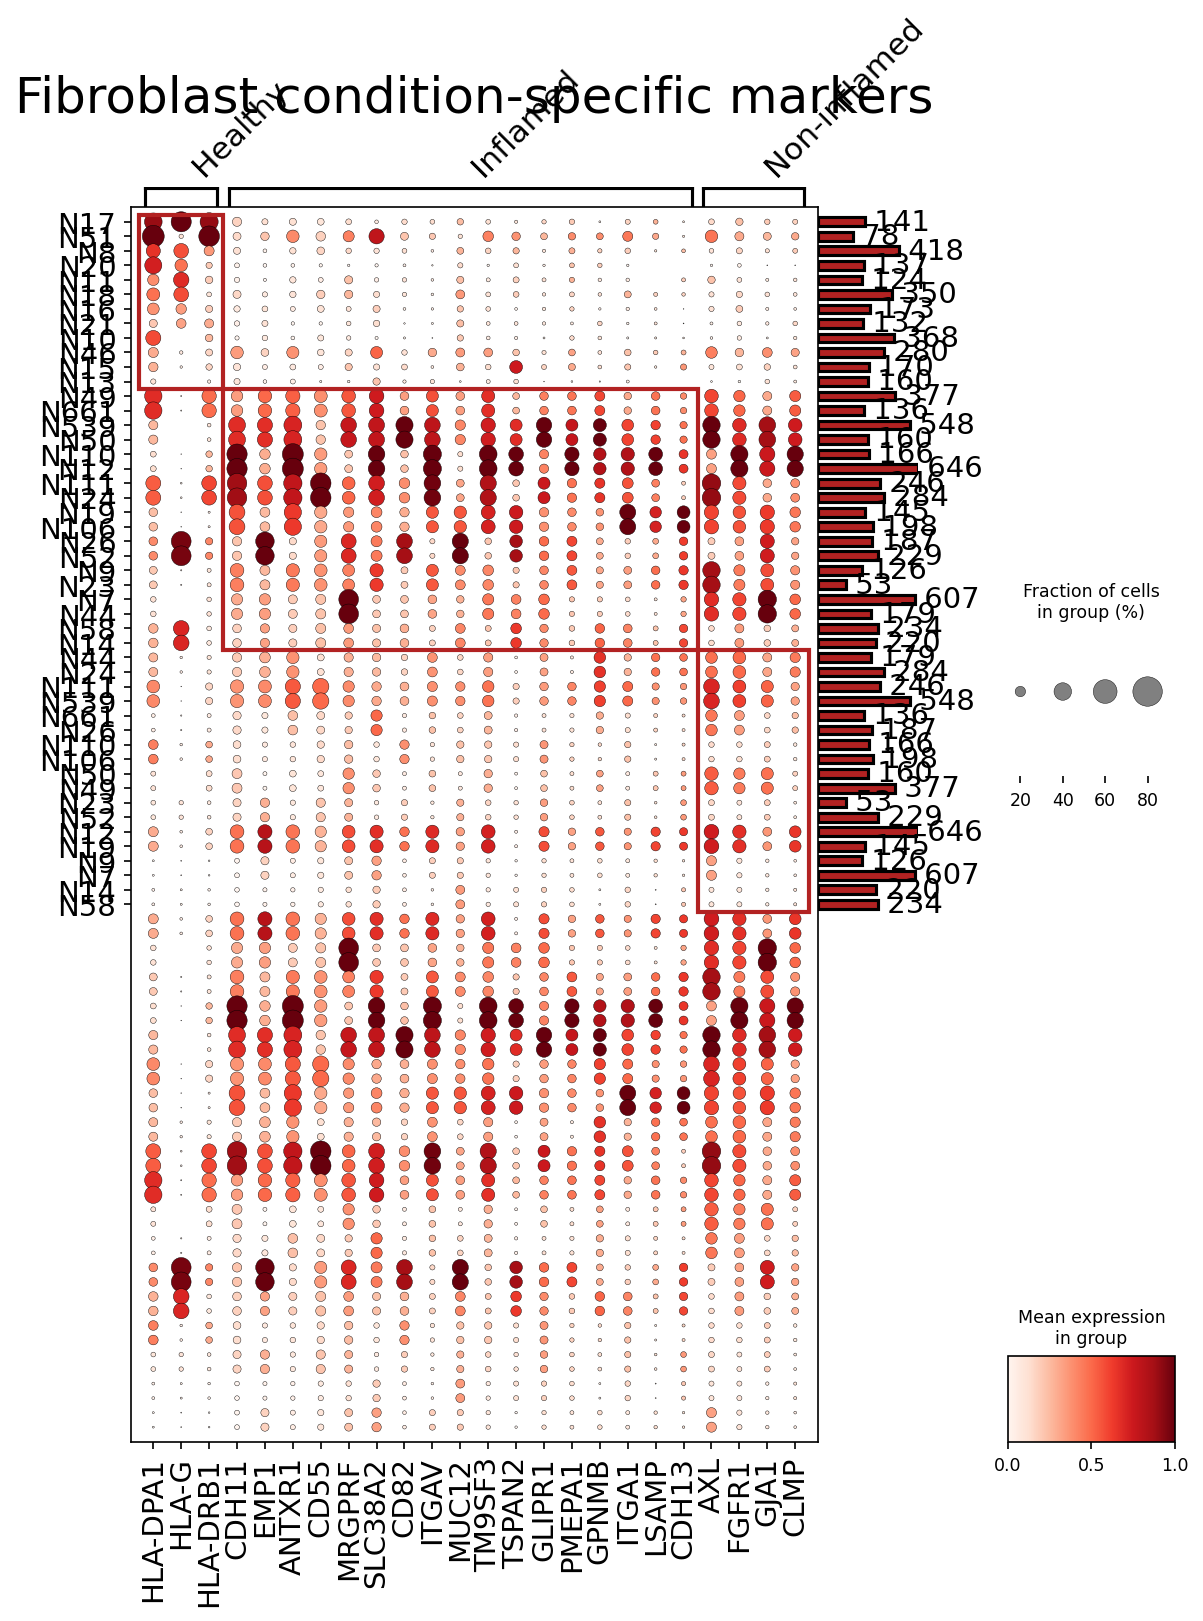
[Analysis Visualization Results]...
Analysis Overview
This analysis aimed to identify condition-specific surfaceome markers in Fibroblast cells from human colon tissue, comparing Healthy, Inflamed, and Non-inflamed conditions. The plot_markers_and_expression_dot tool was used to visualize differential gene expression, focusing exclusively on surface-expressed proteins (surfaceome markers). Markers were selected based on their differential expression and prevalence across conditions, with a maximum of 50 markers identified per condition. The dot plot illustrates the mean expression level (color intensity) and the fraction of cells expressing the gene (dot size) for each marker across different cell groups within each condition.
Visual Summary
The dot plot displays a panel of surfaceome markers identified in Fibroblast cells, grouped by their expression patterns across Healthy, Inflamed, and Non-inflamed colon conditions.
- Healthy Condition-Specific Markers: A distinct set of markers, including HLA-DPA1, HLA-DRB1, and HLA-G, shows strong expression (dark red) and high prevalence (large dots) primarily within the "Healthy" fibroblast groups. These genes are largely absent or expressed at very low levels in the Inflamed and Non-inflamed groups. This pattern is highlighted by the uppermost red box.
Inflamed and Non-inflamed Condition-Associated Markers:
- A broad cluster of genes, including EMP1, ANTXR1, CD55, CD82, ITGAV, MUC12, TSPAN2, GLIPR1, PMEPA1, GPNMB, ITGA1, LSAMP, AXL, and FGFR1, exhibit markedly increased expression and prevalence in fibroblasts from both "Inflamed" and "Non-inflamed" conditions compared to "Healthy" fibroblasts. This cluster is highlighted by the middle and bottom red boxes.
- Within this cluster, several markers, such as GPNMB, AXL, and FGFR1, appear particularly highly expressed (darkest red) and prevalent (largest dots) in Inflamed and, to a slightly lesser extent, Non-inflamed fibroblasts.
- Genes like GJA1 (Connexin 43) also show elevated expression in both Inflamed and Non-inflamed conditions, indicating potential altered intercellular communication in disease states.
- CDH11 (Cadherin-11) shows relatively consistent expression across all conditions but might be slightly higher in Inflamed/Non-inflamed.
- CLMP (CAR-like membrane protein) also shows some upregulation in the disease conditions.
General Observations:
- The mean expression scale (0.0 to 1.0, light red to dark red) and fraction of cells scale (0 to 80%, small to large dots) are clearly indicated.
- The total number of cells for each row group (N1 to N58) is provided on the right-hand side, indicating the cellular representation in each comparison.
Biological Interpretation
The observed surfaceome markers provide valuable insights into the phenotypic shifts of fibroblasts in the context of colon inflammation.
- Immune Modulatory Role of Healthy Fibroblasts: The prominent expression of HLA-DPA1, HLA-DRB1 (MHC class II genes), and HLA-G (a non-classical MHC class I gene) in healthy colon fibroblasts suggests an active role in immune surveillance and regulation. While fibroblasts are not classical antigen-presenting cells, they can express MHC class II under certain conditions, potentially influencing local immune responses or maintaining immune tolerance in healthy tissue. HLA-G is known for its immunomodulatory properties, often mediating immune suppression.
- HLA-DPA1/HLA-DRB1: GeneCards, HLA-G: GeneCards
- Inflammation-Associated Fibroblast Activation and Remodeling: The upregulation of numerous surfaceome markers in Inflamed and Non-inflamed fibroblasts points towards their activation and engagement in processes associated with chronic inflammation and tissue remodeling in the colon.
- Cell Adhesion and Migration: Genes like ITGAV (Integrin alpha V), ITGA1 (Integrin alpha 1), and CDH11 are involved in cell-matrix and cell-cell adhesion, critical for fibroblast migration, tissue repair, and fibrosis. Upregulation of integrins suggests increased interaction with the extracellular matrix (ECM), contributing to tissue stiffening and remodeling characteristic of inflammatory bowel disease (IBD) or other colon pathologies.
- ITGAV: UniProt
- ITGA1: UniProt
- CDH11: GeneCards
- Growth Factor Signaling: FGFR1 (Fibroblast Growth Factor Receptor 1) is a key receptor involved in cell proliferation, differentiation, and tissue repair. Its increased expression can enhance fibroblast responsiveness to FGFs, potentially driving pathological fibroblast expansion and fibrogenesis in inflamed conditions. AXL is a receptor tyrosine kinase associated with cell survival, proliferation, and anti-inflammatory signaling, but also involved in fibrosis in some contexts.
- FGFR1: GeneCards
- AXL: GeneCards
- ECM Remodeling and Immunomodulation: GPNMB (Glycoprotein NMB) is often upregulated in activated fibroblasts and associated with inflammation, tissue repair, and fibrosis. It can promote immune suppression and tissue remodeling.
- GPNMB: UniProt
- Other notable markers: EMP1 (Epithelial Membrane Protein 1) and MUC12 (Mucin 12) have been implicated in various cancers and inflammatory processes, suggesting broader roles in cell communication and tissue response to stress. GJA1 (Connexin 43) forms gap junctions, and its altered expression indicates changes in intercellular communication, which can modulate inflammatory responses and tissue homeostasis.
- GJA1: GeneCards
- The similar expression profiles between "Inflamed" and "Non-inflamed" conditions for many markers suggest that "Non-inflamed" areas within an IBD patient (or a patient with similar conditions) might still exhibit a disease-associated fibroblast phenotype, distinct from truly "Healthy" individuals. This highlights the concept of a "field effect" or persistent alterations even in seemingly quiescent regions.
Clinical or Translational Implications
The identified condition-specific surfaceome markers in colon fibroblasts hold significant clinical and translational potential:
- Diagnostic and Prognostic Biomarkers: The differential expression of markers like HLA-DPA1/DRB1/G in healthy tissue versus GPNMB, AXL, FGFR1, and ITGAV in inflamed/non-inflamed tissue could serve as valuable diagnostic or prognostic biomarkers. For instance, detection of activated fibroblast markers in biopsy samples could help assess disease activity or predict fibrosis progression in conditions like IBD.
- Therapeutic Targets for Fibrosis and Inflammation: Given their surface localization, many of the upregulated markers in inflamed/non-inflamed fibroblasts are attractive therapeutic targets.
- FGFR1 and AXL: Inhibitors targeting FGFR1 or AXL pathways are already in clinical development for other diseases (e.g., cancer). Repurposing or developing novel agents against these receptors could mitigate pathogenic fibroblast activation and reduce inflammation or fibrosis in the colon.
- Integrins (ITGAV, ITGA1): Integrins are well-established targets for anti-fibrotic therapies. Targeting specific integrins on fibroblasts could modulate their adhesion, migration, and ECM deposition, thereby reducing fibrotic remodeling in chronic inflammatory conditions.
- GPNMB: As GPNMB is implicated in inflammation and tissue remodeling, targeting it could offer a strategy to modulate immune responses and reduce fibrosis.
- CDH11: Inhibiting CDH11 has shown promise in reducing fibrotic responses in other organs, suggesting its potential in colon fibrosis.
- Experimental Validation and Drug Development: These findings warrant further experimental validation using techniques such as flow cytometry, immunohistochemistry, or spatial transcriptomics on colon tissue sections to confirm protein expression and localization. The identified markers can then be prioritized for in vitro and in vivo studies to assess their functional roles in fibroblast activation and their suitability as drug targets in relevant preclinical models of colon inflammation and fibrosis.
13. T cell CD4+ Condition-Specific Surfaceome Markers in Colon
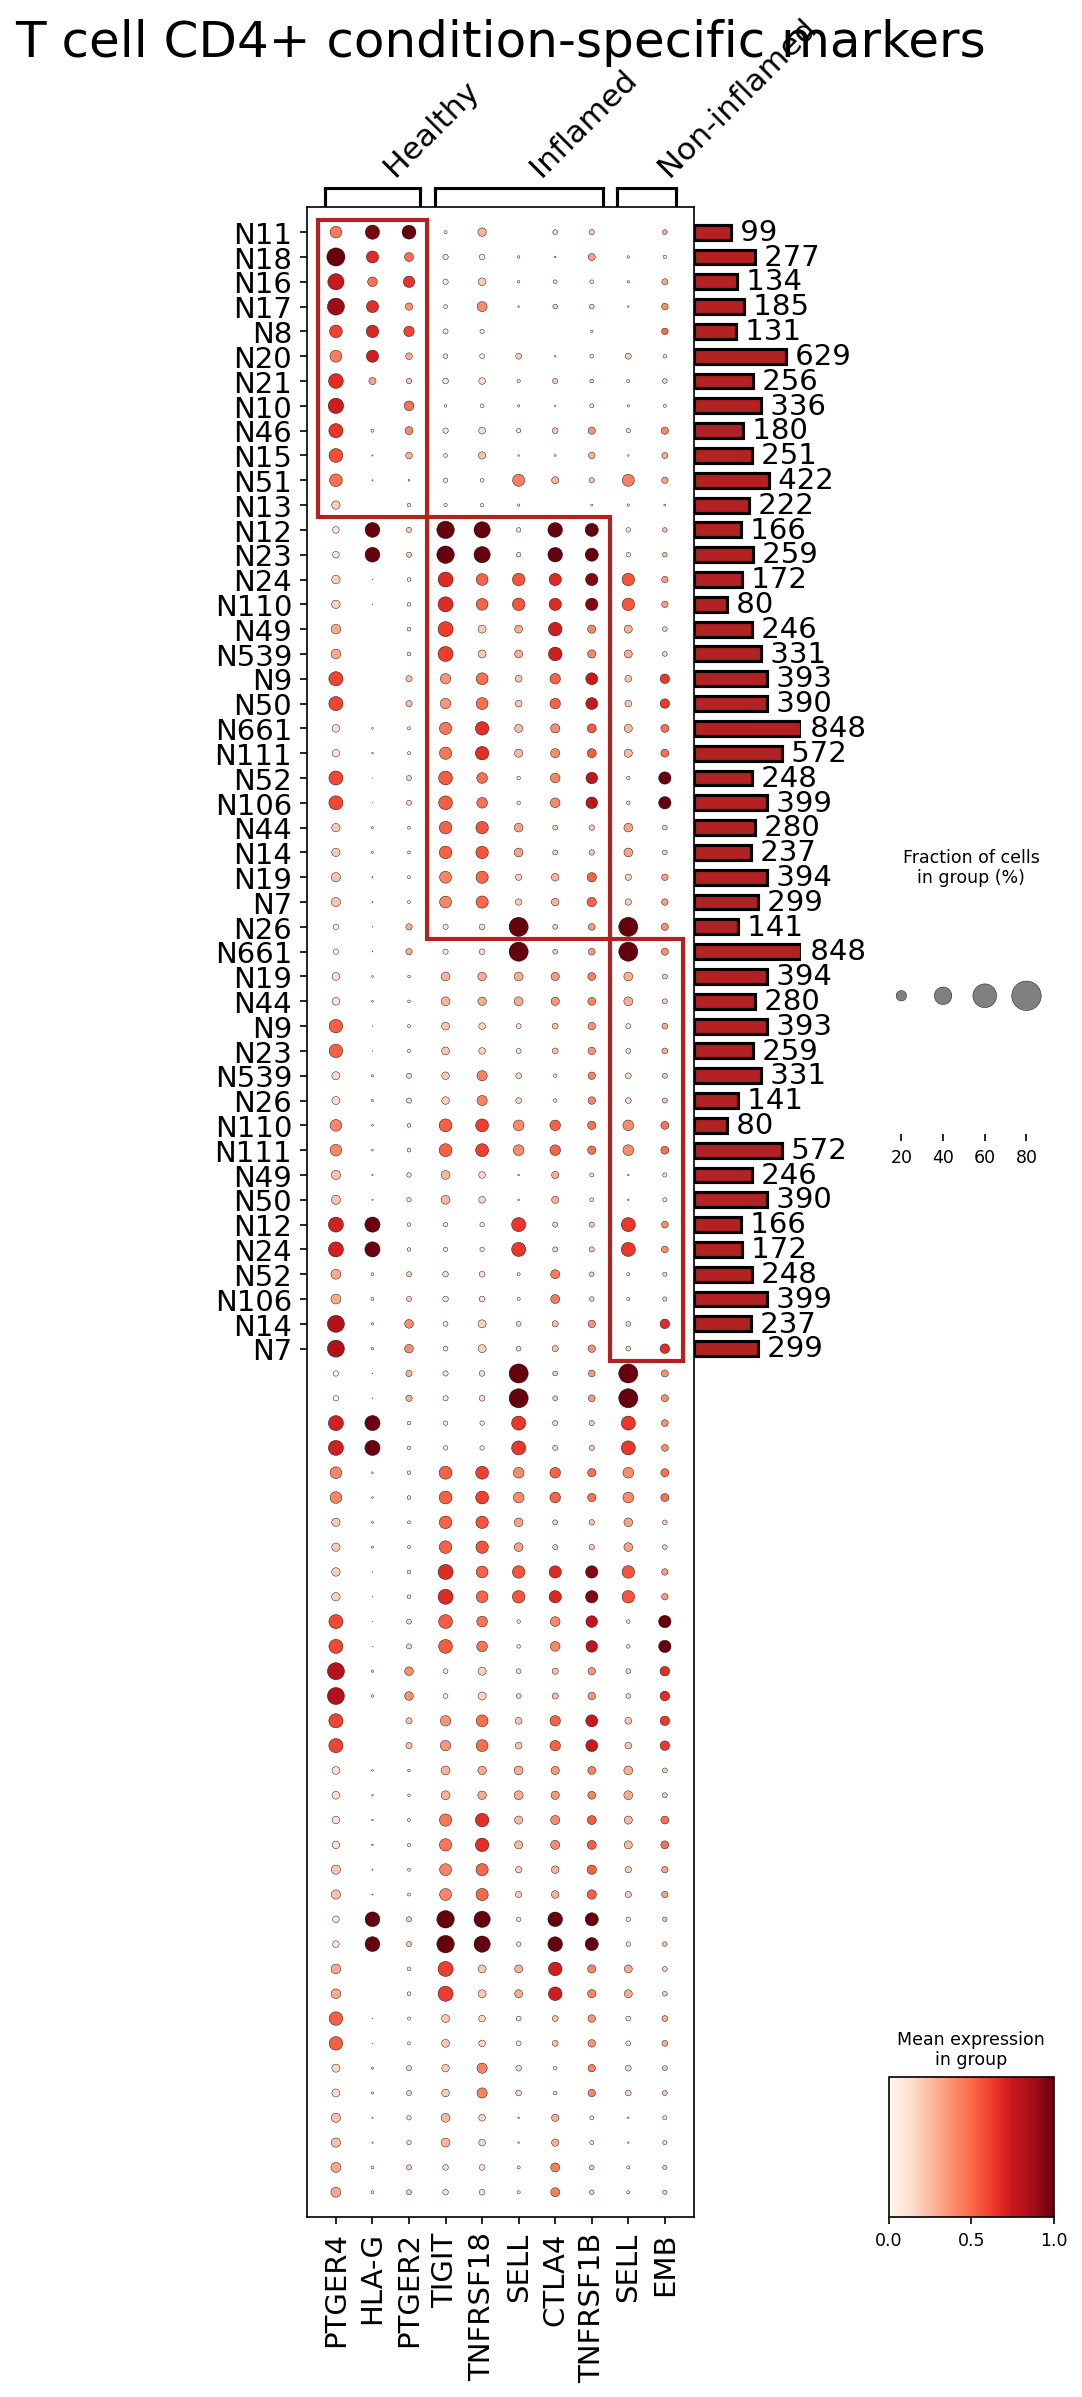
[Analysis Visualization Results]...
Analysis Overview
This analysis identifies and visualizes condition-specific surfaceome markers in CD4+ T cells from human colon tissue, comparing Healthy, Inflamed, and Non-inflamed conditions. The results are presented as a dot plot, where dot size reflects the fraction of cells expressing a given gene, and dot color indicates the mean expression level. This approach allows for the discovery of potential biomarkers that distinguish T cell states across different pathological conditions of the colon.
Visual Summary
The dot plot displays the expression patterns of several surfaceome markers across individual samples, grouped by their clinical condition (Healthy, Inflamed, Non-inflamed).
- Healthy Condition-Associated Markers: A distinct cluster of healthy samples (e.g., N11-N13, highlighted by the top red box) shows elevated expression and higher prevalence of PTGER4, HLA-G, and PTGER2. These genes exhibit low expression or are largely absent in most inflamed and non-inflamed samples.
- Inflamed Condition-Associated Markers: A prominent group of inflamed samples (e.g., N12-N19, highlighted by the middle red box) is characterized by high expression and prevalence of TIGIT, TNFRSF18 (GITR), SELL (CD62L), CTLA4, and TNFRSF1B (TNFR2). These markers are generally less pronounced in healthy samples.
- Non-inflamed Condition-Associated Markers: While sharing some markers with the inflamed group, a subset of non-inflamed samples (e.g., N26-N7, highlighted by the bottom red box) stands out with relatively higher expression of EMB. The overall expression pattern in non-inflamed samples appears somewhat intermediate or heterogeneous compared to the more distinct patterns in healthy and inflamed states.
- Overall Patterns: The plot clearly demonstrates shifts in surface marker profiles of CD4+ T cells depending on the inflammatory status of the colon, highlighting distinct immunophenotypes associated with health and disease.
Biological Interpretation
The observed condition-specific surfaceome markers provide critical insights into the functional states and roles of CD4+ T cells in the colon microenvironment during health and disease.
- Healthy Colon T cell Homeostasis and Tolerance: The enrichment of PTGER4, HLA-G, and PTGER2 in a subset of healthy colon CD4+ T cells suggests a role for prostaglandin E2 (PGE2) signaling and immune tolerance mechanisms.
- PTGER4 (EP4) and PTGER2 (EP2) are receptors for PGE2, a lipid mediator with diverse roles in inflammation and immune regulation. In the context of the healthy gut, PGE2 signaling via these receptors might contribute to maintaining intestinal homeostasis and regulating T cell differentiation towards tolerogenic phenotypes PubMed search: PGE2 T cell colon tolerance.
- HLA-G is a non-classical MHC class I molecule known for its immunosuppressive properties, often expressed by tolerogenic cells to suppress immune responses and promote immune tolerance GeneCards: HLA-G. Its presence in healthy CD4+ T cells underscores the critical need for immune regulation in the gut to prevent aberrant responses to commensal microbiota.
- Inflammation-Associated T cell Activation and Regulation: In the inflamed colon, CD4+ T cells exhibit a distinct signature characterized by a combination of immune checkpoint molecules and TNF receptor superfamily members, reflecting an active but regulated immune response.
- TIGIT and CTLA4 are crucial immune checkpoint receptors that suppress T cell activation and proliferation GeneCards: TIGIT GeneCards: CTLA4. Their upregulation in inflamed tissues indicates an attempt by the immune system to dampen excessive inflammation and prevent tissue damage, suggesting that these CD4+ T cells are actively involved in ongoing immune responses and their subsequent regulation.
- TNFRSF18 (GITR) is a co-stimulatory receptor on T cells that enhances T cell activation, proliferation, and survival GeneCards: TNFRSF18. Its co-expression with inhibitory checkpoints suggests a complex interplay of activation and dampening signals to fine-tune T cell responses during inflammation.
- TNFRSF1B (TNFR2) is a receptor for TNF, a key pro-inflammatory cytokine. TNFR2 signaling can promote T cell survival and proliferation, contributing to the persistence of immune responses in chronic inflammation GeneCards: TNFRSF1B.
- The prominent expression of SELL (CD62L) in inflamed samples is notable. While CD62L is typically shed upon T cell activation to allow tissue extravasation, its presence could indicate a specific subset of central memory T cells or T regulatory cells that retain this homing receptor, or perhaps a specific population involved in recirculation rather than immediate effector function in the inflamed mucosa.
- Non-inflamed and Heterogeneous Phenotypes: The expression profile in non-inflamed samples is less uniform, suggesting potential sub-states or early/resolving inflammatory processes. The unique expression of EMB in some non-inflamed samples is an interesting finding. As "Embryonic protein," its function in adult T cells and its specific relevance to non-inflamed colon are not well-established and warrant further investigation GeneCards: EMB.
Clinical or Translational Implications
The identified condition-specific surface markers hold significant potential for clinical applications, particularly in diagnostics, prognostics, and therapeutic development for colon inflammatory conditions.
- Biomarkers for Disease Activity and Stratification: The differential expression of surface markers such as TIGIT, CTLA4, TNFRSF18, and TNFRSF1B in CD4+ T cells could serve as valuable biomarkers to distinguish between healthy, inflamed, and non-inflamed states in the colon. These markers could potentially be measured on immune cells from colon biopsies or even peripheral blood (if tissue-specific populations are reflected) to monitor disease activity, assess treatment response, or stratify patients based on their immune profiles.
- Potential Therapeutic Targets:
- Immune Checkpoints (CTLA4, TIGIT): The upregulation of these inhibitory receptors in inflamed CD4+ T cells highlights their critical role in modulating immune responses during inflammation. While checkpoint *blockade* is a strategy in cancer immunotherapy to enhance anti-tumor immunity, in inflammatory bowel diseases, *agonism* of these pathways or enhancement of their function could be explored as a strategy to suppress detrimental T cell overactivity and restore immune tolerance.
- TNFRSF18 (GITR): Given its role in co-stimulation, modulating GITR activity (e.g., with specific agonists or antagonists) could offer a pathway to finely tune T cell responses in inflammatory conditions, potentially leading to novel immunomodulatory therapies.
- Prostaglandin Receptors (PTGER4, PTGER2): The involvement of PGE2 signaling in healthy colon T cell states suggests that targeting these receptors (e.g., with selective inhibitors or modulators) could be a strategy to prevent inflammation or restore immune homeostasis.
- Experimental Validation and Deeper Characterization: Further experimental validation, potentially using flow cytometry or immunohistochemistry on tissue samples, would be crucial to confirm the surface expression and cell-type specificity of these markers. Investigating the functional consequences of modulating these pathways in relevant *in vitro* and *in vivo* models of colon inflammation would elucidate their precise roles and therapeutic potential. The role of EMB in T cells, especially in the context of non-inflamed colon, merits dedicated research to uncover its function and potential as a novel marker or target.
14. Differential Expression of Cell Cycle-Related Genes in Colonic B Cells Across Conditions
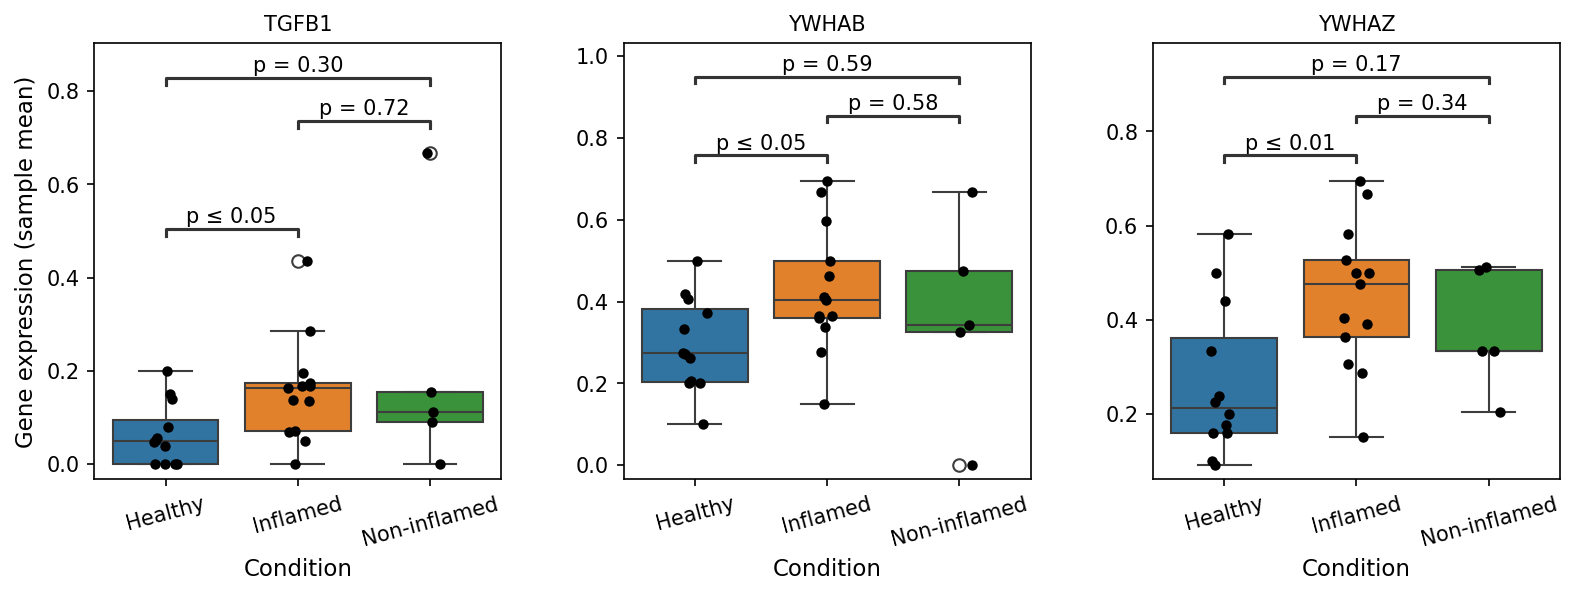
[Analysis Visualization Results]...
Analysis Overview
This analysis investigates the expression of a predefined list of cell cycle pathway related genes within B cells (identified as celltype_minor: B cell) in human colon tissue. The goal was to identify genes with statistically significant expression differences when comparing 'Inflamed' and 'Non-inflamed' conditions against a 'Healthy' reference, focusing on a maximum of 24 genes for visualization. The analysis utilized single-cell RNA-seq data and performed differential expression testing with a p-value cutoff of 0.1 and a log2 Fold Change cutoff of 0.1. The visualization displays boxplots for genes that met these significance criteria, showing gene expression (sample mean) across the three conditions: Healthy, Inflamed, and Non-inflamed.
Visual Summary
The visualization presents boxplots for three specific genes: TGFB1, YWHAB, and YWHAZ. These were the only genes from the comprehensive list of cell cycle-related genes that showed statistically significant differences based on the defined cutoffs when compared to the Healthy condition in B cells.
- TGFB1 (Transforming Growth Factor Beta 1):
- Expression is significantly higher in B cells from the 'Inflamed' colon compared to 'Healthy' colon (p ≤ 0.05).
- No significant difference was observed between 'Healthy' and 'Non-inflamed' conditions (p = 0.30), nor between 'Inflamed' and 'Non-inflamed' conditions (p = 0.72).
- The median expression in 'Inflamed' B cells is noticeably elevated compared to 'Healthy' B cells.
- YWHAB (Tyrosine 3-Monooxygenase/Tryptophan 5-Monooxygenase Activation Protein, Beta Polypeptide):
- Expression is significantly higher in B cells from the 'Inflamed' colon compared to 'Healthy' colon (p ≤ 0.05).
- No significant difference was observed between 'Healthy' and 'Non-inflamed' conditions (p = 0.59), nor between 'Inflamed' and 'Non-inflamed' conditions (p = 0.58).
- The median expression for 'Inflamed' B cells is higher than for 'Healthy' B cells.
- YWHAZ (Tyrosine 3-Monooxygenase/Tryptophan 5-Monooxygenase Activation Protein, Zeta Polypeptide):
- Expression is significantly higher in B cells from the 'Inflamed' colon compared to 'Healthy' colon (p ≤ 0.01), indicating a strong statistical difference.
- No significant difference was observed between 'Healthy' and 'Non-inflamed' conditions (p = 0.17), nor between 'Inflamed' and 'Non-inflamed' conditions (p = 0.34).
- Similar to YWHAB, the median expression for 'Inflamed' B cells is notably elevated compared to 'Healthy' B cells.
In summary, all three genes (TGFB1, YWHAB, YWHAZ) show a consistent pattern of upregulation in B cells from 'Inflamed' colon tissue when compared to 'Healthy' colon tissue. There were no statistically significant differences observed between the 'Healthy' and 'Non-inflamed' conditions, nor between 'Inflamed' and 'Non-inflamed' conditions for these genes based on the provided p-values.
Biological Interpretation
The observed upregulation of TGFB1, YWHAB, and YWHAZ in B cells specifically within the 'Inflamed' colon tissue suggests significant shifts in B cell biology in response to inflammation.
- TGFB1 Upregulation and B Cell Function in Inflammation:
- TGFB1 is a pleiotropic cytokine with diverse roles in immunity, cell proliferation, differentiation, and tissue repair. In the context of inflammation, particularly in the colon (which can include conditions like Inflammatory Bowel Disease), TGFB1 is a critical regulator of immune responses.
- In B cells, TGFB1 can influence proliferation, survival, and differentiation. It is known to promote IgA class switching, which is crucial for mucosal immunity in the gut PubMed search: TGFB1 B cell IgA intestine. It can also exert immunosuppressive effects, limiting B cell activation and antibody production in some contexts, or promote B cell survival and differentiation in others.
- The elevated TGFB1 expression in inflamed B cells could indicate an activated or altered state of B cells participating in the inflammatory response, potentially driving specific differentiation pathways (e.g., towards IgA-producing plasma cells) or attempting to modulate inflammation.
- YWHAB and YWHAZ Upregulation and Cell Cycle/Stress Response:
- YWHAB and YWHAZ are members of the 14-3-3 protein family, which are highly conserved regulatory proteins involved in a wide array of cellular processes, including cell cycle control, signal transduction, apoptosis, and cellular stress responses GeneCards: YWHAB and GeneCards: YWHAZ.
- 14-3-3 proteins function as molecular chaperones, binding to phosphorylated proteins to modulate their activity, localization, or stability. In cell cycle regulation, they interact with key components such as CDC25 phosphatases, Wee1 kinase, and p53, thereby influencing cell cycle checkpoints (e.g., G2/M transition) and DNA damage responses.
- Their upregulation in inflamed B cells suggests a heightened level of cellular activity, potentially increased proliferative signals, or a robust cellular response to the stress induced by inflammation. Activated B cells in an inflamed environment often undergo clonal expansion and differentiation, processes that require tight cell cycle control and efficient signaling. The observed increase in YWHAB and YWHAZ could facilitate these processes or mediate protective responses against cellular damage.
The fact that only these three genes, from a broader list of cell cycle regulators, showed significant changes in B cells in the inflamed colon highlights their specific relevance in this particular immune cell type and disease context. This suggests a targeted modulation of certain regulatory rather than a widespread activation of all cell cycle machinery.
Clinical or Translational Implications
The differential expression of TGFB1, YWHAB, and YWHAZ in B cells within the inflamed colon has several potential clinical and translational implications:
- Biomarkers of Disease Activity: Upregulation of these genes in B cells could serve as potential single-cell biomarkers reflecting B cell activation or altered functional states during colonic inflammation. Monitoring their expression might offer insights into disease activity or response to therapy in inflammatory bowel diseases (IBD).
- Therapeutic Targets: Given their roles in cell signaling, cell cycle control, and immune modulation, TGFB1, YWHAB, and YWHAZ pathways could represent novel therapeutic targets to modulate B cell function in inflammatory conditions. For instance, modulating TGFB1 signaling in B cells might influence IgA production or suppress pathogenic B cell responses. Similarly, targeting 14-3-3 proteins could impact B cell proliferation or survival in an inflammatory setting.
- Understanding Pathogenesis: The findings contribute to a deeper understanding of B cell pathophysiology in colon inflammation. Dysregulated B cell activity is increasingly recognized in the pathogenesis of IBD, and understanding the molecular changes within these cells, such as alterations in cell cycle-related gene expression, can inform disease mechanisms.
- Cell-State Shifts: The distinct expression profiles suggest a functional shift in B cells from healthy to inflamed states, indicative of their active participation in the inflammatory process. Further research could explore how these gene expression changes correlate with specific B cell subsets (e.g., plasma cells, regulatory B cells) and their contributions to the inflammatory or reparative responses in the colon.
15. Gene Ontology (GSA) Analysis of Intestinal Epithelial Cells in Colon Health and Disease
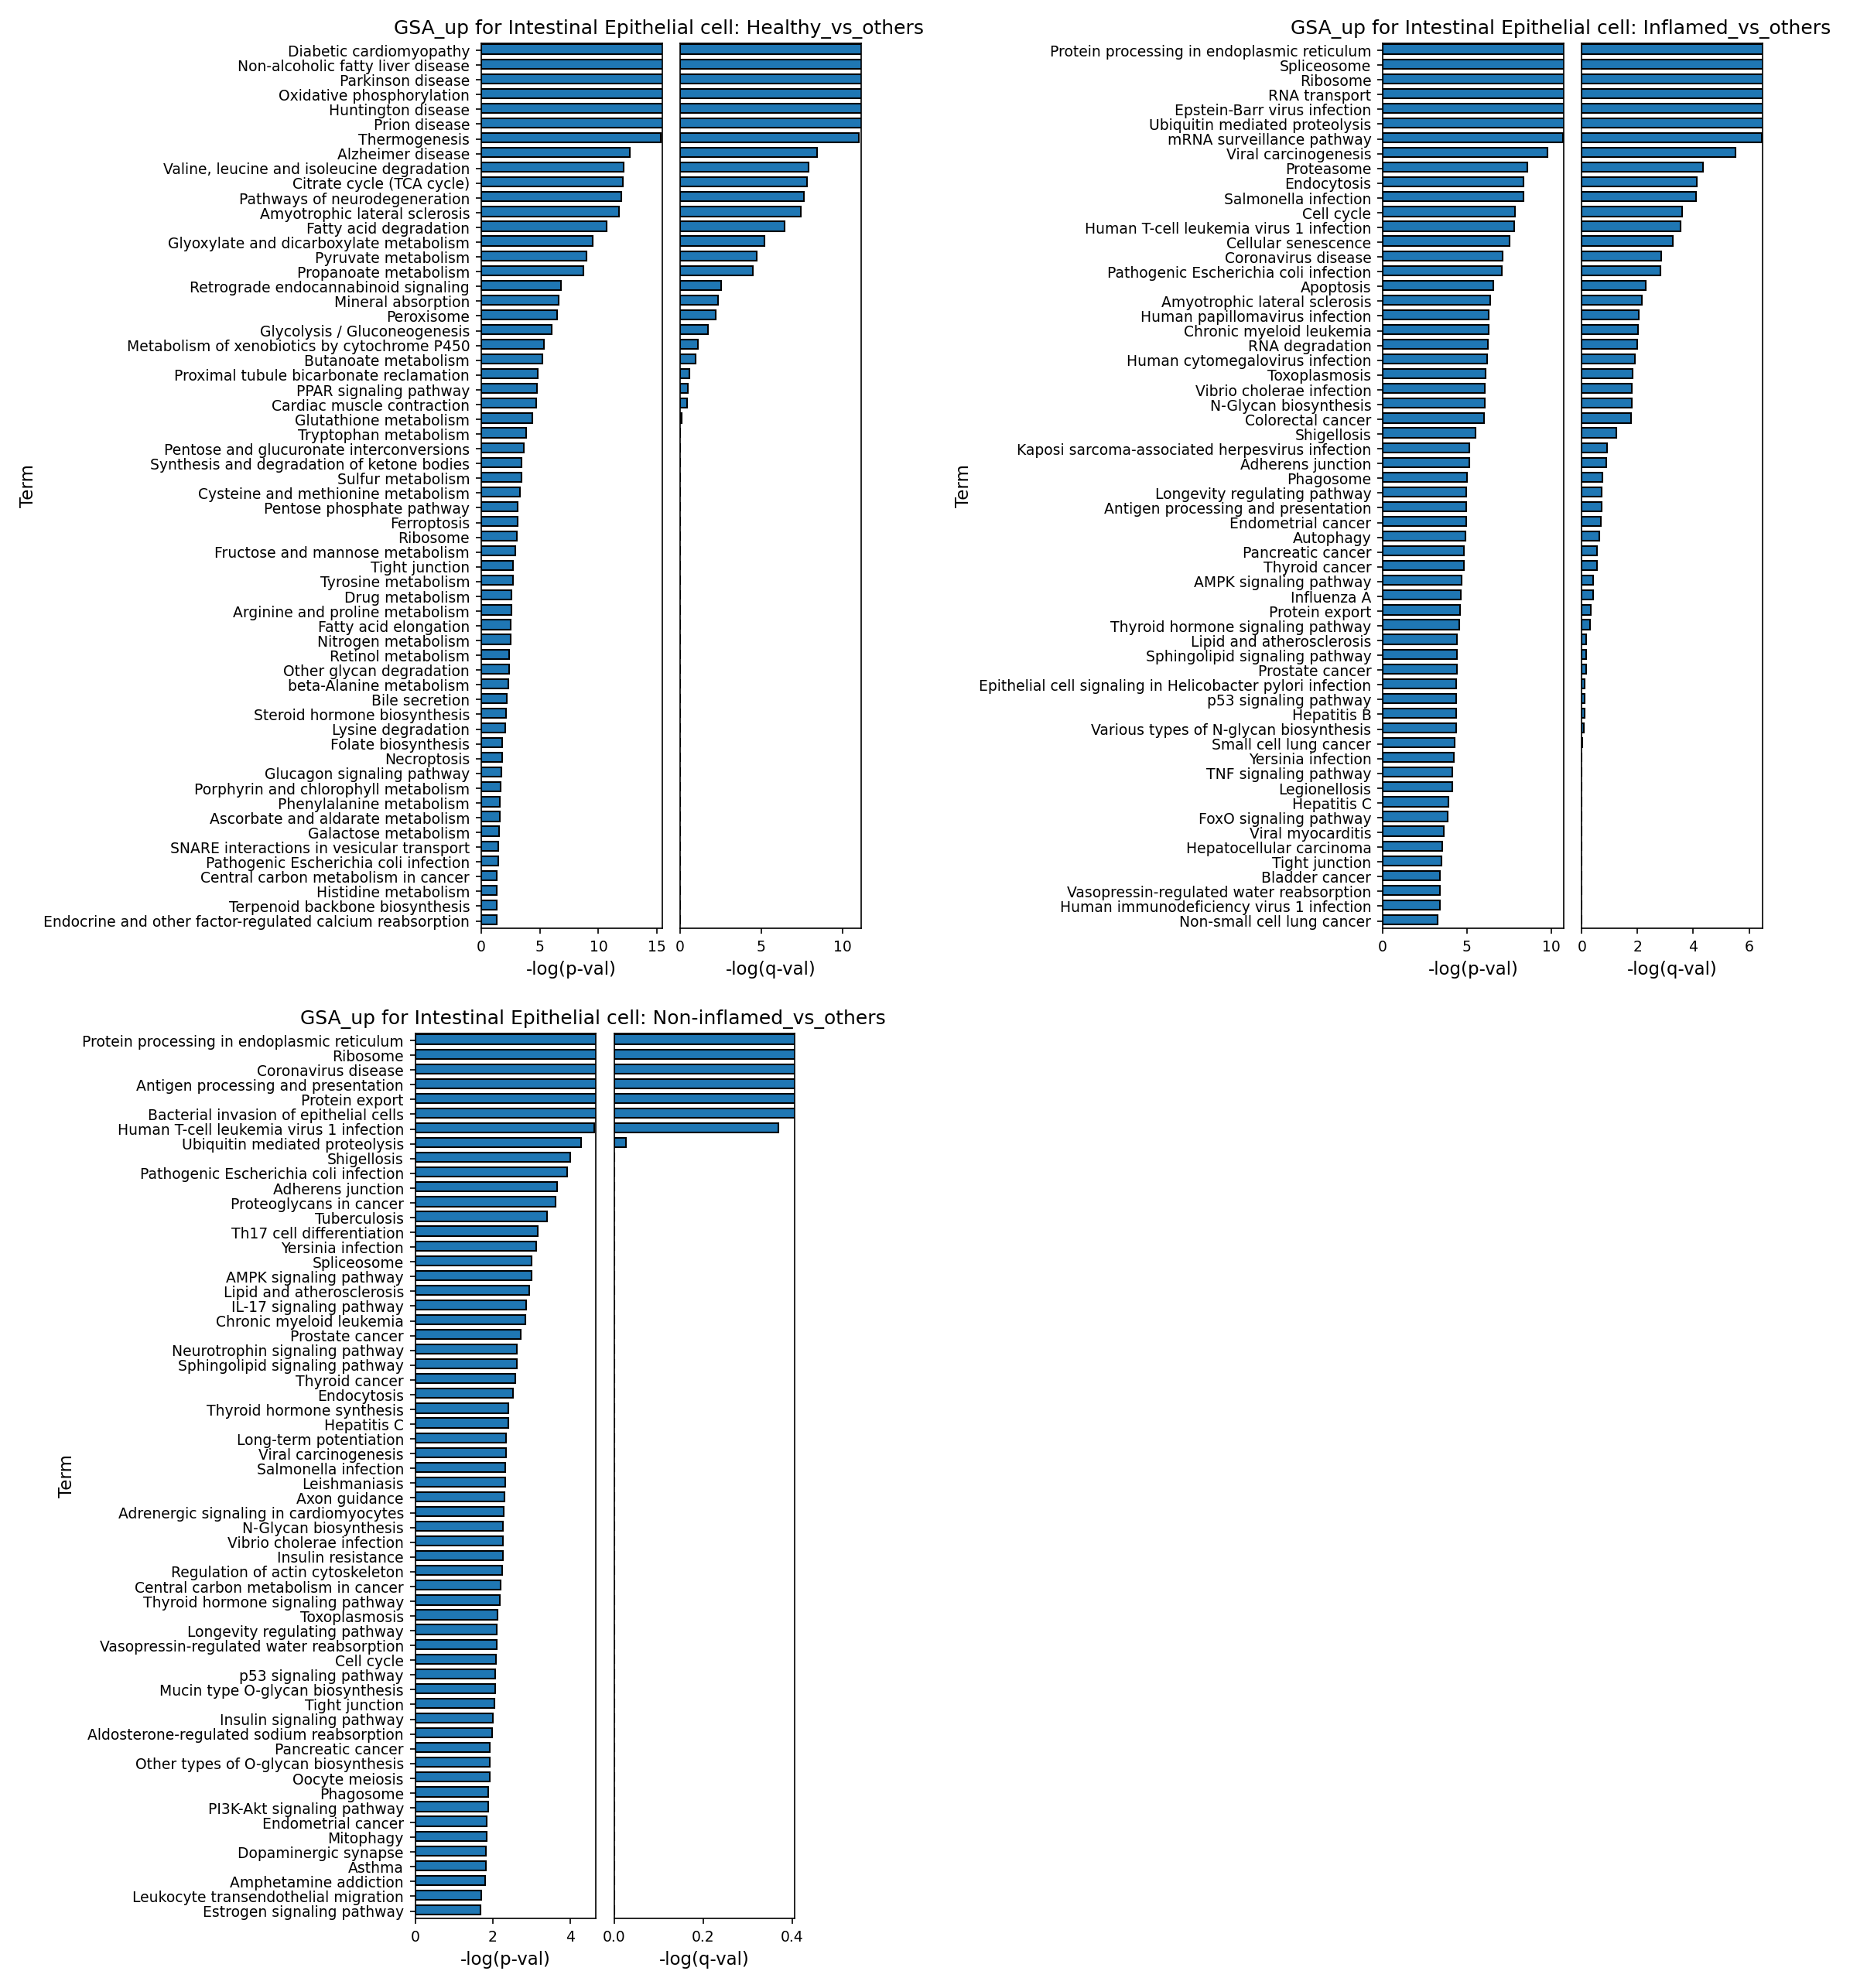
[Analysis Visualization Results]...
Analysis Overview
This analysis investigates the enriched Gene Ontology (GO) terms in Intestinal Epithelial cells across different colonic conditions: Healthy, Inflamed, and Non-inflamed. The Gene Set Association (GSA) analysis was performed by comparing each condition against all other cells in the dataset ('vs_others') to identify pathways that are significantly upregulated (GSA_up) in that specific condition. The results are presented as bar plots, showing the -log(p-val) and -log(q-val) for the top enriched terms. This helps us understand the distinct biological processes active in intestinal epithelial cells in varying states of colon health and disease.
Visual Summary
The provided bar plots illustrate the top enriched GO terms for Intestinal Epithelial cells in three distinct comparisons:
- Healthy_vs_others: This plot shows pathways relatively upregulated in healthy intestinal epithelial cells. Prominent terms include various metabolic pathways such as "Oxidative phosphorylation," "Citrate cycle (TCA cycle)," and "Valine, leucine and isoleucine degradation," alongside several neurodegenerative disease pathways like "Diabetic cardiomyopathy," "Non-alcoholic fatty liver disease," "Parkinson disease," and "Alzheimer disease." The high significance of these metabolic terms suggests a robust baseline metabolic activity in healthy epithelial cells.
- Inflamed_vs_others: In contrast, the inflamed state exhibits a strong enrichment for pathways indicative of cellular stress, infection response, and altered cell fate. Highly significant terms include "Protein processing in endoplasmic reticulum," "Spliceosome," "RNA transport," "Ribosome," "Ubiquitin mediated proteolysis," and pathways related to various viral and bacterial infections such as "Epstein-Barr virus infection," "Salmonella infection," "Pathogenic Escherichia coli infection," and "Coronavirus disease." Additionally, terms like "Cell Cycle," "Cellular senescence," and "Apoptosis" suggest significant cellular perturbation and turnover.
- Non-inflamed_vs_others: This plot shows an intermediate or distinct profile compared to the Healthy and Inflamed states. It shares some stress-related pathways with the inflamed condition, such as "Protein processing in endoplasmic reticulum," "Coronavirus disease," and "Ubiquitin mediated proteolysis." Notably, it also highlights immune-related terms like "Antigen processing and presentation," "Bacterial invasion of epithelial cells," and "Th17 cell differentiation." Pathways related to structural integrity, such as "Adherens junction," are also enriched. The overall significance of the enriched terms appears lower than in the "Inflamed" state, suggesting a milder or more heterogeneous cellular response.
Biological Interpretation
The distinct Gene Ontology profiles observed in Intestinal Epithelial cells across the Healthy, Inflamed, and Non-inflamed conditions provide crucial insights into their functional adaptations during colon disease.
- Healthy Intestinal Epithelial Cells: A Metabolically Active State
In the healthy colon, intestinal epithelial cells are highly metabolically active, responsible for nutrient absorption and maintaining barrier integrity. The enrichment of pathways like "Oxidative phosphorylation," "Citrate cycle (TCA cycle)," and "Valine, leucine and isoleucine degradation" reflects their continuous high energy demands and robust metabolic machinery. The appearance of "Diabetic cardiomyopathy" and other neurodegenerative pathways might seem unusual but often indicates that the underlying metabolic or cellular stress response pathways (e.g., mitochondrial function, protein quality control, lipid metabolism) are fundamental processes across various cell types, and their dysregulation is implicated in these diseases. In healthy colon epithelial cells, these core metabolic processes are likely operating optimally [PubMed search: intestinal epithelial cell metabolism].
- Inflamed Intestinal Epithelial Cells: Under Severe Stress and Host-Pathogen Interaction
During inflammation, intestinal epithelial cells face significant challenges, including direct exposure to pathogens and inflammatory mediators. The strong enrichment for "Protein processing in endoplasmic reticulum," "Spliceosome," "RNA transport," "Ribosome," and "Ubiquitin mediated proteolysis" indicates a substantial activation of the cellular stress response, particularly ER stress and protein quality control mechanisms. This is a common cellular response to inflammation and infection, aiming to manage misfolded proteins and maintain cellular homeostasis under duress [PubMed search: ER stress inflammation gut].
Furthermore, the presence of numerous infection-related pathways (e.g., "Epstein-Barr virus infection," "Salmonella infection," "Pathogenic Escherichia coli infection") suggests that in the inflamed state, epithelial cells are actively involved in host defense, recognizing and responding to microbial challenges. The upregulation of "Cell Cycle," "Cellular senescence," and "Apoptosis" reflects the dynamic nature of the inflamed epithelium, where cells may be undergoing increased turnover, attempting repair, or being eliminated if damaged [PubMed search: epithelial cell apoptosis inflammation].
- Non-inflamed Intestinal Epithelial Cells: Early or Subclinical Immunological Engagement
The "Non-inflamed" state, while not overtly inflamed, shows signs of an active but potentially subclinical immune response and cellular stress. Similar to the inflamed state, "Protein processing in endoplasmic reticulum" and certain infection pathways are enriched, suggesting ongoing cellular stress and pathogen encounter. Crucially, the enrichment of "Antigen processing and presentation" and "Bacterial invasion of epithelial cells" highlights the active role of epithelial cells in innate immunity and their capacity to interact with the immune system even in the absence of overt inflammation [PubMed search: intestinal epithelial cell innate immunity]. The involvement of "Th17 cell differentiation" further underscores this, as epithelial cells can influence T cell polarization. The enrichment of "Adherens junction" could indicate alterations in epithelial barrier integrity or ongoing repair processes, which are critical in maintaining gut health and are often compromised in early stages of gut disorders [PubMed search: adherens junction intestinal epithelial barrier]. This suggests that epithelial cells in "Non-inflamed" conditions are not truly quiescent but are actively sensing and responding to their environment, possibly acting as sentinels or attempting to restore homeostasis.
Clinical or Translational Implications
These findings have significant clinical implications for understanding inflammatory bowel diseases (IBD) and other colonic inflammatory conditions.
- Biomarkers of Disease Progression: The distinct pathway enrichments in inflamed vs. non-inflamed epithelial cells could provide novel insights into disease mechanisms and potential biomarkers for different stages of inflammation. For instance, the robust ER stress and extensive pathogen response in inflamed cells could serve as indicators of active disease, while antigen processing and subtle barrier alterations in non-inflamed cells might reflect a pre-inflammatory or resolving state.
- Therapeutic Targets: Targeting specific pathways identified in the inflamed state, such as ER stress response components or specific host-pathogen interaction pathways, could offer new therapeutic strategies to mitigate inflammation and epithelial damage. Conversely, supporting the metabolic health of epithelial cells, as observed in the healthy state, could be beneficial for maintaining gut barrier function and overall health.
- Understanding "Non-inflamed" Disease: The active immune and stress responses in "Non-inflamed" epithelial cells emphasize that macroscopically non-inflamed areas in disease contexts are not necessarily healthy at a cellular level. This highlights the importance of cellular-level analysis to detect subtle pathological changes that could precede overt inflammation or indicate persistent subclinical disease activity, guiding treatment decisions or disease monitoring.
16. Colon Cell Type-Specific Gene Set Enrichment Analysis Across Inflammatory Conditions
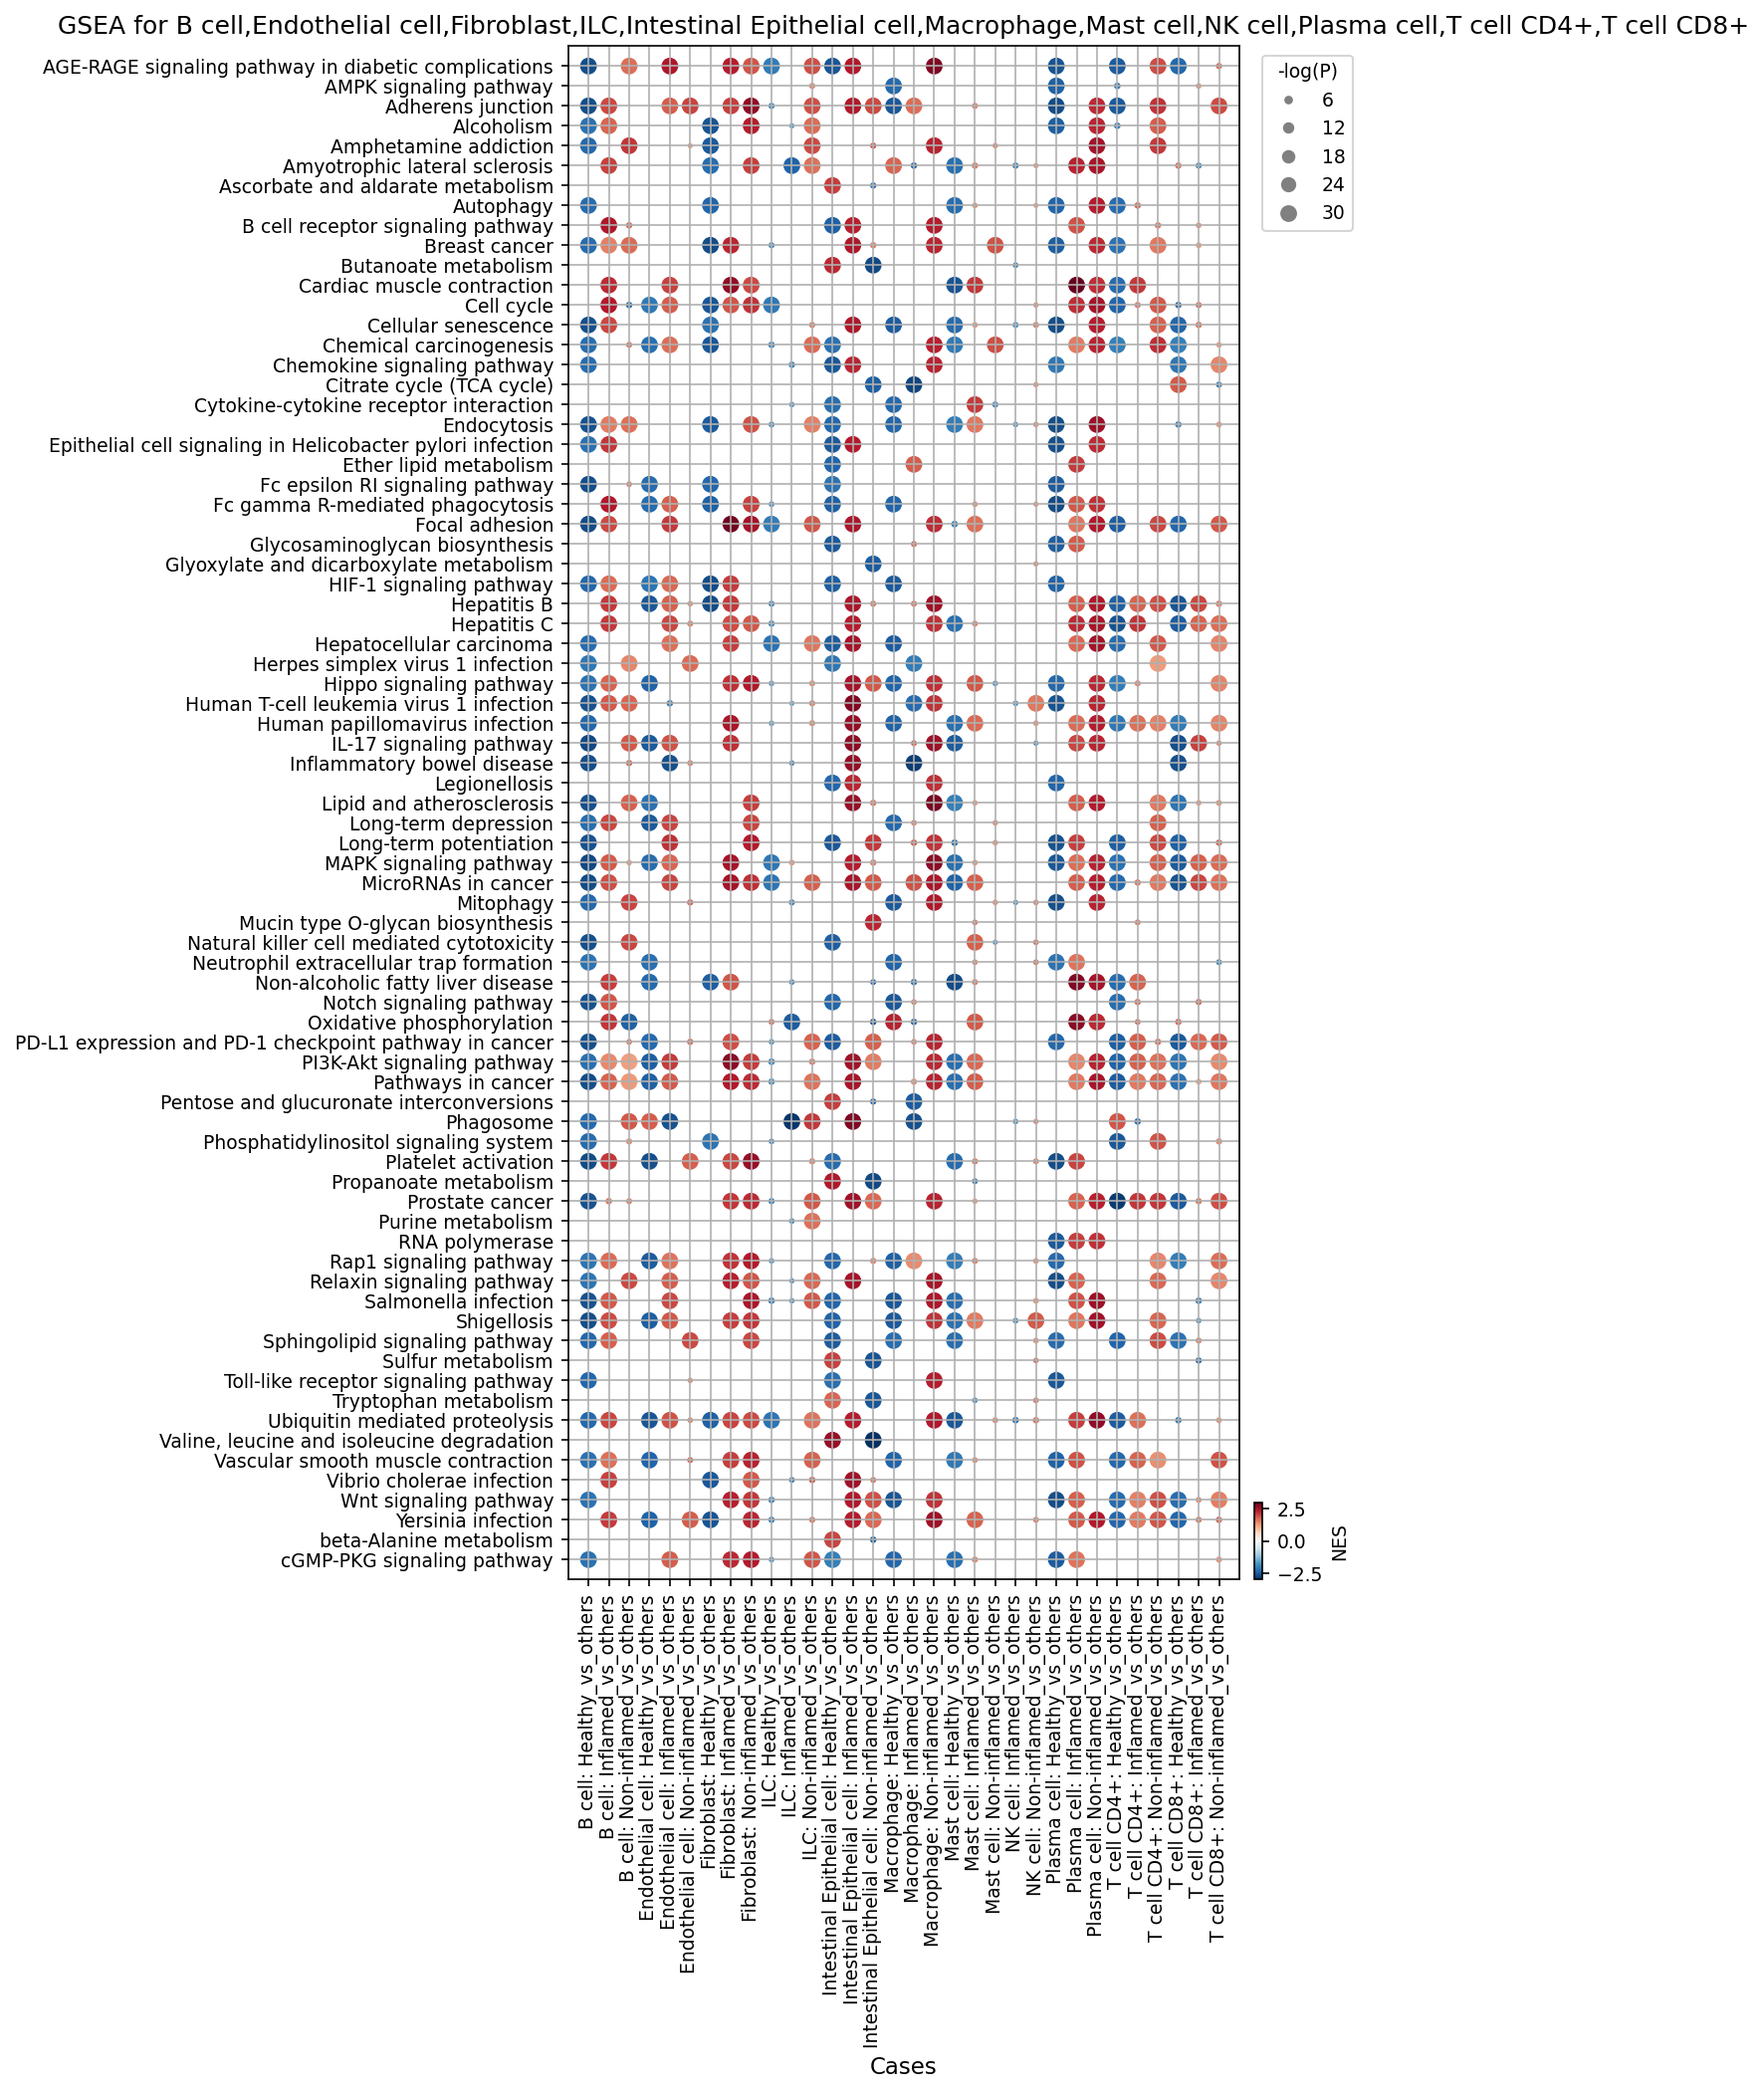
[Analysis Visualization Results]...
Analysis Overview
This analysis presents Gene Set Enrichment Analysis (GSEA) results for major cell types found in the human colon, comparing gene expression profiles across different conditions: Healthy, Inflamed, and Non-inflamed. The dot plot visualizes the Normalized Enrichment Score (NES) and statistical significance (-log(p-value)) for 80 KEGG pathways. Each column represents a comparison of a specific cell type in one condition against all other conditions combined (e.g., "B cell: Healthy_vs_others" compares B cell expression in the Healthy condition to B cell expression in the Inflamed and Non-inflamed conditions). Red dots indicate positive NES (pathway generally upregulated in the 'test' condition), while blue dots indicate negative NES (pathway generally downregulated). The size of the dot reflects the statistical significance, with larger dots indicating smaller p-values (higher -log(p-value)).
Visual Summary
The dot plot reveals widespread and distinct pathway enrichment patterns across different cell types and conditions.
- Inflammation-Associated Activity: A prominent feature is the high prevalence of red dots (positive NES) in the 'Inflamed_vs_others' comparisons across almost all cell types, particularly for immune-related and cell proliferation pathways. This indicates a robust inflammatory response at the transcriptomic level.
- Non-Inflamed Disease Signature: The 'Non-inflamed_vs_others' columns also show significant pathway enrichments, often displaying patterns that are similar to but generally less intense than those in the 'Inflamed_vs_others' group, or exhibiting unique enrichments. This suggests molecular changes are present even in macroscopically non-inflamed diseased tissue.
- Healthy State Patterns: In contrast, 'Healthy_vs_others' columns often display blue dots (negative NES) for many inflammatory pathways, indicating their downregulation in healthy tissue compared to diseased states. Conversely, some pathways show positive NES in healthy tissue, reflecting homeostatic processes.
- Cell Type-Specific Responses: Distinct patterns of pathway activity are observed for different cell types, highlighting their unique roles in the colon's response to disease. For instance, Intestinal Epithelial cells, Macrophages, and T cells show strong activation of pathways directly linked to inflammation and host defense.
Biological Interpretation
Global Inflammatory and Immune Activation
A consistent and strong signal across multiple immune cells (Macrophages, T cells CD4+, T cells CD8+, B cells, ILCs) and even resident cells (Intestinal Epithelial cells, Fibroblasts, Endothelial cells) in the 'Inflamed_vs_others' condition is the enrichment of key inflammatory and immune-related pathways.
- Immune Signaling Cascades: Pathways such as Chemokine signaling pathway, Cytokine-cytokine receptor interaction, and Toll-like receptor signaling pathway are highly enriched in the inflamed state. This signifies robust immune cell communication, recruitment, and activation, which are hallmarks of inflammation in the colon.
- IL-17 Signaling: The IL-17 signaling pathway shows strong enrichment in T cells, Macrophages, Intestinal Epithelial cells, and Fibroblasts in inflamed tissue. IL-17 is a critical pro-inflammatory cytokine deeply implicated in the pathogenesis of inflammatory bowel disease (IBD) [1].
- Infection Response: Several infection-related pathways like Salmonella infection, Shigellosis, and Yersinia infection are enriched in inflamed Intestinal Epithelial cells and Macrophages, suggesting an active host response to microbial challenges, a common feature of gut inflammation.
Distinct Signatures in Non-Inflamed Diseased Tissue
The 'Non-inflamed_vs_others' comparisons reveal significant molecular perturbations even in the absence of overt inflammation, suggesting subclinical disease activity or a state of predisposition.
- Basal Inflammatory State: The Inflammatory bowel disease pathway is enriched in 'Non-inflamed_vs_others' for Macrophages, T cells, Intestinal Epithelial cells, and Fibroblasts, albeit generally with lower NES and significance than in the inflamed state. This implies that core IBD-associated processes are initiated or maintained even in macroscopically non-inflamed regions.
- Cellular Proliferation and Stress: Pathways like Cell cycle and HIF-1 signaling pathway are enriched in Non-inflamed Intestinal Epithelial cells and Fibroblasts. This may indicate ongoing tissue repair attempts, compensatory proliferation, or adaptation to microenvironmental stress (e.g., hypoxia) preceding overt inflammation [2].
Cell Type-Specific Contributions to Colon Pathobiology
- Intestinal Epithelial Cells (IECs): In addition to inflammatory pathways, IECs in the inflamed state show enrichment in Adherens junction and Focal adhesion, suggesting dynamic changes in cell-cell contacts and cell-ECM interactions, crucial for barrier integrity and repair. The enrichment of Pathways in cancer in both inflamed and non-inflamed IECs highlights the link between chronic inflammation and increased risk of colorectal cancer [3].
- Macrophages: These cells demonstrate robust activation of phagocytic (e.g., Phagosome) and metabolic reprogramming pathways (e.g., enrichment of Glycolysis / Gluconeogenesis and depletion of Oxidative phosphorylation in inflamed conditions). This metabolic shift towards aerobic glycolysis (Warburg effect) is characteristic of activated M1-like macrophages fueling their pro-inflammatory functions [4].
- T Cells (CD4+ and CD8+): Both T cell subsets show strong activation of proliferation (Cell cycle), immune checkpoint (PD-L1 expression and PD-1 checkpoint pathway in cancer), and metabolic reprogramming pathways (glycolysis enrichment, oxidative phosphorylation depletion) in the inflamed colon. This reflects their activated state, proliferation, and attempts at immune regulation within the inflammatory microenvironment.
- Fibroblasts: Colon fibroblasts exhibit enriched Focal adhesion, HIF-1 signaling, and PI3K-Akt signaling pathway in inflamed and non-inflamed conditions. This underscores their active role in extracellular matrix remodeling, angiogenesis, and perpetuating inflammation through cytokine/chemokine secretion.
Clinical or Translational Implications
The distinct pathway enrichments identified through this GSEA analysis provide valuable insights for understanding the molecular mechanisms driving colon inflammation and disease progression.
- Biomarker Discovery: Pathways consistently enriched in the 'Non-inflamed_vs_others' state (e.g., specific aspects of the Inflammatory bowel disease pathway, Cell cycle, or HIF-1 signaling) could serve as potential early biomarkers for disease activity or risk stratification in seemingly quiescent regions of the colon.
- Therapeutic Targets: The widespread activation of pathways like Chemokine signaling, Cytokine-cytokine receptor interaction, IL-17 signaling pathway, and PI3K-Akt signaling pathway in inflamed tissues highlights several potential therapeutic targets for modulating inflammatory responses. Inhibitors targeting these pathways could be evaluated for their efficacy in controlling colon inflammation.
- Cancer Risk Stratification: The consistent enrichment of Pathways in cancer in both inflamed and non-inflamed Intestinal Epithelial cells and Fibroblasts reinforces the long-standing link between chronic inflammation and colon cancer. Understanding these specific cancer-related pathways could lead to improved strategies for surveillance and early intervention in patients with chronic inflammatory conditions of the colon.
- Metabolic Reprogramming: The observed metabolic shifts in immune cells, particularly the Warburg effect in macrophages and T cells, suggest that targeting metabolic pathways could be a novel approach to dampen pathogenic immune responses in the inflamed colon.
References
- IL-17 signaling pathway in inflammatory bowel disease: https://pubmed.ncbi.nlm.nih.gov/?term=IL-17+signaling+inflammatory+bowel+disease
- HIF-1 signaling pathway in inflammation and hypoxia: https://pubmed.ncbi.nlm.nih.gov/?term=HIF-1+signaling+inflammation+hypoxia
- Chronic inflammation and colorectal cancer: https://pubmed.ncbi.nlm.nih.gov/?term=chronic+inflammation+colorectal+cancer
- Warburg effect in immune cells: https://pubmed.ncbi.nlm.nih.gov/?term=Warburg+effect+immune+cells
17. Discussion
The comprehensive single-cell analysis of human colon tissue across Healthy, Inflamed, and Non-inflamed conditions reveals a dynamic and complex cellular ecosystem, with profound alterations in cell populations, gene expression, and intercellular communication during inflammation.
A central finding is the significant infiltration and phenotypic shift of immune and stromal cells in both Inflamed and, to a lesser extent, Non-inflamed tissues compared to Healthy controls. Specifically, the relative proportions of B cells, Plasma cells, T cells (CD4+ and CD8+), Macrophages, and Dendritic cells are markedly increased in inflamed and non-inflamed states. Within the lymphoid compartment, Inflamed tissue is characterized by a prominent expansion of Innate Lymphoid Cell (ILC) subsets (ILC1, ILC2, ILC3 (NCR+), ILCreg), indicative of robust innate immune activation, while T regulatory cell (Treg) proportions appear relatively diminished. Macrophage subset analysis further refines this, showing a significant increase in M2B macrophages in both Non-inflamed and Inflamed conditions, suggesting their involvement in early immune dysregulation or sustained inflammatory responses, distinct from the higher M2D populations observed in Healthy tissue.
Beyond population shifts, the phenotypic characteristics of key cell types are distinctly altered. Healthy macrophages maintain an antigen presentation and immune regulatory profile (HLA-DQB2, ADORA3, HLA-G). In contrast, Non-inflamed macrophages adopt a primed state with enhanced pathogen recognition (CLEC7A), cytokine responsiveness (IL6ST), and active tissue remodeling (TGFBR1/2, ADAM17/28, CYSLTR1). Similarly, healthy fibroblasts exhibit immune modulatory functions (HLA-DPA1/DRB1/G), while inflamed and non-inflamed fibroblasts show markers of activation, increased adhesion (ITGAV, ITGA1, CDH11), growth factor signaling (FGFR1, AXL), and ECM remodeling (GPNMB), consistent with fibrotic processes. CD4+ T cells in inflamed tissue display a complex activation profile, marked by both co-stimulatory (TNFRSF18/GITR) and inhibitory (TIGIT, CTLA4) immune checkpoint receptors, alongside responsiveness to TNF (TNFRSF1B/TNFR2). This suggests a dynamic interplay of activating and dampening signals to fine-tune T cell responses in the inflammatory milieu. Notably, B cells in the inflamed colon uniquely upregulate TGFB1, YWHAB, and YWHAZ, suggesting specific regulatory or stress-response mechanisms rather than a global cell cycle activation.
Cell-cell interaction (CCI) analyses unveil condition-specific communication networks. Healthy tissue emphasizes homeostatic interactions involving T CD8+ cells (IFNG, LCK_CD8_receptor) and pro-resolving signals (ANXA1-FPR3). Inflamed tissue shows a pronounced increase in T cell co-stimulation (CD86-CD28), tissue remodeling (HBEGF-EGFR), and extensive extracellular matrix (ECM)-related interactions (e.g., COL3A1_integrin_a1b1, FN1_integrin_a3b1) predominantly between fibroblasts, indicative of active fibrogenesis. Epithelial-stromal crosstalk involving Wnt and Prostaglandin E2 (PGE2) signaling (WNT2B-FZD5_LRP5, ProstaglandinE2-PTGER4) and angiogenesis (JAG1-NOTCH4) are also hallmarks of inflammation. The Non-inflamed state shares some inflammatory signals, particularly PGE2-related interactions and sustained T cell activation markers, but crucially reveals an emergence of TGFB1-TGFbeta_receptor1 signaling, hinting at ongoing immune regulation or early fibrotic propensity distinct from acute inflammation.
Gene Ontology (GSA) and Gene Set Enrichment Analysis (GSEA) further elucidate the functional shifts. Healthy intestinal epithelial cells are highly metabolically active (oxidative phosphorylation, TCA cycle). In contrast, inflamed epithelial cells exhibit strong signs of cellular stress (ER protein processing, ribosome, ubiquitin-mediated proteolysis), active host-pathogen interaction (infection pathways), and dynamic turnover (cell cycle, apoptosis). Non-inflamed epithelial cells show an intermediate profile with active antigen processing and presentation, bacterial invasion responses, and Th17 cell differentiation, suggesting an active immunological engagement even without overt inflammation. Across major cell types, GSEA confirms widespread activation of chemokine, cytokine, IL-17, and Toll-like receptor signaling pathways in inflamed conditions. Macrophages and T cells in inflamed tissue undergo significant metabolic reprogramming towards aerobic glycolysis (Warburg effect), fueling their pro-inflammatory functions, while fibroblasts show activation of focal adhesion, HIF-1, and PI3K-Akt signaling, contributing to ECM remodeling and angiogenesis. The consistent enrichment of 'Pathways in cancer' in inflamed and non-inflamed intestinal epithelial cells and fibroblasts underscores the critical link between chronic inflammation and increased colorectal cancer risk.
Collectively, these findings paint a detailed picture of colonic inflammation, emphasizing the coordinated dysregulation across multiple cell types and their intercellular communication networks. The 'Non-inflamed' condition emerges as a critical intermediate state, not simply a return to health, but often characterized by a primed immune system, ongoing tissue remodeling, and altered homeostatic mechanisms that could predispose to or reflect persistent subclinical disease.
Hypotheses:
- The expansion of ILC subsets (ILC1, ILC2, ILC3 (NCR+), ILCreg) in inflamed colon directly contributes to the perpetuation of inflammation through cytokine production and host-pathogen interactions.
- The increase in M2B macrophages in both non-inflamed and inflamed colon represents a distinct macrophage polarization state that modulates immune responses and promotes tissue remodeling, acting as a bridge between quiescent and active inflammatory states.
- Aberrant activation of Integrin-mediated interactions (e.g., COL3A1_integrin_a1b1, FN1_integrin_a3b1) and Wnt/Frizzled signaling (WNT2B-FZD5_LRP5) in fibroblasts is a primary driver of fibrotic remodeling in chronic colonic inflammation.
- The upregulation of immune checkpoint receptors (TIGIT, CTLA4) on inflamed CD4+ T cells reflects a compensatory immune-regulatory mechanism attempting to limit excessive inflammation, rather than just an activated effector phenotype.
- Non-inflamed intestinal epithelial cells, despite lacking overt signs of inflammation, actively engage in antigen processing and presentation, and bacterial invasion responses, serving as sentinels that contribute to the maintenance of low-grade inflammation or predispose to future inflammatory flares.
- Metabolic reprogramming, characterized by increased glycolysis and reduced oxidative phosphorylation in activated macrophages and T cells, is a critical adaptive mechanism that fuels pro-inflammatory functions in the inflamed colon.
Potential therapeutic targets:
- M2B Macrophages / CLEC7A, CYSLTR1, OLR1 pathways: M2B macrophages are significantly increased in both Non-inflamed and Inflamed conditions, suggesting their critical role in the initiation or maintenance of colonic inflammation. Their surface markers like CLEC7A (pattern recognition), CYSLTR1 (lipid mediator response), and OLR1 (oxidative stress) indicate a primed, activated, or pro-inflammatory phenotype. Evidence: Mac (M2B) proportions are significantly higher in Non-inflamed and Inflamed conditions compared to Healthy (p ≤ 0.01). Surfaceome analysis shows distinct upregulation of CLEC7A, CYSLTR1, OLR1, IL6ST, TGFBR1/2, ADAM17 in Non-inflamed macrophages. Validation: In vivo genetic or pharmacological depletion/modulation of M2B macrophages or their specific surface receptors (e.g., anti-CLEC7A antibodies, CYSLTR1 antagonists) in experimental colitis models to assess impact on inflammation and tissue repair.
- Fibroblast Activation / FGFR1, AXL, Integrin-αV (ITGAV), GPNMB, CDH11: Activated fibroblasts contribute significantly to inflammation, tissue remodeling, and fibrosis in chronic inflammatory conditions. Upregulation of these surface markers indicates their active pathogenic role. Evidence: Inflamed and Non-inflamed fibroblasts show robust upregulation of FGFR1, AXL, ITGAV, GPNMB, CDH11, and other ECM-related integrins, linked to increased cell adhesion, growth factor signaling, and ECM remodeling. CCI analysis further highlights extensive ECM interactions (COL3A1_integrin_a1b1_complex--Fib|Fib, FN1_integrin_a3b1_complex--Fib|Fib) in inflamed tissue. Validation: Small molecule inhibitors targeting FGFR1 or AXL, or blocking antibodies against ITGAV or GPNMB, in ex vivo human colon tissue explants or in vivo fibrosis models to reduce collagen deposition and fibroblast activation.
- IL-17 Signaling Pathway: IL-17 is a key pro-inflammatory cytokine implicated in IBD pathogenesis, and its signaling pathway is broadly enriched across multiple cell types in inflamed colon. Evidence: GSEA shows strong enrichment of the IL-17 signaling pathway in T cells, Macrophages, Intestinal Epithelial cells, and Fibroblasts in inflamed tissue. ILC subsets, which can produce IL-17, are expanded in inflamed conditions. Validation: Use of existing anti-IL-17 antibodies or receptor antagonists (e.g., anti-IL-17A, anti-IL-17RA) in preclinical models of colitis to assess efficacy in reducing inflammation.
- T Cell Co-stimulation / CD86-CD28 axis & Immune Checkpoints (TIGIT, CTLA4, GITR): The CD86-CD28 axis is critical for T cell activation, and immune checkpoints (TIGIT, CTLA4) regulate this activity in inflamed tissue. Modulating these pathways can control excessive T cell responses. Evidence: CCI analysis shows strong CD86-CD28 interaction in inflamed conditions. Surfaceome analysis of CD4+ T cells shows upregulation of TIGIT, CTLA4, and TNFRSF18 (GITR) in inflamed states. Validation: Develop or repurpose immunomodulatory agents (e.g., CTLA4-Ig fusion protein, TIGIT agonists, GITR modulators) to dampen T cell overactivity in inflammatory models.
Follow-up validation ideas:
- Flow cytometry or Immunohistochemistry: Quantify the proportions of ILC subsets (ILC1, ILC2, ILC3 (NCR+), ILCreg), M2B macrophages (using CLEC7A, CYSLTR1, OLR1 markers), and Treg cells (TIGIT, CTLA4, GITR) in colon biopsies from Healthy, Non-inflamed, and Inflamed patients to validate population shifts and surface marker expression observed in scRNA-seq.
- Spatial Transcriptomics or Multiplex Immunofluorescence: Map the spatial distribution and co-localization of activated fibroblasts (expressing FGFR1, AXL, GPNMB) and their interacting immune cells within inflamed and non-inflamed colon tissue to confirm CCI findings and identify microenvironmental niches of fibrogenesis and inflammation.
- In vitro co-culture experiments: Co-culture fibroblasts with intestinal epithelial cells or immune cells, perturbing key ligand-receptor interactions like WNT2B-FZD5/LRP5 or Integrin-ECM components, to assess their impact on epithelial proliferation, barrier function, or fibroblast activation and ECM production.
- Organoid or ex vivo colon tissue models: Use patient-derived colon organoids or explants from different conditions to functionally validate the role of specific signaling pathways (e.g., IL-17, PI3K-Akt, HIF-1, or PGE2 via PTGER4) identified by GSEA/GSA in epithelial and immune cell responses to inflammatory stimuli.
- Perturbation assays in animal models of colitis: Administer inhibitors or activators targeting pathways such as FGFR1, AXL, Integrins, or modulators of M2B macrophage function in experimental colitis models (e.g., DSS-induced colitis) to evaluate their therapeutic potential in reducing inflammation and fibrosis.
- Metabolomic analysis: Perform targeted metabolomics on sorted macrophages and T cells from healthy and inflamed colon tissue to confirm the predicted metabolic reprogramming (e.g., increased glycolysis intermediates, reduced TCA cycle metabolites).
- Functional assays for B cells: Investigate the functional consequences of elevated TGFB1, YWHAB, and YWHAZ expression in inflamed B cells, focusing on IgA class switching, proliferation, and cytokine production using sorted B cells from colon tissue or in vitro stimulated B cells.
Limitations:
This study provides a comprehensive single-cell view of human colon tissue, yet it is subject to several limitations. The cross-sectional nature of the data restricts causal inference regarding observed cellular and molecular changes; longitudinal studies would be required to establish temporality. While robust cell type annotation was achieved, some macrophage and epithelial subsets, as noted in the marker gene analysis, warrant further detailed characterization with additional specific markers or functional assays to resolve subtle phenotypic differences. The inferred cell-cell interactions are computational predictions based on ligand-receptor expression; direct functional validation through experimental perturbation is essential to confirm their biological relevance. Finally, the "Non-inflamed" category represents a heterogeneous group, likely encompassing quiescent disease, subclinical inflammation, or remission states, which may mask more nuanced molecular programs relevant to disease progression or resolution. Future studies integrating spatial omics and functional assays will be crucial to overcome these limitations and fully translate the identified molecular signatures into clinical applications.
18. Query List
- Show UMAPs including condition, sample, major cell type, minor cell type, and celltype_subset, in 2 columns, and save it.
- Show expression levels of CD3D, CD4, CD8A, CD79A, MS4A1, MZB1, CD14, LYZ, FBLN1, NOTCH3, EPCAM, MUC1, CD34 genes on UMAP, along with minor cell type annotation. Use ncols=4, and save it.
- Show the overall Celltype_subset marker expression dot plot and save it. Keep target_cell as None and keep the other arguments at their default values.
- Show a population bar plot of minor cell types and save it.
- Show a subset population barplot for T cells and save it.
- Show a subset population barplot for Macrophages and save it.
- For Macrophage subset populations, find any statistically significant differences between conditions and show them as box plots. Determine ncols appropriately based on the total number of panels, and save it.
- Show cell-cell interactions by condition and save the result. Select at most 80 cell-cell interactions for each condition.
- Select only genes related to immune checkpoint and cell cycle pathways, and show cell-cell interactions for these genes, and save it.
- Find statistically significant differences in cell-cell interactions between conditions for major immune and stromal cells, show them as a dot plot with max_n_items_per_group = 25, and save it.
- Extract condition-specific markers for 'Macrophage' cells, show them as a dot plot, including only surfaceome markers up to 50 per condition, and save it.
- Extract condition-specific markers for 'Fibroblast' cells, show them as a dot plot, including only surfaceome markers up to 50 per condition, and save it.
- Extract condition-specific markers for 'T cell CD4+' cells, show them as a dot plot, including only surfaceome markers up to 50 per condition, and save it.
- For major disease-related cell types (B cell, Endothelial cell, Fibroblast, ILC, Intestinal Epithelial cell, Macrophage, Mast cell, NK cell, Plasma cell, T cell CD4+, T cell CD8+), identify cell cycle pathway related genes with statistically significant expression differences between conditions, show them as boxplots with max_n_items_to_plot = 24, set ncols to maintain a 2x3 aspect ratio, and save it.
- Show Gene Ontology (GSA) analysis results for epithelial cells as bar plots and save the result.
- Show a dot plot of Gene Set Enrichment Analysis results for major cell types (B cell, Endothelial cell, Fibroblast, ILC, Intestinal Epithelial cell, Macrophage, Mast cell, NK cell, Plasma cell, T cell CD4+, T cell CD8+), use RdBu_r as the color map, n_pws_to_show = 80, and save it.