Single-Cell Landscape of Renal Cell Carcinoma: Insights into Tumor Microenvironment, Genomic Alterations, and Intercellular Communication
This comprehensive single-cell analysis of human kidney tissue reveals significant cellular, genomic, and molecular remodeling in Renal Cell Carcinoma (RCC) compared to adjacent normal tissue. We identify clear distinctions in cell type composition, with increased immune and stromal infiltration in tumors, alongside recurrent genomic alterations (aneuploidy and specific CNVs) that define malignant renal epithelial cells. A complex network of cell-cell interactions and metabolic reprogramming characterizes the tumor microenvironment, highlighting potential avenues for therapeutic intervention.
Contents
- Dataset overview
- Single-Cell UMAP Embedding Overview by Metadata
- Single-cell UMAP Visualization of Major Cell Type Scores, Ploidy, and Annotations in Kidney Tissue
- Celltype_subset 마커 유전자 발현 Dot Plot 분석
- Copy Number Variation Analysis of Renal Epithelial and Unassigned Cells in Kidney Tissue
- CNV-based UMAP Visualization of Kidney Single-Cell RNA-seq Data
- Minor Cell Type Population Analysis in Kidney Tumor vs. Adjacent Normal Tissue
- 신장 조직 내 T 세포 하위 집단 분석
- 신장 종양 미세환경 내 대식세포 하위 집단 비율 변화 분석
- Macrophage M2A Subpopulation Analysis in Kidney Tumor Microenvironment
- Ploidy Population Analysis in Renal Epithelial and Unassigned Cells Across Kidney Tumor and Adjacent Normal Tissues
- 신장 종양 미세환경의 세포-세포 상호작용 패턴
- Kidney Tumor Microenvironment Cell-Cell Interaction Analysis
- Condition-Specific Cell-Cell Interaction Patterns in Kidney Tissue
- Renal Epithelial Cell Condition-Specific Surfaceome Markers in Kidney Tissue
- Macrophage Condition-Specific Surfaceome Markers in Kidney Tissue
- Renal Epithelial Cell Gene Ontology Analysis Across Ploidy and Tumor Conditions
- Gene Set Enrichment Analysis of Kidney Tumor Microenvironment Cell Types
- Discussion
- Query List
0. Dataset overview
Dataset Summary
- This dataset contains single-cell RNA-seq data from human Kidney tissue, specifically analyzed for tumor and adjacent_normal conditions.
- It includes 49,645 cells and 19,593 genes.
- Observed metadata (obs columns) provide extensive annotations such as library, sample, patient, condition, sex, tissue, age, and various cell type classifications: cell_type, broad_cell_type, cell_group, celltype_major, celltype_minor, celltype_subset.
Key cell type classifications:
- celltype_major: unassigned, Myeloid cell, Endothelial cell, T cell, Stromal cell, B cell, Mast cell, Renal Epithelial cell.
- celltype_minor: unassigned, Macrophage, Endothelial cell, T cell CD8+, T cell CD4+, ILC, Smooth muscle cell, Plasma cell, Mast cell, B cell, NK cell, Dendritic cell, Intercalated cell, Podocyte, Collecting Duct Principal cell, Proximal Tubule, Thick Ascending Limb, Distal Tubule, Fibroblast.
- celltype_subset: Provides even finer granularities of cell types, such as Macrophage (M1), T cell (Cytotoxic), B cell (Breg), and various types of Renal Epithelial cells.
- Ploidy information (ploidy_dec) indicates whether cells are Aneuploid or Diploid.
Precomputed results available in uns include
- Cell-cell interaction (CCI) results (CCI, CCI_sample).
- Differential gene expression (DEG) results (DEG).
- Gene Set Enrichment Analysis (GSEA) results (GSEA).
- Gene Ontology (GO) / Gene Set Analysis (GSA) results (GSA_up).
- Copy Number Variation (CNV) estimates are stored in obsm['X_cnv'] along with related ploidy_dec labels.
1. Single-Cell UMAP Embedding Overview by Metadata
[Analysis Visualization Results]...
Analysis Overview
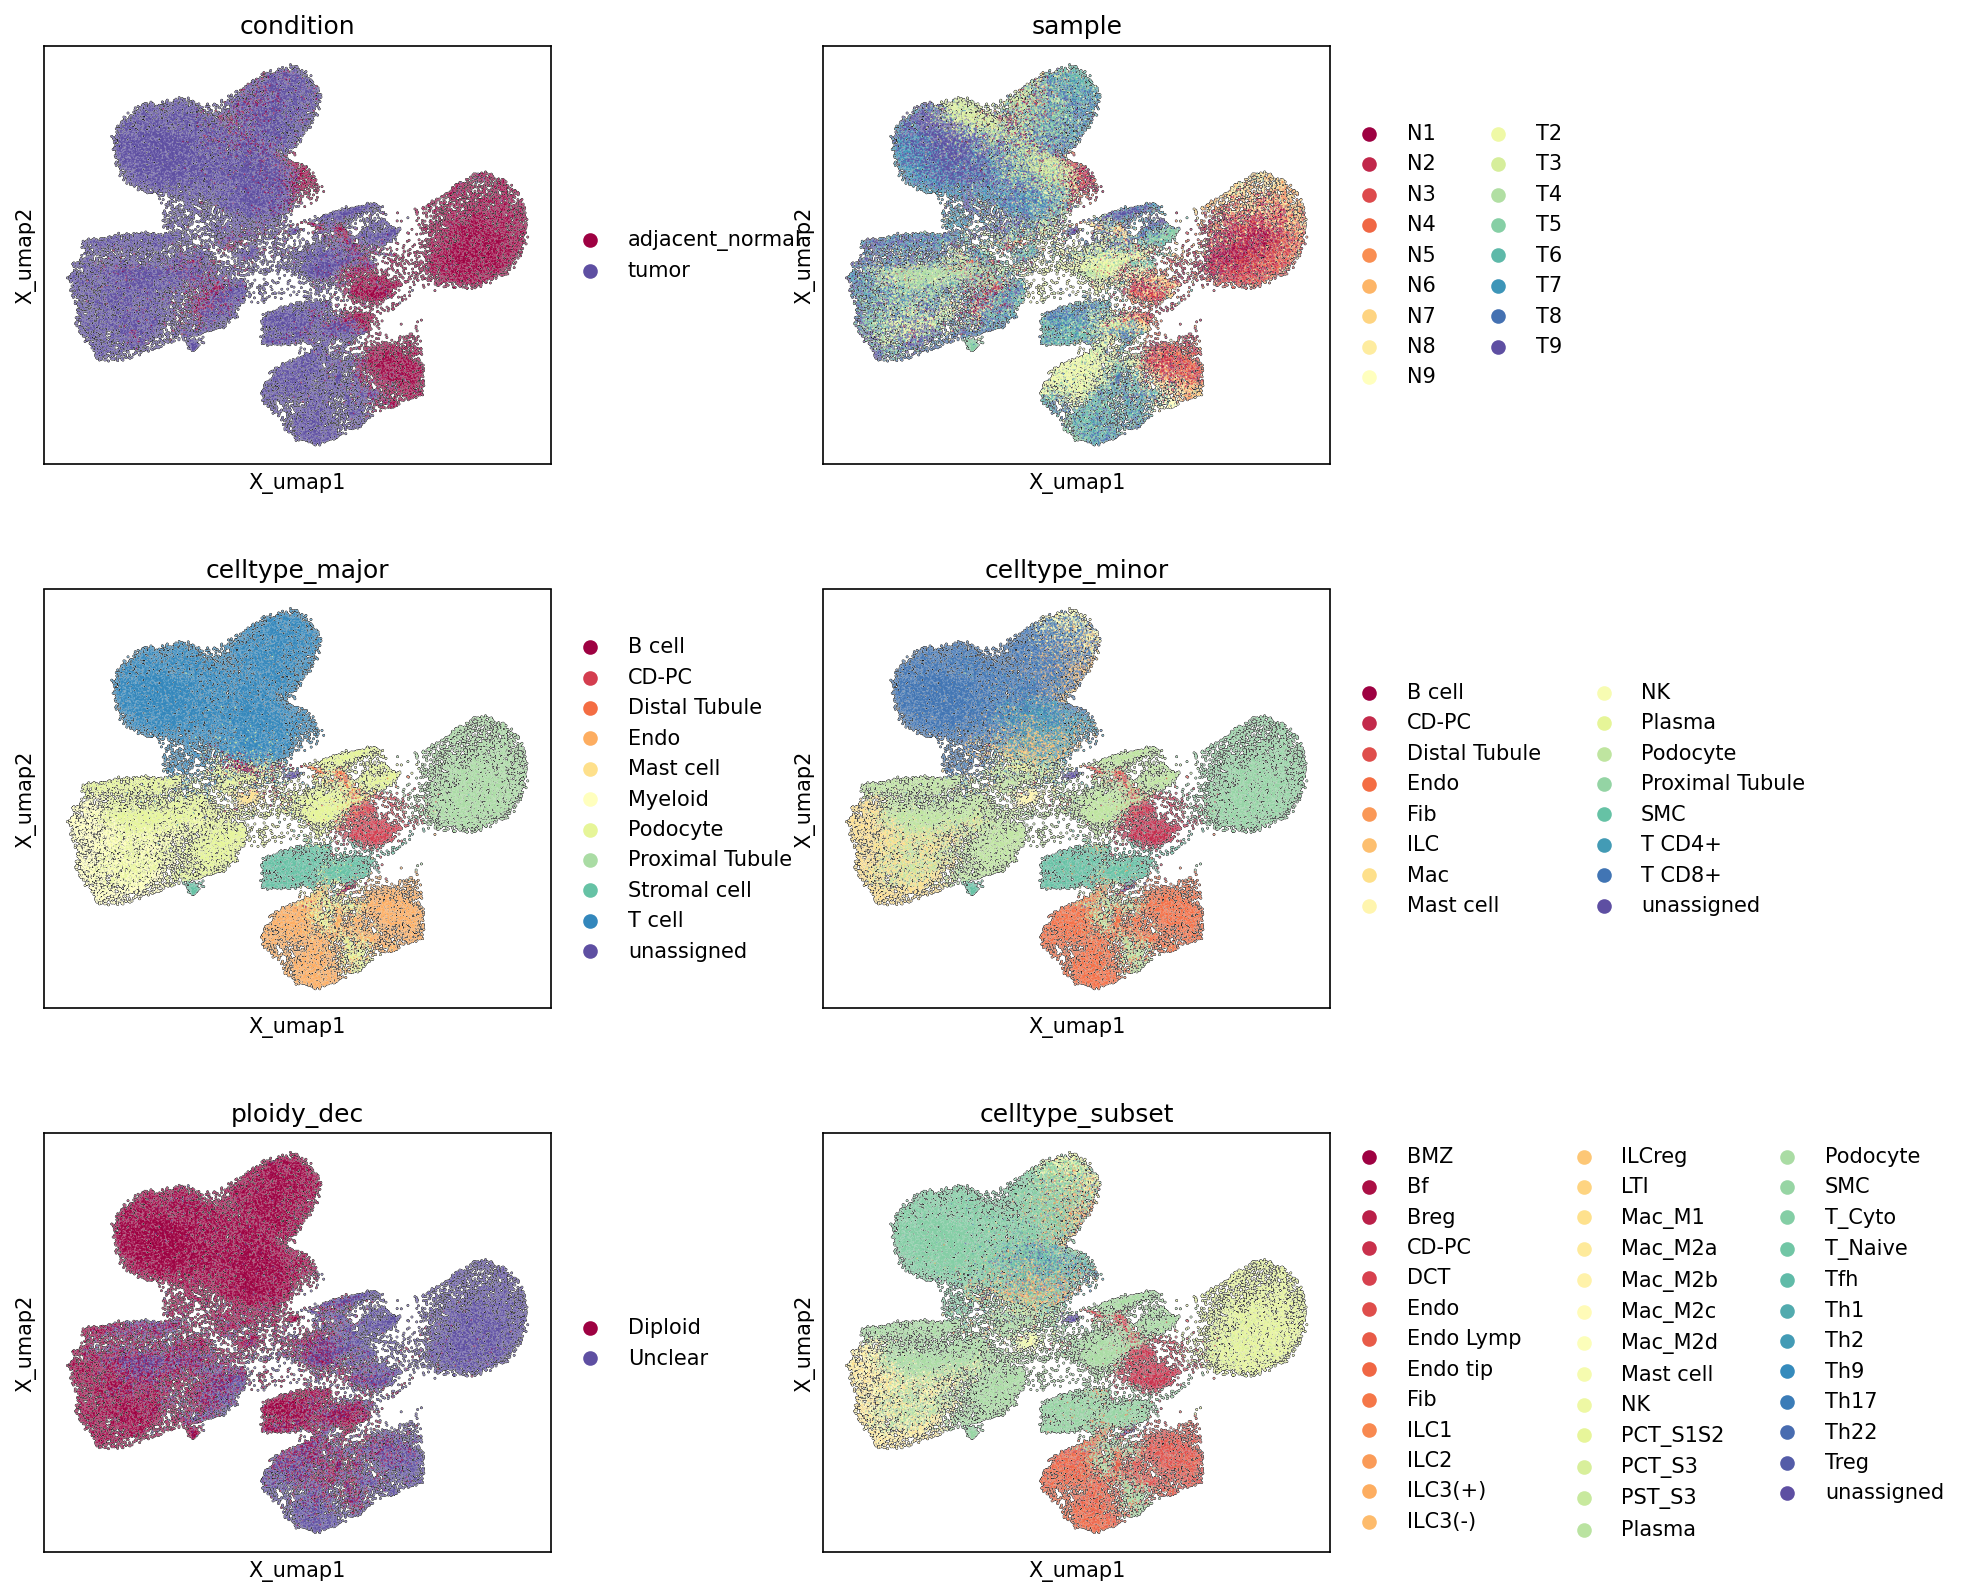
This analysis presents a series of Uniform Manifold Approximation and Projection (UMAP) plots for the single-cell RNA-sequencing dataset of kidney tissue. These visualizations illustrate the overall cellular landscape by reducing high-dimensional gene expression data into two dimensions (X_umap1, X_umap2). Each UMAP is colored by different metadata categories, including sample condition (tumor vs. adjacent_normal), individual samples, major cell types, minor cell types, cell ploidy status (diploid vs. aneuploid), and finer cell subsets. This provides an essential initial overview of cell population distribution, sample batch integration, and the quality of cell type annotations and ploidy inference.
Visual Summary
Condition and Sample Distribution
- Condition (adjacent_normal vs. tumor): The UMAP reveals a clear separation between cells originating from "adjacent_normal" tissue and "tumor" tissue. While some clusters appear predominantly "tumor" (e.g., the large cluster on the right-hand side and some smaller clusters within the main body), other clusters are clearly enriched with "adjacent_normal" cells (e.g., the top-left cluster). There are also regions where both conditions are intermixed, suggesting shared cell populations or transitional states.
- Sample: The "sample" plot indicates a generally good mixing of cells from different samples (N1-N9 for normal, T1-T9 for tumor) within their respective condition-specific regions, suggesting that major batch effects have been largely mitigated in the embedding. However, some individual samples might contribute more heavily to specific sub-clusters, which is expected due to biological variability between patients.
Cell Type Annotations (Major, Minor, Subset)
- Celltype_major: Distinct major cell types generally form coherent, well-separated clusters on the UMAP. For example, "Renal Epithelial cell" forms a large, distinct cluster, "Myeloid cell" forms another, and "T cell" populations are also well-grouped. The "unassigned" cells represent a relatively small fraction and are distributed across different regions.
- Celltype_minor: This finer-grained annotation further resolves the major cell type clusters into more specific populations. For instance, the "Renal Epithelial cell" major cluster is subdivided into "Proximal Tubule", "Distal Tubule", "Collecting Duct Principal cell", "Podocyte", etc. Similarly, "Myeloid cell" resolves into "Macrophage", "Dendritic cell", and others, and "T cell" into "T cell CD4+" and "T cell CD8+". Most minor cell types also show distinct clustering, indicating robust annotation.
- Celltype_subset: The most granular annotation, "celltype_subset", provides even more detailed distinctions within the minor cell types (e.g., various macrophage subtypes like M1, M2A, M2B, M2C, M2D; T cell subtypes like Cytotoxic, Treg, Naive; and specific epithelial segments like PCT_S1S2, PST_S3, DCT, TAL). These subsets largely retain the organized structure, indicating consistent hierarchical annotation.
Ploidy Status
- Ploidy_dec (Aneuploid, Diploid, Unclear): The "ploidy_dec" plot shows a distinct pattern where "Aneuploid" cells are concentrated in specific regions of the UMAP, particularly overlapping with a significant portion of the "tumor" condition. The vast majority of cells are labeled "Diploid," predominantly found in "adjacent_normal" regions and some "tumor" regions. A small number of cells are marked "Unclear" for ploidy.
Biological Interpretation
The UMAP visualizations provide crucial insights into the cellular composition and disease-associated changes within the kidney tissue.
- Tumor Microenvironment Remodeling: The separation of tumor and adjacent_normal cells on the UMAP indicates significant transcriptomic differences driven by the disease. The presence of intermixed regions suggests either a transition zone, immune cell infiltration into both regions, or shared stromal components.
- Cellular Heterogeneity in Tumor: The "tumor" regions on the UMAP are occupied by a diverse array of cell types, including various immune cells (T cells, Myeloid cells), stromal cells (Fibroblasts, Endothelial cells), and the tumor-originating Renal Epithelial cells. This highlights the complex and heterogeneous nature of the tumor microenvironment.
- Kidney-Specific Epithelial Cell Populations: The clear clustering of specific renal epithelial cell types (e.g., Proximal Tubule, Distal Tubule, Collecting Duct, Podocyte) in the "adjacent_normal" regions underscores the successful capture and resolution of the kidney's intricate nephron segments. The "Renal Epithelial cell" major cluster is a primary candidate for identifying neoplastic cells.
- Aneuploidy as a Hallmark of Malignancy: The enrichment of "Aneuploid" cells almost exclusively within the "tumor"-associated clusters, particularly those identified as "Renal Epithelial cell" (the tumor origin cell type), strongly supports their malignant nature. This observation aligns with the understanding that chromosomal instability and aneuploidy are common characteristics of cancer cells, driving tumorigenesis and progression [PubMed Search: "aneuploidy cancer" (PubMed Search)]. The clear spatial separation of aneuploid cells from diploid cells provides robust evidence for distinguishing malignant cells from normal counterparts and tumor-infiltrating non-malignant cells.
- Immune Infiltration: Both T cells and Myeloid cells are present in both tumor and adjacent normal regions, but their specific subtypes and activation states (which would be revealed by differential expression analysis) might differ significantly between conditions, reflecting immune responses or immune evasion mechanisms in the tumor.
Annotation Notes
The coherence of cell type clusters at major, minor, and subset levels, along with the distinct separation of conditions and ploidy status, indicates high quality cell type annotation and reliable embedding structure. The minimal presence of 'unassigned' cells further supports the robustness of the cell type identification. The sample mixing across clusters, especially within condition-specific regions, suggests effective integration of data from multiple donors, minimizing potential batch effects. The ploidy inference appears biologically consistent, with aneuploidy predominantly associated with tumor cell populations.
2. Single-cell UMAP Visualization of Major Cell Type Scores, Ploidy, and Annotations in Kidney Tissue
[Analysis Visualization Results]...
Analysis Overview
This analysis presents a series of Uniform Manifold Approximation and Projection (UMAP) plots generated from single-cell RNA sequencing data of human kidney tissue. The purpose is to visualize the distribution of cells based on their major cell type gene expression scores (HiCAT_major_score), infer ploidy status (ploidy_dec), and display the final major cell type annotations (celltype_major) across the entire dataset. This provides a comprehensive overview of the cellular landscape and serves as a critical step for validating cell type assignments and identifying distinct cellular populations, including those potentially malignant. The dataset comprises 49,645 cells and 19,593 genes, originating from both tumor and adjacent normal kidney conditions.
Visual Summary
The UMAP plots display the two-dimensional embedding of the single-cell RNA-seq data, where each point represents a single cell.
Major Cell Type Scores (HiCAT_major_score):
- Each of the first seven plots highlights the expression score for a specific major cell type (T cell, B cell, Myeloid cell, Mast cell, Endothelial cell, Stromal cell, Renal Epithelial cell).
- High scores (yellow/green) indicate strong enrichment for genes characteristic of that cell type, while low scores (purple) suggest absence.
- For example, "HiCAT_major_score: T cell" shows a distinct cluster on the left side of the UMAP with high scores, clearly segregating from other populations. Similar distinct, high-scoring regions are observed for B cells (a small cluster near the T cells), Myeloid cells (several scattered clusters), Endothelial cells (a cluster at the bottom-middle), Stromal cells (a cluster at the bottom-right), and Renal Epithelial cells (a large, somewhat diffuse cluster in the central-bottom region, extending upwards). Mast cells appear to be a smaller, distinct population.
Ploidy Status (ploidy_dec):
- The ploidy_dec plot shows cells colored by their inferred ploidy status: Aneuploid (red), Diploid (light yellow), and Unclear (dark purple).
- A prominent cluster of Aneuploid cells is observed in the central-bottom region of the UMAP, and a smaller, more diffuse cluster appears at the top-right. The vast majority of cells are Diploid.
Major Cell Type Annotation (celltype_major):
- The final plot displays the assigned celltype_major for each cell, using distinct colors for each type.
- This plot largely confirms the patterns observed in the individual score plots, showing well-demarcated clusters corresponding to the high-scoring regions for each major cell type. For instance, the T cell score region perfectly aligns with the 'T cell' cluster, and the Renal Epithelial cell score region aligns with the 'Renal Epithelial cell' cluster.
- The 'unassigned' category appears to be minimal, suggesting robust annotation.
Biological Interpretation
The UMAP visualizations provide a clear and well-structured representation of the cellular heterogeneity within the kidney tissue, encompassing both tumor and adjacent normal samples.
- Robust Cell Type Annotation: The strong congruence between the HiCAT major cell type scores and the final celltype_major annotations across the UMAP embedding indicates a high quality and confidence in the cell type assignments. Each major cell type forms distinct clusters, driven by their unique gene expression profiles, which is essential for downstream cell-type-specific analyses.
- Complex Tissue Composition: The presence and distinct clustering of various immune cell types (T cell, B cell, Myeloid cell, Mast cell), along with structural cells like Endothelial and Stromal cells, highlight the intricate cellular ecosystem of the kidney. The immune cell populations suggest a diverse immune microenvironment, likely modulated by disease status (tumor vs. normal).
- Identification of Malignant Cells: Critically, the Aneuploid cells primarily cluster within the Renal Epithelial cell population, which is designated as the Tumor origin celltype. This strong co-localization strongly suggests that these Aneuploid Renal Epithelial cells represent the malignant tumor cell population. Aneuploidy, a hallmark of cancer characterized by an abnormal number of chromosomes, is a robust indicator for distinguishing tumor cells from healthy diploid cells. This distinction is fundamental for studying tumor biology and its interaction with the tumor microenvironment.
- Non-Malignant Compartment: The widespread Diploid cells represent the non-malignant components of the kidney, including various immune cells, stromal cells, endothelial cells, and healthy renal epithelial cells from both normal tissue and potentially the tumor periphery. Their clear separation from the Aneuploid clusters on the UMAP further validates the successful segregation of malignant and non-malignant compartments.
Annotation Notes
- The consistency between the individual major cell type scores and the final celltype_major assignments on the UMAP provides strong validation for the quality and reliability of the cell type annotations.
- The clear separation of Aneuploid cells, largely coinciding with Renal Epithelial cell clusters, is a valuable observation for isolating and studying the malignant epithelial cells, which are the primary focus for tumor studies in this dataset.
- The UMAP successfully resolves various immune and stromal cell populations, enabling detailed investigation into their roles in kidney health and disease.
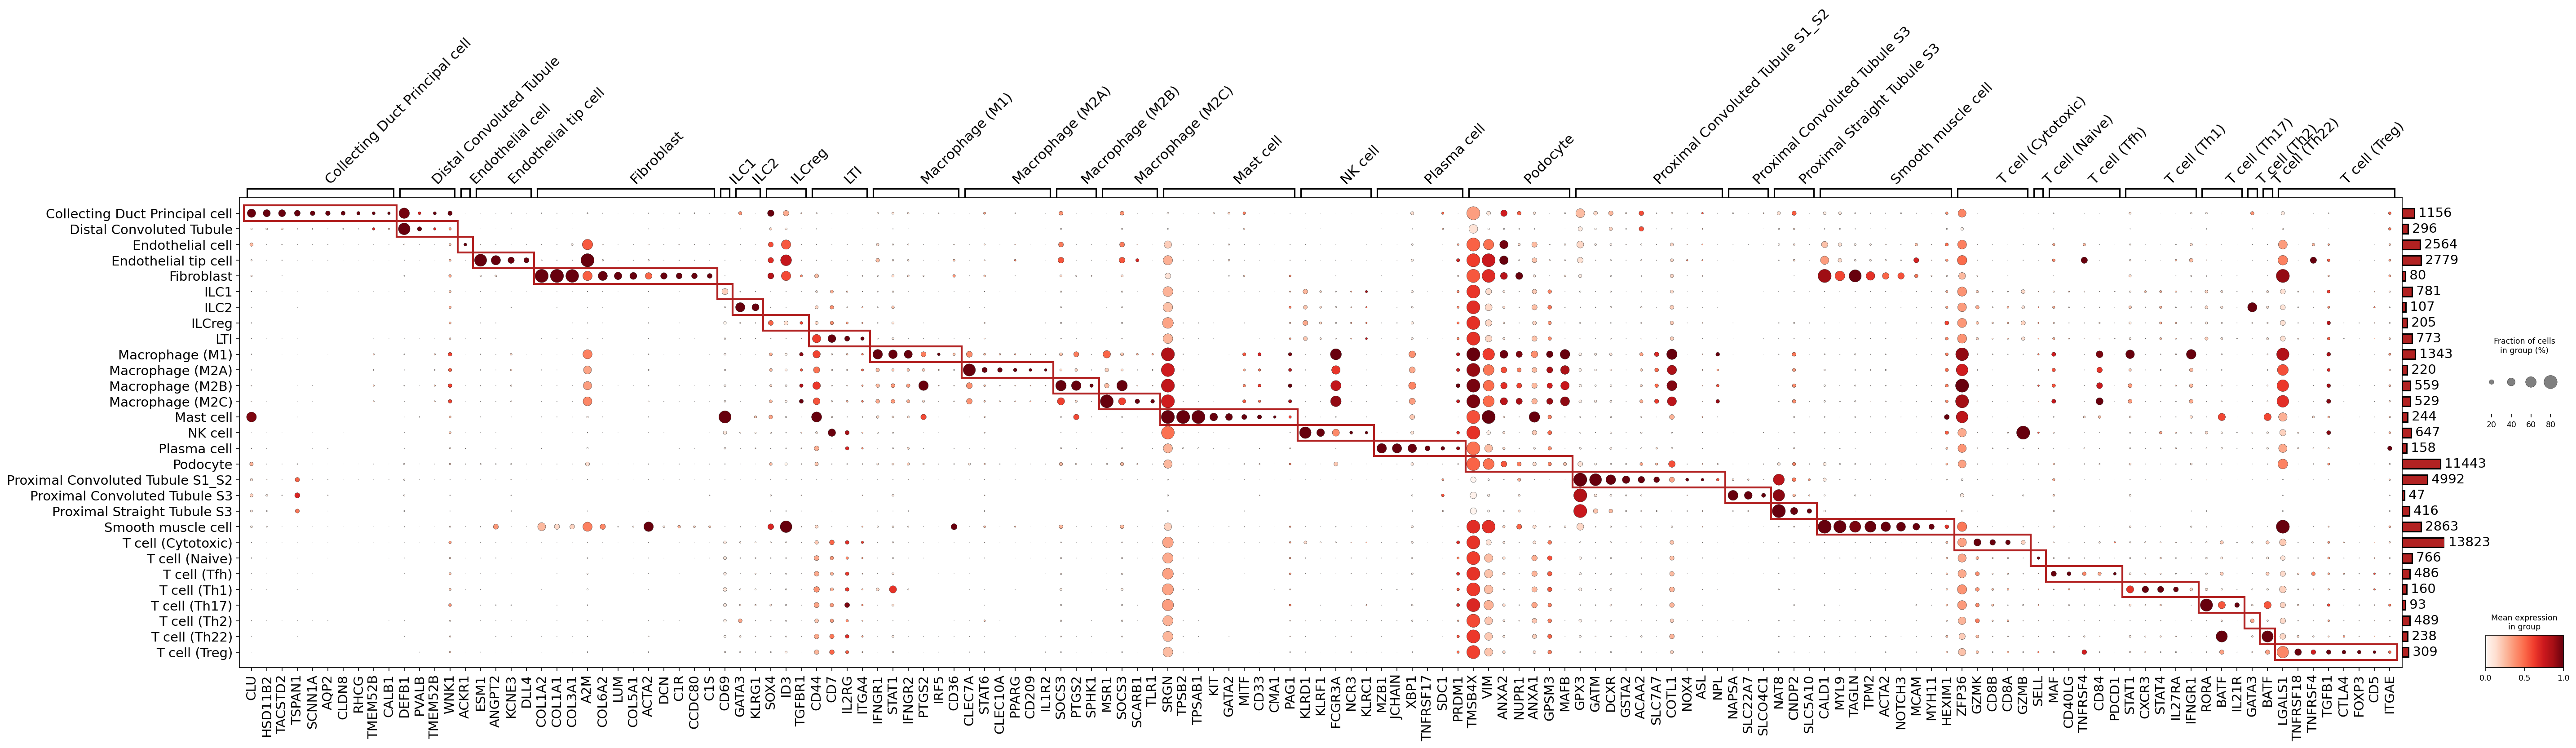
3. Celltype_subset 마커 유전자 발현 Dot Plot 분석
[Analysis Visualization Results]...
Analysis Overview
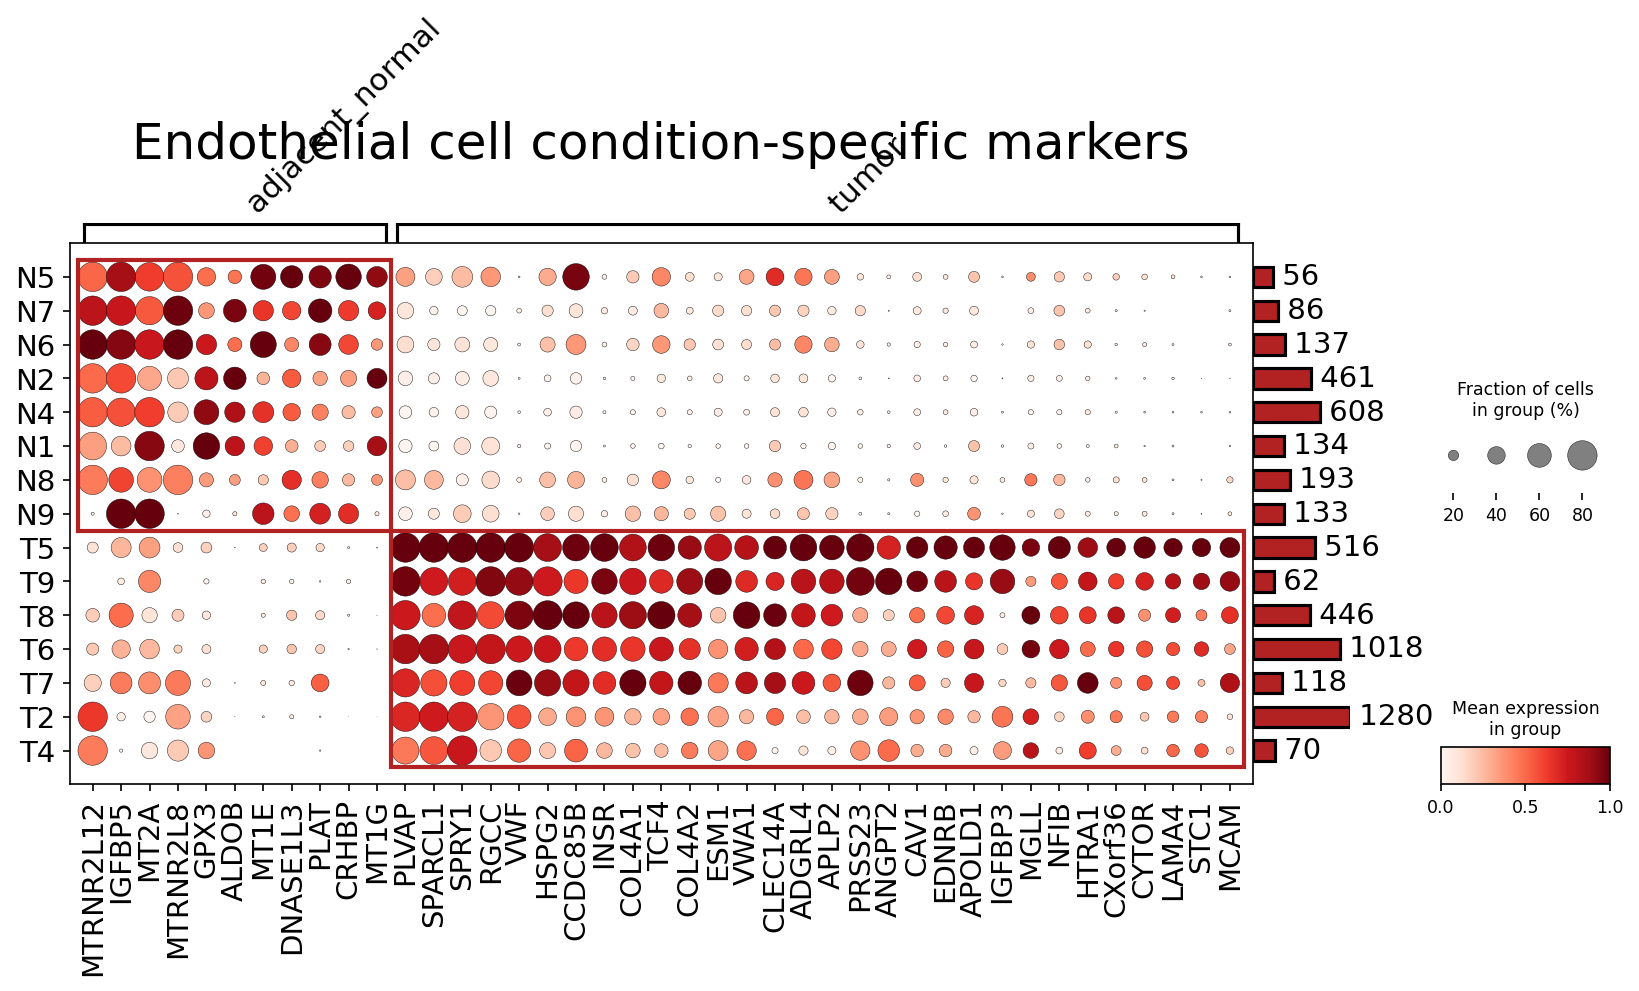
본 분석은 단일 세포 RNA 시퀀싱(scRNA-seq) 데이터를 기반으로 신장 조직에서 분류된 다양한 "celltype_subset"에 대한 마커 유전자 발현 패턴을 시각화한 dot plot입니다. 이 플롯은 각 세포 아형(row)에서 고유하게 발현되는 유전자(column)를 식별하고, 해당 발현 수준(점의 색상) 및 발현 세포 비율(점의 크기)을 보여줍니다. 이는 기존의 세포 아형 분류가 생물학적으로 타당하며, 각 아형이 특징적인 유전자 발현 프로파일을 가지고 있음을 확인하는 데 중점을 둡니다.
Visual Summary
제공된 dot plot은 각 celltype_subset의 마커 유전자 발현을 명확하게 보여줍니다.
- 패턴: 플롯의 대각선을 따라 짙은 색상의 크고 뚜렷한 점들이 그룹화되어 있습니다. 이는 각 celltype_subset이 고유한 마커 유전자 세트를 강력하게 발현하고 있음을 시사합니다. 이러한 대각선 패턴은 세포 분류의 높은 특이성을 나타냅니다.
- 마커 유전자: 각 celltype_subset에 대해 식별된 마커 유전자들은 해당 그룹 내에서 높은 발현(짙은 붉은색)과 높은 비율의 세포에서 발현(큰 점)을 보입니다. 빨간색 테두리 상자는 각 세포 아형에 특이적인 마커 유전자 그룹을 시각적으로 강조합니다.
- 세포 수: 플롯의 오른쪽에 있는 막대 그래프는 각 celltype_subset에 속하는 세포의 총 수를 나타냅니다. 이는 각 그룹의 데이터 크기를 이해하는 데 도움이 되며, Proximal Convoluted Tubule S1_S2 그룹이 가장 많은 세포(13544개)를 포함하고 있음을 보여줍니다.
Biological Interpretation
이 마커 유전자 발현 플롯은 신장 조직 내 세포 아형 분류의 신뢰성을 강력하게 지지합니다. 각 celltype_subset이 잘 알려진 생물학적 기능을 반영하는 특정 마커 유전자들을 발현하고 있어, 세포 정체성이 정확하게 할당되었음을 시사합니다.
- B 세포 (B cell (Breg), B cell (Follicular)): POU2F2, CD24, CD22, IGHD와 같은 유전자는 B 세포의 특징적인 마커이며, 특히 IGHD는 미성숙 및 성숙 B 세포에서 발현됩니다.
- 수집관 주세포 (Collecting Duct Principal cell): AQP2, SCNN1A, CLDN8의 발현은 수집관 주세포의 고유한 기능을 잘 나타냅니다. AQP2는 수분 재흡수에 중요한 아쿠아포린 채널이고, SCNN1A는 상피성 나트륨 채널(ENaC)의 일부입니다. PubMed search: AQP2 SCNN1A kidney principal cell
- 수지상 세포 (DC (Classical)): CD1C, CLEC9A, XCR1과 같은 마커는 고전적인 수지상 세포(cDC1)의 특징을 보여줍니다.
- 내피 세포 (Endothelial cell, Endothelial tip cell): ESM1, ANGPT2 등은 혈관 내피 세포의 일반적인 마커입니다.
선천 림프구 (ILC1, ILC2, ILCreg, LTI):
ILC1은 NKG7 등 세포 독성 관련 마커를 공유하며,
- ILC2는 GATA3와 같은 Th2 유사 전사 인자를 발현합니다.
- ILCreg는 조절 T 세포와 공유하는 FOXP3를 발현합니다.
- 사이세포 (Intercalated cell): ATP6V1G3, ATP6V0D2, FOXI1 등은 신장 수집관의 산-염기 균형 조절에 관여하는 사이세포의 특이적 마커입니다.
대식세포 (Macrophage (M1), M2A, M2B, M2C, M2D):
- M1 대식세포는 염증 반응과 관련된 CD86 등을 발현합니다.
- M2A 대식세포는 MSR1 (scavenger receptor)을 통해 조직 복구 기능을 나타냅니다.
M2C 대식세포는 C1QC (보체 성분)을 발현하며,
- M2D 대식세포는 SPP1 (osteopontin)을 발현하여 종양 미세환경에서 중요한 역할을 할 수 있습니다.
이러한 마커들은 대식세포의 다양한 기능적 아형 분류를 지지합니다.
- 비만 세포 (Mast cell): TPSAB1 (tryptase), KIT (CD117)는 비만 세포의 고유한 마커입니다. GeneCards: TPSAB1
- NK 세포 (NK cell): NKG7, GZMB, FCGR3A (CD16) 등은 NK 세포의 세포 독성 기능을 나타내는 잘 알려진 마커입니다.
- 형질 세포 (Plasma cell): JCHAIN, MZB1, XBP1 등은 항체 생산 및 분비에 특화된 형질 세포의 특성을 보여줍니다.
- 족세포 (Podocyte): NPHS1 (nephrin)은 신장 여과 장벽의 핵심 구성 요소인 족세포의 특이적 마커입니다.
- 근위 세뇨관 (Proximal Convoluted Tubule S1_S2, S3, Proximal Straight Tubule S3): SLC34A1, SLC5A3 등은 근위 세뇨관에서 영양분 재흡수에 중요한 역할을 하는 수송체입니다.
- 평활근 세포 (Smooth muscle cell): ACTA2, MYL9, TAGLN, MYH11 등은 평활근 세포의 수축성을 담당하는 단백질 마커입니다.
- T 세포 아형 (T cell (Cytotoxic), T cell (Tfh), T cell (Th1), T cell (Th17), T cell (Th2), T cell (Th22), T cell (Treg)): 각 T 세포 아형은 CD8A, GZMB (Cytotoxic T), CXCL13, PDCD1 (Tfh), STAT1 (Th1), RORC (Th17), GATA3 (Th2), IL22 (Th22), FOXP3, CTLA4 (Treg)와 같은 고유한 전사 인자, 사이토카인, 수용체 발현을 통해 그 정체성을 명확히 확립합니다.
- 헨레 루프 상행각 두꺼운 부분 (Thick Ascending Limb): UMOD (uromodulin), SLC12A1 등은 헨레 루프 상행각의 기능을 반영하는 특이적 마커입니다. GeneCards: UMOD
Annotation Notes
이 Dot Plot은 각 "celltype_subset"의 마커 유전자 발현 패턴이 현재까지 알려진 생물학적 지식과 매우 일관됨을 보여줍니다. 마커 유전자들의 뚜렷하고 특이적인 발현은 이 데이터셋에서 수행된 세포 아형 분류(annotation)가 견고하고 신뢰할 수 있음을 강력하게 뒷받침합니다. 각 세포 그룹이 특정 유전자 세트를 고유하게 발현하여 다른 그룹과 명확하게 구별되므로, 이는 다운스트림 분석의 기반이 되는 세포 정체성 할당이 정확함을 나타냅니다.
4. Copy Number Variation Analysis of Renal Epithelial and Unassigned Cells in Kidney Tissue
[Analysis Visualization Results]...
Analysis Overview
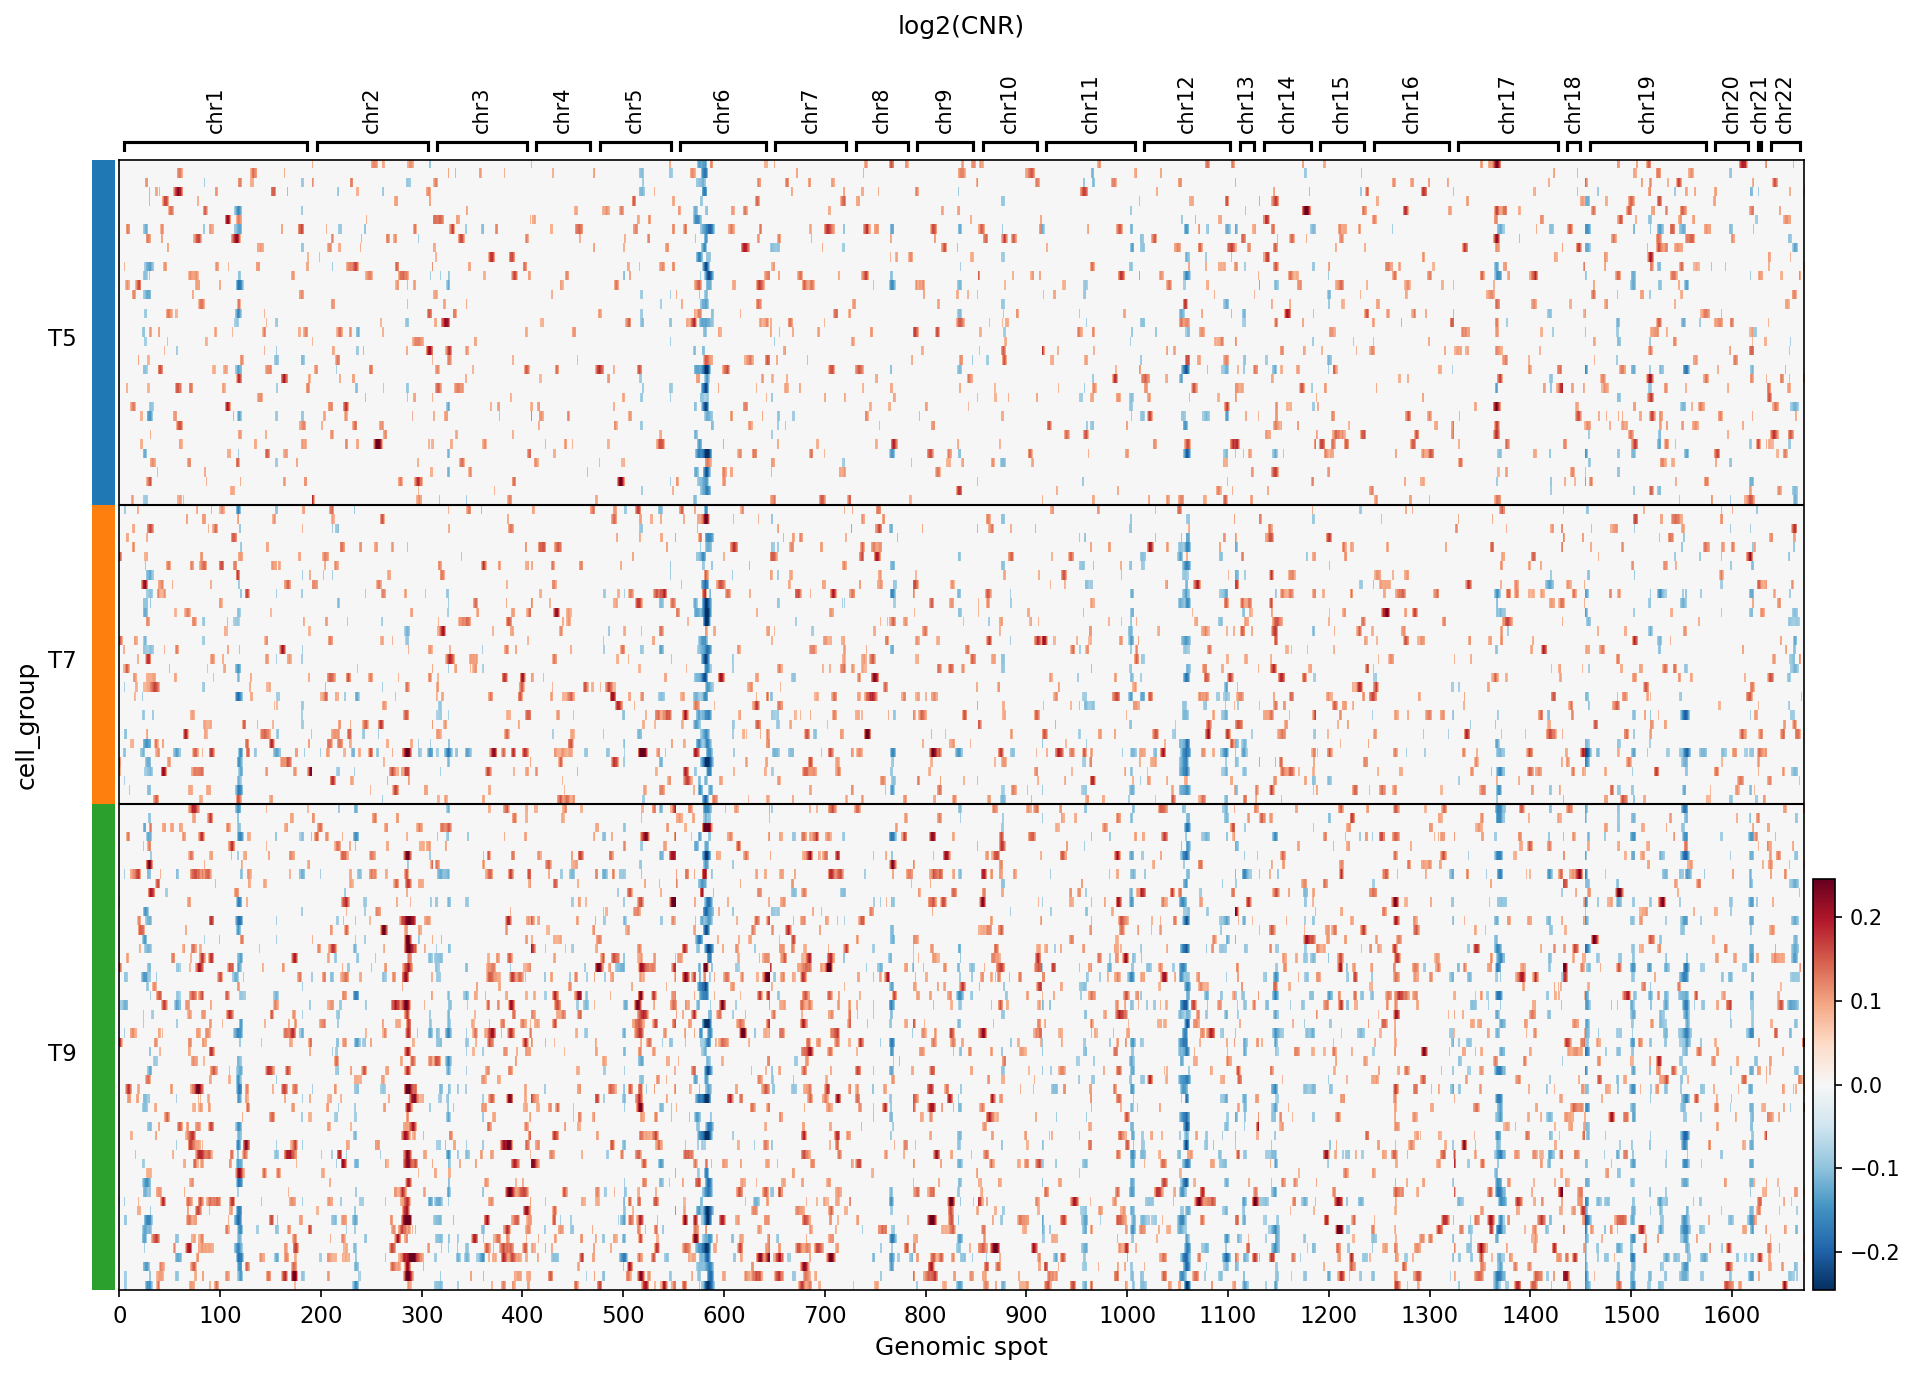
This analysis provides a visual and summarized interpretation of copy number variations (CNVs) in Renal Epithelial cell (identified as the tumor-origin cell type in kidney tissue) and unassigned cell populations. Cells are grouped by sample and further categorized by their inferred ploidy status and condition (e.g., Diploid N for normal samples, Diploid T for tumor samples). The primary objective is to identify and characterize genomic instability patterns, particularly amplifications and deletions, in tumor-origin cells and to shed light on the nature of unassigned cell clusters based on their genomic profiles.
Visual Summary
The heatmap visualizes the log2(CNR) (log2 ratio of copy number) across genomic spots for thousands of individual cells, with red/yellow indicating copy number amplifications and blue indicating deletions.
- Renal Epithelial Cells from Normal Samples (Diploid N): The cells designated as "Diploid N" (representing Renal Epithelial cell from adjacent normal tissue samples) generally exhibit a stable genomic profile with minimal to no significant copy number alterations, as expected for healthy cells.
- Renal Epithelial Cells from Tumor Samples (Diploid T): In stark contrast, "Diploid T" cells (representing Renal Epithelial cell from tumor tissue samples) display widespread and distinct CNV patterns across multiple samples (e.g., T1 through T9).
- Recurring amplifications (red/yellow regions) are prominently observed across several tumor samples, particularly on chromosome 5q, 7q, 11q, and 12q.
- Notably, many tumor samples also exhibit clear deletions (blue regions) on chromosome 3p (the region at the beginning of chromosome 3), a well-established hallmark of renal cell carcinoma.
- Unassigned Cells: The 'unassigned' cell population is plotted separately below the main Renal Epithelial cell groups.
- 'Unassigned' cells derived from normal samples (N1-N9) largely maintain a diploid and stable genomic profile, mirroring the 'Diploid N' Renal Epithelial cells.
- Crucially, 'unassigned' cells from tumor samples (T1-T9) exhibit CNV patterns remarkably similar to the 'Diploid T' Renal Epithelial cells from their respective samples. This genomic similarity is particularly evident in samples T5, T7, and T9, where the patterns of amplification and deletion in 'unassigned' cells closely resemble those of the classified tumor-origin cells.
- CNV Summary Table: The supplementary heatmap and bar chart summarize significantly amplified cytogenetic bands for a subset of samples (N7, T5, T7, T9).
- Sample N7 (a normal sample) shows negligible amplification in the highlighted regions.
- Tumor samples T5, T7, and T9 exhibit high frequencies of amplification in specific regions, with 5q23.2:5q31.3 and 5q35.1:5q35.3 showing the highest frequency (1.00) of amplification across these tumor samples. Other highly amplified regions include 12q13.12:12q13.13 (0.75 frequency), 1p34.1:1p33, 2q32.3:2q34, 4q24:4q26, 7q31.1:7q32.2, and 11q23.1:11q23.3.
Biological Interpretation
The observed CNV patterns provide significant biological insights into the genomic landscape of renal tumors and help clarify the identities of cell populations within the single-cell dataset.
- Tumor-Specific Genomic Instability: Renal Epithelial cell from tumor samples (Diploid T) display widespread genomic instability, a characteristic feature of cancer cells. The recurrent amplifications on chromosomes 5q, 7q, 11q, and 12q, coupled with deletions on 3p, are highly consistent with known chromosomal aberrations frequently found in clear cell renal cell carcinoma (ccRCC), the most common type of kidney cancer [PubMed Search: "clear cell renal cell carcinoma CNV" - PubMed Search].
- The deletion of 3p is particularly important, as it often involves the *VHL* tumor suppressor gene, a key driver in the pathogenesis of ccRCC [GeneCards: VHL Gene - GeneCards].
- Amplifications on 5q are often observed in various cancers and can harbor oncogenes such as *MAPK9* and *SKP2* [GeneCards: MAPK9 Gene - GeneCards, GeneCards: SKP2 Gene - GeneCards].
- Amplifications on 12q, specifically in regions like 12q13.12-12q13.13 and 12q13.13-12q14.1, can encompass important oncogenes such as *MDM2* and *CDK4*, which play critical roles in cell cycle regulation and are frequently amplified in various malignancies [GeneCards: MDM2 Gene - GeneCards, GeneCards: CDK4 Gene - GeneCards].
- Validation of Cell Type Annotation: The clear distinction in CNV profiles between Renal Epithelial cell from normal and tumor tissues provides strong evidence for the accuracy of their annotations and firmly establishes the malignant nature of the Diploid T population.
- Clarification of 'Unassigned' Cell Populations: The striking similarity in CNV patterns between 'unassigned' cells from tumor samples and the classified tumor-origin Renal Epithelial cell population strongly suggests that a significant fraction of these 'unassigned' cells are, in fact, malignant cells. These cells might represent tumor cell subpopulations with divergent transcriptional profiles that led to their initial 'unassigned' status, or they could be tumor cells undergoing dedifferentiation or epithelial-mesenchymal transition, thereby losing typical epithelial markers while retaining tumor-specific genomic aberrations. This finding underscores the importance of integrating genomic data, such as CNVs, for validating and refining cell type annotations, especially within complex and heterogeneous tumor microenvironments. Conversely, the stable diploid state of 'unassigned' cells from normal samples further reinforces their likely non-malignant origin.
Clinical or Translational Implications
The identification of recurrent, tumor-specific CNVs in Renal Epithelial cell from tumor samples provides valuable insights into the genomic drivers of kidney cancer, potentially serving as robust genomic biomarkers for diagnosis and prognosis. The alignment of these CNV patterns with well-established aberrations in ccRCC validates the relevance of this dataset for understanding kidney cancer biology. Furthermore, the revelation that a subset of 'unassigned' cells within tumor samples exhibit malignant CNV profiles highlights a crucial challenge in single-cell data annotation. This suggests that relying solely on transcriptional profiles might lead to misclassification or underestimation of tumor cell heterogeneity. Integrating CNV information can significantly enhance the accuracy of cell type classification in tumor studies, leading to a more comprehensive understanding of tumor heterogeneity and potentially facilitating the identification of novel therapeutic targets within these genomically altered regions, especially in populations that might otherwise be overlooked.
5. CNV-based UMAP Visualization of Kidney Single-Cell RNA-seq Data
[Analysis Visualization Results]...
Analysis Overview
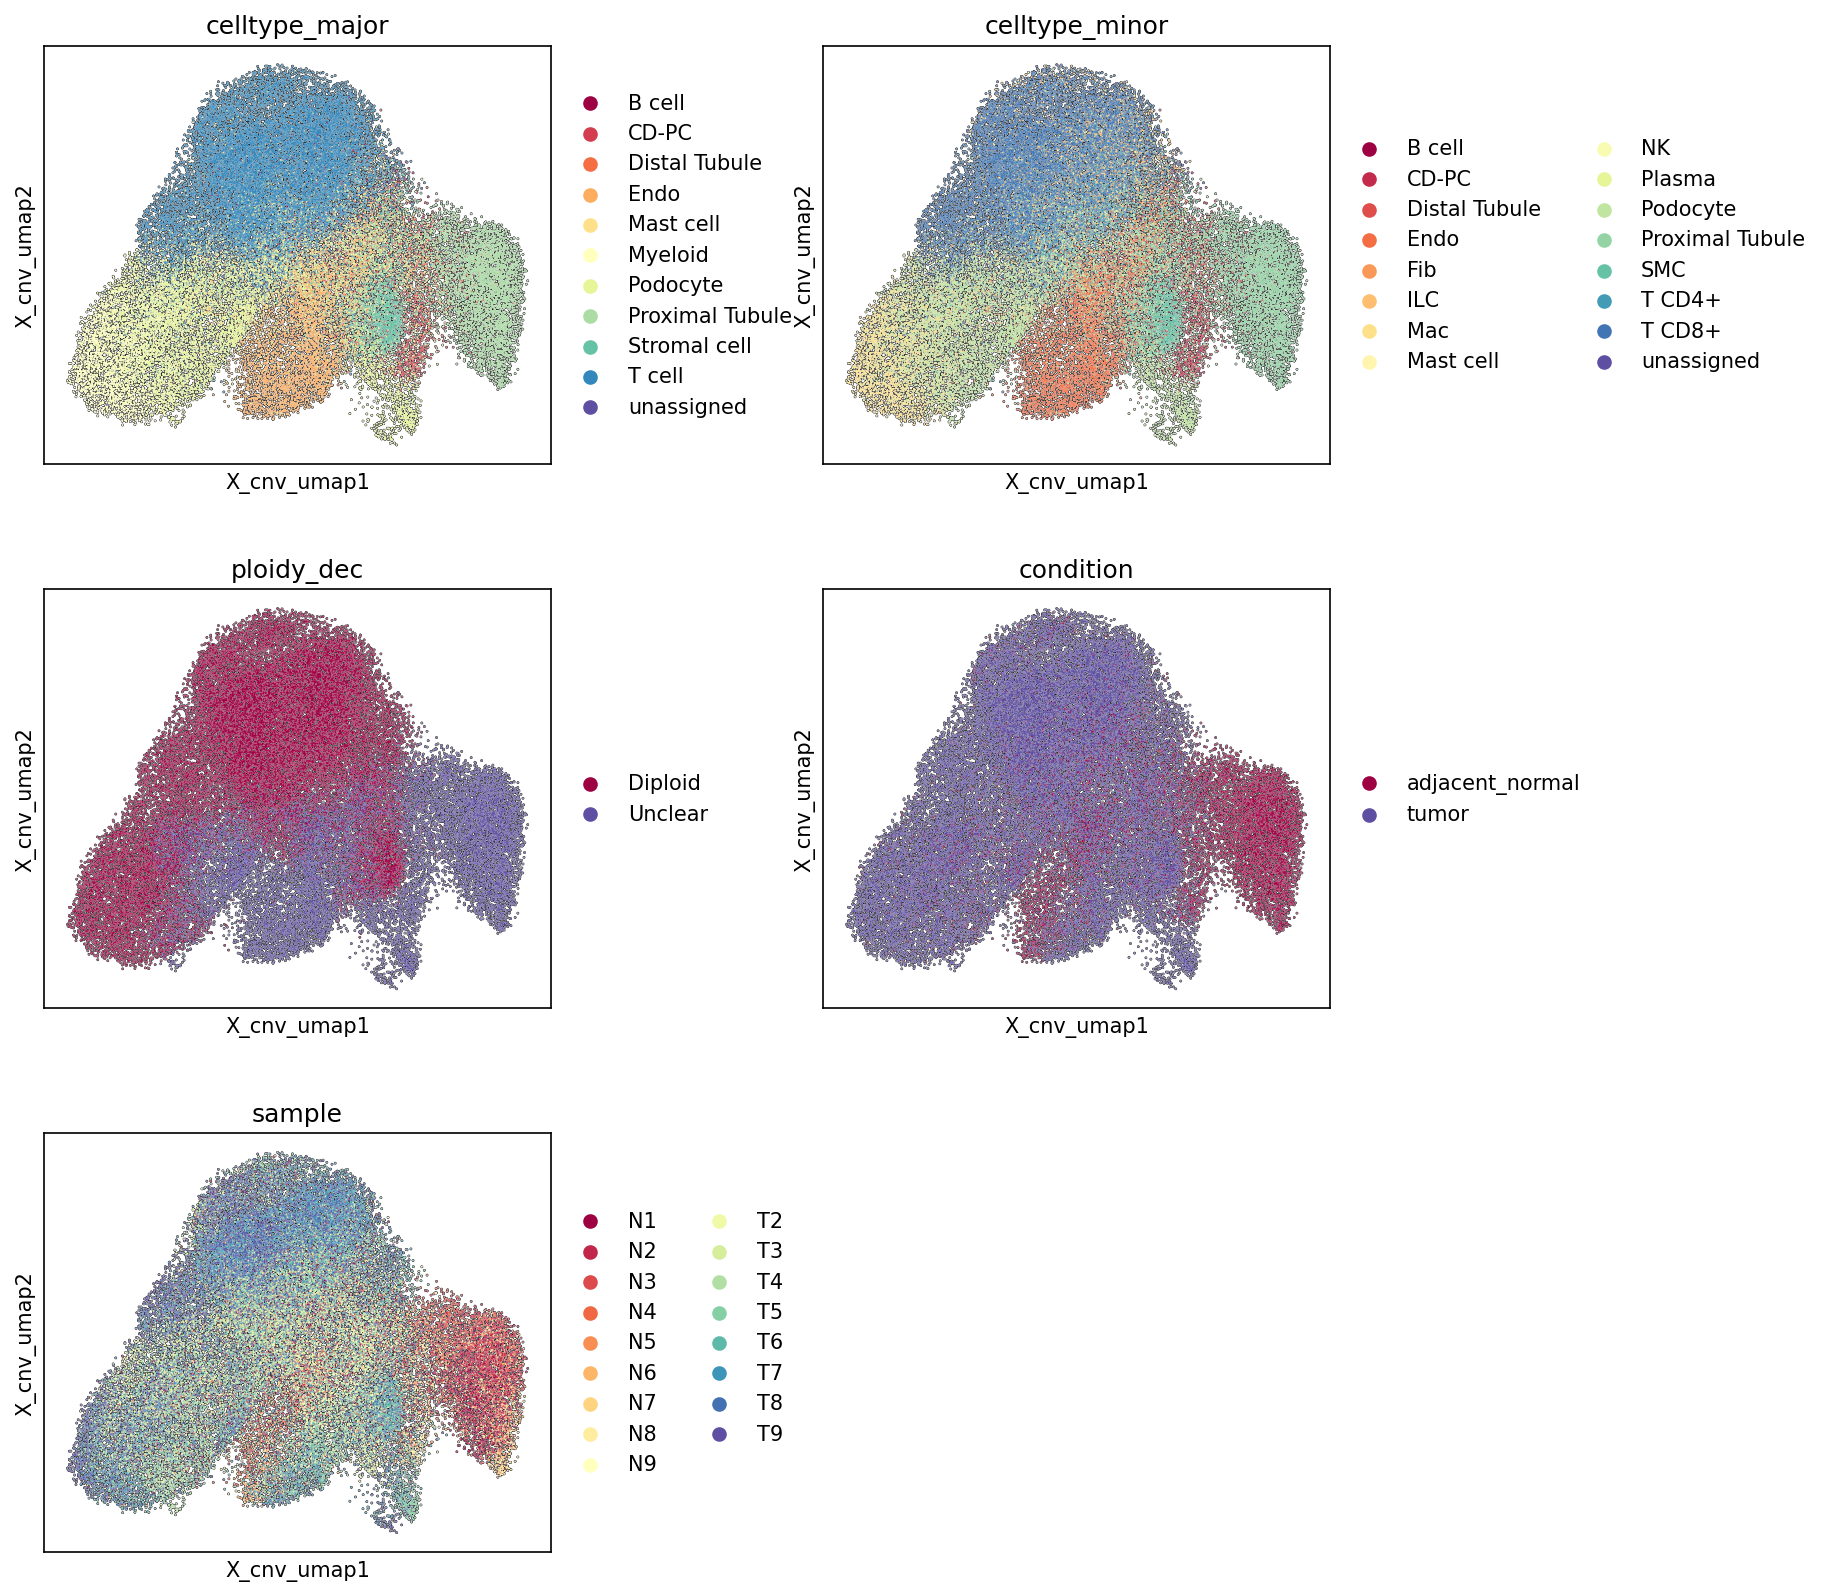
This analysis presents a Uniform Manifold Approximation and Projection (UMAP) embedding of single-cell RNA-seq data from kidney tissue, computed specifically using inferred Copy Number Variation (CNV) estimates (obsm['X_cnv']). The resulting UMAP plots are colored by major cell type, minor cell type, ploidy status, tissue condition (tumor vs. adjacent normal), and individual sample to provide a comprehensive overview of how genomic alterations structure the cellular landscape of the dataset.
Visual Summary
- CNV-driven Clustering: The UMAP projections clearly delineate distinct cellular populations based on their inferred CNV profiles. A large, broadly distributed cluster occupies the central and left regions of the UMAP, while a separate, more compact cluster is prominent in the lower-right section.
- Ploidy Decisively Shapes UMAP: The ploidy_dec plot shows a strong correlation with the UMAP structure. The extensive central-to-left cluster is overwhelmingly composed of "Diploid" cells. In contrast, the distinct lower-right cluster is almost exclusively populated by "Aneuploid" cells, indicating that large-scale chromosomal alterations are a primary driver of this separation. A smaller group of "Unclear" ploidy cells is sparsely distributed, mostly within the diploid regions.
- Condition-Specific Segregation: The condition plot demonstrates a marked partitioning of cells based on their tissue origin. The "tumor" condition cells are highly enriched within the "Aneuploid" cluster and also intermix with "adjacent_normal" cells in the more central, "Diploid" regions. "Adjacent_normal" cells are predominantly found within the large "Diploid" cluster, with minimal presence in the distinct "Aneuploid" tumor cell cluster.
Cell Type Alignment with CNV/Condition:
- celltype_major: Renal Epithelial cells (labeled "Renal.Epi") are predominantly localized to the "Aneuploid" region, consistent with their identification as the tumor-origin cell type in kidney cancer. Immune cells (Myeloid, T cell, B cell), Stromal cells, and Endothelial cells are primarily distributed throughout the "Diploid" regions, as expected for non-malignant cells.
- celltype_minor: A more granular view confirms that specific renal epithelial subtypes such as Proximal Tubule, Distal Tubule, Collecting Duct Principal cells, and Podocytes are concentrated within the aneuploid cluster, reinforcing their likely malignant identity. Other minor cell types (e.g., Macrophage, T cell CD8+, Fibroblast, Endothelial cell) are widely represented in the diploid areas.
- Sample Distribution: The sample plot shows a reasonable mixing of cells from different individual samples (N1-N9, T1-T9) across the diploid regions, suggesting that technical batch effects are not the dominant factor shaping the overall UMAP structure. However, the aneuploid (tumor) cluster appears to have varying contributions from different "T" (tumor) samples, hinting at inter-patient heterogeneity in tumor cell populations.
Biological Interpretation
The CNV-based UMAP provides robust evidence for distinguishing distinct cellular states, primarily driven by chromosomal integrity, with profound biological implications for kidney cancer.
- Identification of Malignant Cells: The clear and consistent co-localization of "Aneuploid" cells, "tumor" cells, and "Renal Epithelial cells" into a single, distinct UMAP cluster strongly indicates that this cluster represents the malignant population within the kidney tissue. Aneuploidy is a hallmark of most solid tumors, including renal cell carcinoma, reflecting chromosomal instability and abnormal genomic content PubMed search: aneuploidy cancer biomarker. The data aligns perfectly with the specified Tumor origin celltype: Renal Epithelial cell.
- Characterization of the Tumor Microenvironment: The large "Diploid" cluster encompasses a diverse range of immune cells (T cells, Myeloid cells, B cells), stromal cells (Fibroblasts, Smooth muscle cells), and endothelial cells, which are present in both tumor and adjacent normal conditions. These cells constitute the non-malignant components of the tumor microenvironment (TME) and normal kidney tissue. Their diploid status confirms they are likely host cells responding to or co-existing with the tumor, rather than transformed malignant cells PubMed search: tumor microenvironment single cell.
- Differentiation from Normal Kidney Parenchyma: Normal renal epithelial cells (e.g., Proximal Tubule, Distal Tubule, Podocytes) are observed in the diploid regions, predominantly within the adjacent normal tissue, but also in the tumor samples. This confirms that the CNV-based embedding effectively discriminates between normal and malignant epithelial components.
- Inter-patient Tumor Heterogeneity: While the UMAP shows good mixing of non-malignant cells, potential variations in sample representation within the aneuploid cluster may suggest patient-specific differences in the genomic profiles or clonal architecture of the tumors, which is a common feature of cancer progression and response to therapy PubMed search: tumor heterogeneity renal cell carcinoma.
Annotation Notes
- The presented CNV UMAP provides excellent validation for cell type annotations, particularly in accurately identifying and distinguishing malignant Renal Epithelial cells from all other stromal, immune, and normal epithelial cell populations.
- The strong concordance between CNV status (ploidy), tissue condition, and cell type identity confirms the quality of both the CNV inference and the cell type annotation pipeline for this dataset.
- The "Unclear" ploidy calls are generally minor and dispersed among diploid cells, suggesting they might represent cells with ambiguous CNV signals or technical noise rather than a distinct biological state.
6. Minor Cell Type Population Analysis in Kidney Tumor vs. Adjacent Normal Tissue
[Analysis Visualization Results]...
Analysis Overview
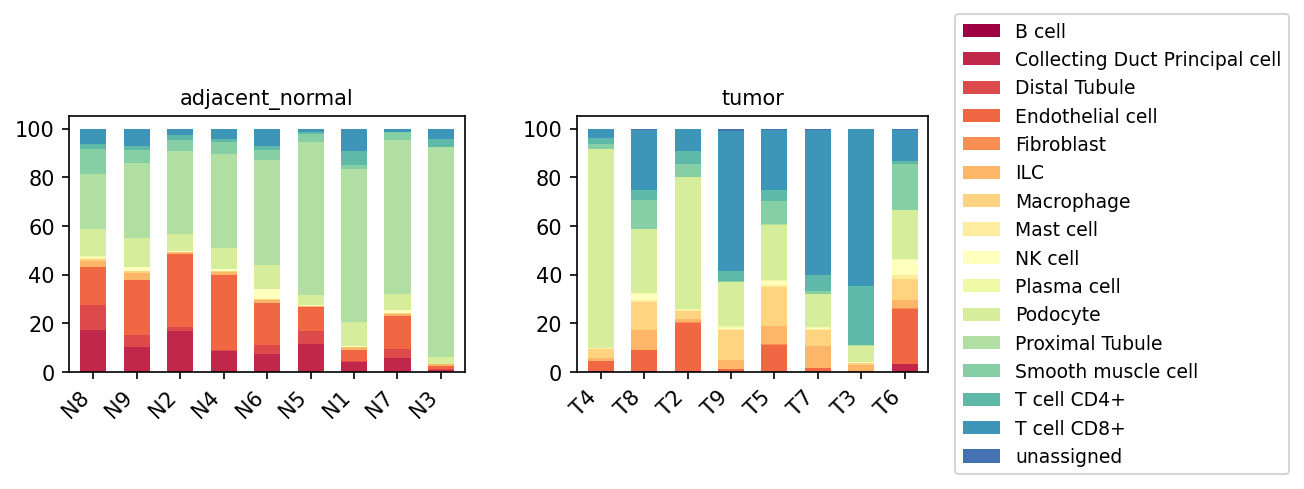
This analysis investigates the relative proportions of different minor cell types in kidney tissue, comparing samples from renal tumors with those from adjacent normal tissue using single-cell RNA sequencing data. The bar plots display the percentage of each cell type within individual samples, providing insight into the cellular composition shifts associated with kidney cancer.
Visual Summary
The visualization presents two grouped bar plots, one for "adjacent_normal" samples and one for "tumor" samples. Each bar represents a distinct sample, and the colored segments within each bar denote the proportion of different minor cell types.
- Adjacent Normal Tissue:
- Proximal Tubule cells (light green) are the overwhelmingly dominant cell type, consistently constituting a large majority (often >60-70%) across all adjacent normal samples (e.g., N2, N4, N6, N5, N1, N7, N3).
- Other renal epithelial cells like Distal Tubule (orange-red), Thick Ascending Limb (dark blue), Collecting Duct Principal cell (darker red), Podocyte (lime green), and Intercalated cell (light orange-yellow) are present but in significantly smaller proportions.
- Immune cells such as Macrophages (yellow) and T cells (CD4+ and CD8+) (teal shades), and stromal cells like Endothelial cells (orange) and Fibroblasts (peach), are present in minor fractions, reflecting the normal homeostatic cellular environment.
- The cellular composition appears relatively consistent across different adjacent normal samples.
- Tumor Tissue:
- A dramatic reduction in Proximal Tubule cells is observed in most tumor samples, often becoming a minor component or almost absent (e.g., T4, T8, T2, T9). This indicates a significant loss or replacement of normal kidney parenchymal cells in the tumor microenvironment.
Immune cell infiltration is notably increased
- Macrophages (yellow) show a substantial increase in proportion in most tumor samples, often reaching 10-30% of the total cells (e.g., T4, T8, T2, T9, T5, T7).
- T cells (CD4+ and CD8+) (teal shades) also appear to be enriched in many tumor samples compared to normal tissue.
- Other immune cells like B cells (dark red) and Plasma cells (light yellow-green) may also show subtle increases in certain tumor samples.
- Endothelial cells (orange) and Fibroblasts (peach) appear to be more prominent in tumor samples, suggesting active angiogenesis and stromal remodeling.
- There is greater heterogeneity in cell type composition among tumor samples compared to normal samples. While most show immune enrichment and loss of normal epithelial cells, some tumors (e.g., T3, T6) retain a relatively higher proportion of what appears to be Proximal Tubule cells or other renal epithelial cells, alongside significant immune infiltration.
- The 'unassigned' cell population (dark blue) also appears more prevalent in some tumor samples, which could represent highly aberrant cells, including malignant cells not confidently classified into known categories, or other highly perturbed cell states.
Biological Interpretation
The observed shifts in cell population proportions provide crucial insights into the biology of kidney cancer.
- Parenchymal Loss and Malignant Transformation: The striking decrease in Proximal Tubule cells in tumor tissue reflects the displacement and destruction of normal kidney functional units by the expanding tumor mass. Given that "Renal Epithelial cell" is identified as the tumor origin cell type, the reduction in healthy renal epithelial cells (like Proximal Tubule cells) is expected as tumor cells proliferate. The 'unassigned' population in tumors might encompass tumor cells that have undergone significant dedifferentiation or phenotypic shifts, making them difficult to classify using normal kidney cell markers.
- Profound Immune Microenvironment Remodeling: The consistent and substantial increase in Macrophages and T cells (CD4+ and CD8+) within the tumor microenvironment (TME) is a hallmark of immune infiltration in kidney cancer, such as Renal Cell Carcinoma (RCC).
- Tumor-associated macrophages (TAMs) are known to be key players in cancer progression, often adopting pro-tumoral phenotypes that promote angiogenesis, immune suppression, and metastasis PMID: 33790589. Their enrichment here is a significant finding.
- The presence of T cells indicates an ongoing immune response, although their functional status (e.g., activated vs. exhausted) requires further investigation through differential gene expression or functional assays. Both CD4+ helper T cells and CD8+ cytotoxic T lymphocytes are critical for anti-tumor immunity, but their efficacy can be blunted within the immunosuppressive TME.
- Stromal Contributions to Tumor Progression: The increased proportions of Endothelial cells and Fibroblasts in the tumor samples are consistent with extensive stromal remodeling.
- Endothelial cell expansion is indicative of neo-angiogenesis, the formation of new blood vessels, which is essential for tumor growth and metastasis by supplying nutrients and oxygen PMID: 29713028.
- Fibroblasts, particularly cancer-associated fibroblasts (CAFs), contribute to extracellular matrix remodeling, create a pro-tumorigenic niche, and modulate immune responses within the TME PMID: 30978648.
Clinical or Translational Implications
- Biomarker Potential: The distinct changes in immune cell populations, particularly the significant increase in macrophages and T cells, could serve as important diagnostic or prognostic biomarkers for kidney cancer. For instance, specific densities or activation states of TAMs are often correlated with patient outcomes and response to therapy in various cancers PMID: 33790589.
- Immunotherapeutic Relevance: The prominent immune cell infiltration highlights the potential utility of immunotherapy in kidney cancer. Understanding the specific phenotypes and functional states of these immune cells (e.g., using GSEA or DEG analyses on these cell types) is crucial for identifying specific immune checkpoints or pathways to target for more effective treatments. Targeting TAMs, for example, is an emerging strategy to enhance anti-tumor immunity.
- Therapeutic Target Identification: The increased presence of endothelial cells and fibroblasts suggests that anti-angiogenic therapies or strategies targeting CAFs might be relevant. The interplay between these stromal components and immune cells could also reveal novel combinatorial therapeutic approaches.
- Tumor Heterogeneity and Personalized Medicine: The observed variability in cellular composition among different tumor samples underscores the heterogeneous nature of kidney cancer. This emphasizes the need for personalized approaches to diagnosis and treatment, where the specific cellular landscape of an individual's tumor might dictate the most effective therapeutic strategy.
7. 신장 조직 내 T 세포 하위 집단 분석
[Analysis Visualization Results]...
Analysis Overview
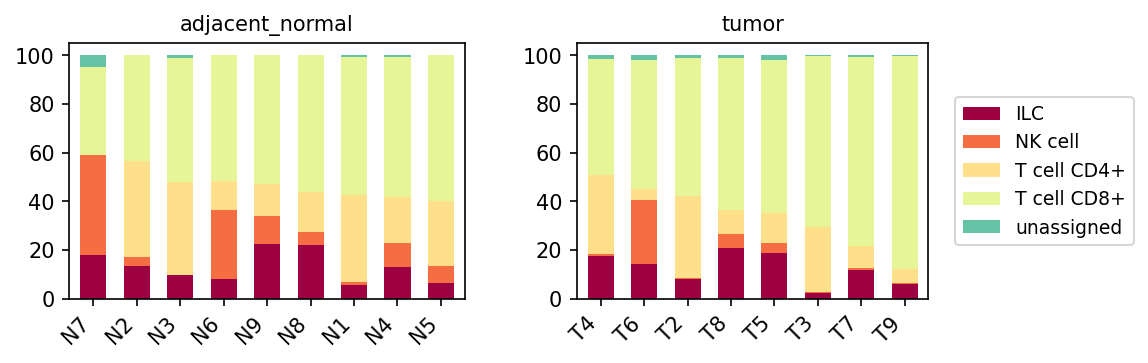
이 분석은 신장 조직의 인접 정상(adjacent normal) 및 종양(tumor) 샘플에서 T 세포(CD8+ T 세포와 CD4+ T 세포 포함) 하위 집단 구성의 상대적 비율을 시각화한 것입니다. 각 샘플별로 다양한 T 세포 아형(예: Cytotoxic, Naive, Th1, Treg 등)의 비율을 비교하여, 종양 미세환경에서 T 세포 면역 반응의 특성을 이해하는 데 중점을 둡니다.
Visual Summary
제공된 막대 그래프는 인접 정상 조직과 종양 조직 간의 T 세포 하위 집단 구성을 명확하게 보여줍니다.
- 지배적인 T 세포 아형: 두 조건 모두에서 'T cell (Cytotoxic)'(진한 와인색)이 전체 T 세포 집단에서 가장 높은 비율을 차지합니다. 특히 종양 샘플(T2, T3, T5, T8, T7, T6, T9)에서는 Cytotoxic T 세포의 비율이 80~90% 이상으로 인접 정상 조직보다 더욱 증가하는 경향을 보입니다.
- 인접 정상 조직(adjacent_normal): Cytotoxic T 세포가 약 60~85%를 차지하며, 'T cell (Naive)'(적갈색)이 그 다음으로 높은 비율(약 10~20%)을 보입니다. 'T cell (Th1)'(밝은 주황색)과 'T cell (Th17)'(옅은 노란색)도 소량 존재하며, 다른 T 세포 하위 집단(Tfh, Th2, Th22, Th9, Treg)은 매우 낮은 비율을 보입니다.
- 종양 조직(tumor): Cytotoxic T 세포의 비율이 인접 정상 조직 대비 전반적으로 더욱 높아지는 경향을 보이며, 이는 암 미세환경 내에서 강한 세포독성 반응이 유도되고 있음을 시사합니다. 반면, 'T cell (Naive)'를 포함한 다른 Helper T 세포 아형(Th1, Th17 등)의 상대적 비율은 Cytotoxic T 세포의 압도적인 증가로 인해 전반적으로 감소한 것처럼 보입니다.
- Regulatory T cell (Treg): 'T cell (Treg)'(청록색)은 두 조건 모두에서 낮은 비율을 차지하지만, 일부 종양 샘플(예: T4, T2)에서는 인접 정상 샘플보다 미미하게 높은 비율을 보이는 경향이 관찰됩니다.
Biological Interpretation
이러한 관찰 결과는 신장 종양 미세환경에서 T 세포 매개 면역 반응에 대한 중요한 통찰력을 제공합니다.
- 강화된 세포독성 T 세포 반응: 종양 미세환경에서 Cytotoxic T 세포의 현저한 증가와 지배는 신장암에 대한 강력한 항종양 면역 반응이 활성화되어 있음을 시사합니다. Cytotoxic T 세포, 주로 CD8+ T 세포는 암세포를 직접 인식하고 사멸시키는 핵심 면역 세포입니다 PubMed search: CD8 T cells in cancer immunity.
- Naive T 세포 감소 및 T 세포 활성화: 종양 내 Naive T 세포의 상대적 감소는 T 세포가 항원을 만나 활성화되고 증식하여 이펙터 T 세포(예: Cytotoxic T 세포)로 분화되었거나, 종양 미세환경으로 활성화된 이펙터 T 세포가 선택적으로 유입되었음을 나타낼 수 있습니다.
- 조절 T 세포 (Treg)의 역할: 비록 전체 T 세포 집단 내에서 그 비율이 낮지만, 종양 샘플에서 Treg 세포의 미미한 증가는 주목할 만합니다. Treg 세포는 면역 반응을 억제하고 종양의 면역 회피에 기여하는 것으로 잘 알려져 있어 GeneCards: FOXP3, 이는 종양 미세환경이 면역 억제적 특성을 가지고 있음을 시사합니다.
- T helper 세포 아형의 변화: Th1, Th17 등 다른 T helper 세포 아형의 상대적 감소는 Cytotoxic T 세포의 압도적인 증가에 따른 상대적인 비율 변화일 수 있으며, 종양 미세환경이 특정 T helper 세포 반응을 억제하거나 다른 유형으로 재편하고 있음을 반영할 수도 있습니다.
Clinical or Translational Implications
- 면역 치료 반응 예측 및 표적: Cytotoxic T 세포의 높은 비율은 신장암의 면역원성(immunogenicity)을 나타내며, 이는 면역 관문 억제제(immune checkpoint inhibitors)와 같은 면역 치료에 대한 잠재적 반응성을 시사할 수 있습니다. Cytotoxic T 세포의 풍부함은 여러 암종에서 긍정적인 예후 인자로 간주됩니다 PubMed search: cytotoxic T cells prognostic cancer.
- 면역 억제 극복 전략: 종양 내 Treg 세포의 존재는 이들이 항종양 면역 반응을 억제하는 중요한 요인이 될 수 있음을 의미합니다. 따라서 Treg 세포의 기능을 억제하거나 비율을 조절하는 전략은 Cytotoxic T 세포의 활성을 강화하여 신장암 치료 효과를 높일 수 있는 잠재적 방법이 될 수 있습니다.
- 종양 미세환경의 복합성 이해: 본 분석은 T 세포 하위 집단의 구성 변화를 보여주지만, 이들 세포의 기능적 상태(예: 활성화, 소진, 억제 등)에 대한 추가적인 정보(예: DEG, GSEA)가 동반될 때 더욱 포괄적인 임상적 이해가 가능할 것입니다. 이러한 정보는 특정 환자 그룹에 맞는 맞춤형 면역 치료 전략 개발에 기여할 수 있습니다.
8. 신장 종양 미세환경 내 대식세포 하위 집단 비율 변화 분석
[Analysis Visualization Results]...
Analysis Overview
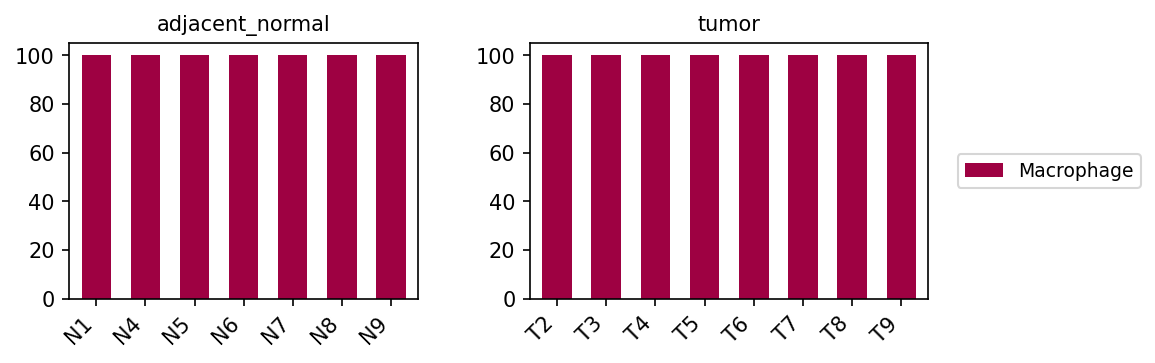
이 분석은 단일 세포 RNA 시퀀싱 데이터에서 추출한 대식세포(Macrophage) 하위 집단(M1, M2A, M2B, M2C, M2D)의 비율을 신장 조직의 인접 정상(adjacent_normal) 부위와 종양(tumor) 부위 간에 비교한 결과를 시각화합니다. 각 샘플(N for normal, T for tumor) 내 전체 대식세포 중 각 하위 집단이 차지하는 비율을 나타내는 누적 막대 그래프를 통해 조건별 대식세포 아형 구성 변화를 평가합니다.
Visual Summary
제공된 누적 막대 그래프는 인접 정상 조직과 종양 조직에서 대식세포의 하위 집단 구성에 뚜렷한 차이를 보여줍니다.
인접 정상 조직(adjacent_normal)에서는
- Macrophage (M1) (진한 자주색)은 전체 대식세포 중 상당 부분을 차지하지만, Macrophage (M2D) (청록색) 역시 높은 비율(일부 샘플에서 30-40% 이상)로 존재하며, 다른 M2 하위 집단(M2A, M2B, M2C)도 다양하게 분포합니다. 이는 정상 신장 조직에서 다양한 대식세포 아형이 균형을 이루고 있음을 시사합니다.
종양 조직(tumor)에서는
- Macrophage (M1) (진한 자주색)의 비율이 인접 정상 조직에 비해 전반적으로 증가하는 경향을 보입니다 (일부 샘플에서 40-50% 이상).
- 반면, Macrophage (M2D) (청록색)의 비율은 인접 정상 조직에 비해 감소하는 경향을 나타냅니다 (일부 종양 샘플에서는 10-20% 미만으로 감소).
- 다른 M2 하위 집단(M2A, M2B, M2C)은 상대적으로 변화의 폭이 크지 않거나 샘플 간에 더 가변적인 비율을 보입니다.
요약하면, 신장 종양 미세환경에서는 인접 정상 조직에 비해 M1 대식세포의 상대적 증가와 M2D 대식세포의 상대적 감소가 관찰됩니다.
Biological Interpretation
대식세포는 그 기능적 특성에 따라 크게 M1 (고전적 활성화)과 M2 (대체 활성화) 하위 집단으로 분류되며, 종양 미세환경(TME)에서 중요한 역할을 수행합니다. M1 대식세포는 주로 염증 유발, 항종양 반응 및 병원체 제거와 관련이 있는 반면, M2 대식세포는 염증 완화, 조직 복구, 면역 억제 및 종양 진행과 관련이 있습니다. https://www.ncbi.nlm.nih.gov/pmc/articles/PMC6982855/
이번 분석 결과는 신장 종양 미세환경에서 대식세포의 극성(polarization)이 변화하고 있음을 보여줍니다.
- Macrophage (M1) 비율 증가: 종양 내 M1 대식세포의 상대적 증가는 종양에 대한 면역 반응 또는 염증 반응이 활성화되었음을 시사할 수 있습니다. M1 대식세포는 TNF-α, IL-1β, IL-6, IL-12와 같은 전염증성 사이토카인을 분비하여 종양 세포를 직접 공격하거나 T 세포 반응을 유도할 수 있습니다. 그러나 종양 미세환경의 복잡성으로 인해 M1 대식세포가 존재하더라도 그 기능이 억제되거나 종양 성장을 촉진하는 다른 역할로 전환될 수도 있습니다.
- Macrophage (M2D) 비율 감소: M2D 대식세포는 M2 아형 중 하나로, 주로 면역 억제, 혈관 신생 및 종양 증식 촉진과 관련된 역할을 하는 것으로 알려져 있습니다. 종양 조직에서 M2D 대식세포의 비율이 감소하는 것은 특정 면역 억제 경로의 변화를 나타낼 수 있습니다. 이는 다른 M2 하위 집단 또는 다른 면역 세포 유형이 종양 내 면역 억제 기능을 주도하고 있거나, 이 특정 M2D 아형이 신장 종양 미세환경에서는 덜 우세한 역할을 할 수 있음을 의미할 수 있습니다.
이러한 대식세포 하위 집단의 변화는 신장암의 면역 감시 또는 면역 회피 메커니즘에 대한 중요한 통찰력을 제공합니다. 전체 대식세포 모집단에서 특정 하위 집단의 상대적 변화는 종양 진행 단계나 환자의 면역 반응 상태를 반영할 수 있습니다.
Clinical or Translational Implications
신장 종양 미세환경 내 대식세포 하위 집단의 변화는 임상적으로 중요한 의미를 가질 수 있습니다.
- 면역 치료 반응 예측 바이오마커: M1/M2 대식세포의 비율 변화는 신장암 환자의 면역 관문 억제제(immune checkpoint inhibitor)와 같은 면역 치료 반응을 예측하는 바이오마커로 활용될 가능성이 있습니다. 예를 들어, M1 대식세포의 상대적 증가는 잠재적으로 더 강력한 항종양 면역 반응을 나타낼 수 있으나, 그 효과적인 기능 발휘 여부는 추가 연구가 필요합니다.
- 표적 치료 전략 개발: 특정 대식세포 하위 집단의 동태를 이해하는 것은 신장암 치료를 위한 새로운 표적 치료 전략 개발에 기여할 수 있습니다. 예를 들어, 종양 내 M1 대식세포의 기능을 강화하거나, 여전히 존재하는 M2 하위 집단의 면역 억제 기능을 약화시키는 전략이 고려될 수 있습니다.
이러한 결과는 대식세포 극성 변화의 메커니즘과 신장암 진행에 미치는 영향을 추가적으로 연구할 필요성을 강조하며, 향후 맞춤형 면역 치료 전략 개발의 기반이 될 수 있습니다.
9. Macrophage M2A Subpopulation Analysis in Kidney Tumor Microenvironment
[Analysis Visualization Results]...
Analysis Overview
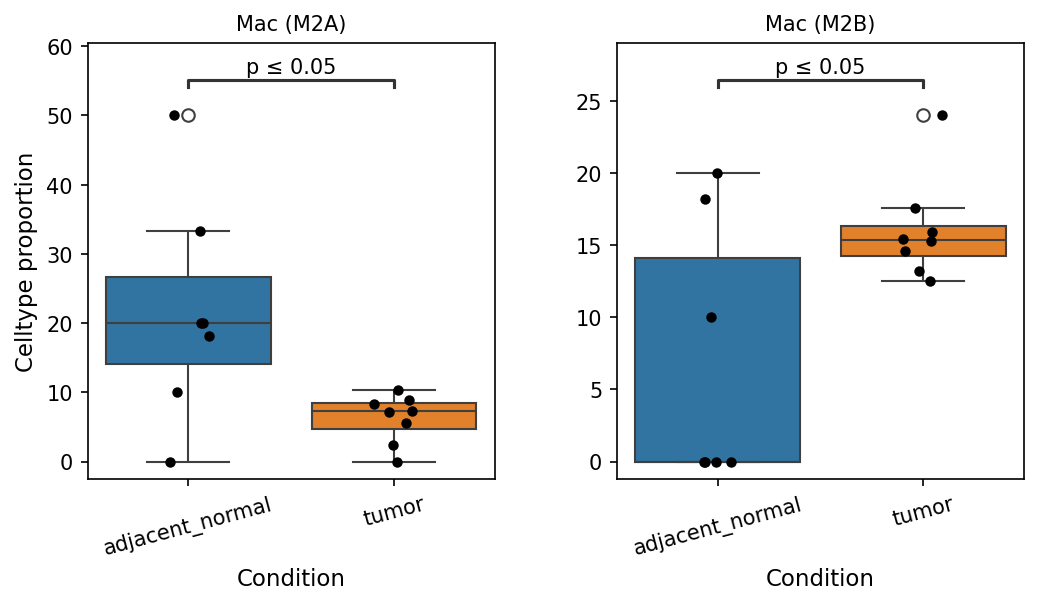
This analysis presents a boxplot visualizing the proportion of Macrophage (M2A) cells, a specific macrophage subset, when comparing kidney tumor tissue to adjacent normal kidney tissue. The proportions were derived from single-cell RNA-seq data, and a statistical test was performed to identify significant differences between the two conditions, revealing a trending difference (p=0.07).
Visual Summary
The boxplot illustrates the celltype proportion of Macrophage (M2A) across 'adjacent_normal' and 'tumor' conditions.
- The median proportion of Macrophage (M2A) cells appears higher in the adjacent_normal tissue compared to the tumor tissue. Specifically, the median for adjacent_normal is approximately 13-14%, while for tumor it is around 7-8%.
- The interquartile range (IQR) for adjacent_normal is also slightly wider, indicating more variability in this group.
- Individual data points (black dots) are plotted, showing the distribution of samples within each condition. Two samples in the adjacent_normal group show proportions notably lower (near 0%) and higher (near 32%) than the main cluster of points, potentially indicating patient-specific variability or biological outliers.
- A p-value of 0.07 is indicated above the boxes, suggesting a trend towards a statistically significant decrease in Macrophage (M2A) proportion in tumor tissue compared to adjacent normal tissue.
Biological Interpretation
Macrophages are a critical component of the immune microenvironment and exhibit high plasticity, polarizing into various subtypes with distinct functions. M2 macrophages are generally associated with anti-inflammatory responses, tissue repair, and, notably, promotion of tumor growth, angiogenesis, and immune suppression in the context of cancer.
The finding that Macrophage (M2A) proportions are *trending lower* in kidney tumor tissue compared to adjacent normal tissue (p=0.07) is intriguing. M2A macrophages are typically polarized by Th2 cytokines like IL-4 and IL-13 and are often involved in allergic reactions, parasitic infections, and wound healing. In the tumor microenvironment, while overall M2-like macrophages (Tumor-Associated Macrophages, TAMs) are frequently enriched and are generally considered pro-tumoral, the specific dynamics of M2A within the kidney cancer context might differ.
This observed decrease in M2A could suggest several possibilities:
- Shift in Macrophage Polarization: Rather than an overall reduction in M2-like macrophages, there might be a shift from the M2A subtype to other M2 subtypes (e.g., M2B, M2C, M2D, which are also present in the celltype_subset annotations) or even M1 (classically activated, pro-inflammatory) phenotypes within the tumor microenvironment. This shift would imply that different M2 subsets are dominant in different conditions, potentially reflecting distinct functional demands or signaling landscapes.
- Specific Homeostatic Role in Normal Tissue: M2A macrophages might play a specific homeostatic or tissue-repair role in healthy kidney tissue that is either lost, altered, or replaced by other immune cells or macrophage subtypes during oncogenesis.
- Context-Dependent Roles: The role of specific macrophage subtypes can vary significantly depending on the tissue and cancer type. In some contexts, a decrease in a particular M2 subset might be associated with an altered immune response, which warrants further investigation into the functional implications.
Given the p-value of 0.07, this finding indicates a strong trend but falls just outside the conventional statistical significance threshold of p < 0.05. Therefore, while suggestive, these results warrant further validation and deeper mechanistic exploration to confirm the biological implications of this shift.
Clinical or Translational Implications
The observation of a lower proportion of Macrophage (M2A) in kidney tumors, even if trending, could have potential implications for understanding kidney cancer pathogenesis and designing therapeutic strategies.
- Biomarker Potential: If this difference is validated in larger cohorts, the proportion of M2A macrophages could serve as a potential biomarker for distinguishing tumor from normal tissue, or for prognosis, though its utility would need to be thoroughly assessed.
- Therapeutic Targeting: Understanding the specific macrophage polarization shifts within kidney tumors is crucial for developing targeted immunotherapies. If other pro-tumoral macrophage subtypes are enriched in the tumor in place of M2A, these alternative subtypes might represent more relevant therapeutic targets. Conversely, if M2A cells in normal tissue have a protective role, their decline in tumors might indicate a lost protective mechanism.
- Immune Microenvironment Characterization: This finding contributes to a more nuanced understanding of the complex immune cell landscape in renal cell carcinoma (RCC). Comprehensive characterization of all macrophage subtypes and their functional states will be essential to fully unravel their contributions to tumor progression and response to treatment.
Further research, including functional studies and validation in larger patient cohorts, would be necessary to establish the definitive clinical relevance of this observation.
10. Ploidy Population Analysis in Renal Epithelial and Unassigned Cells Across Kidney Tumor and Adjacent Normal Tissues
[Analysis Visualization Results]...
Analysis Overview
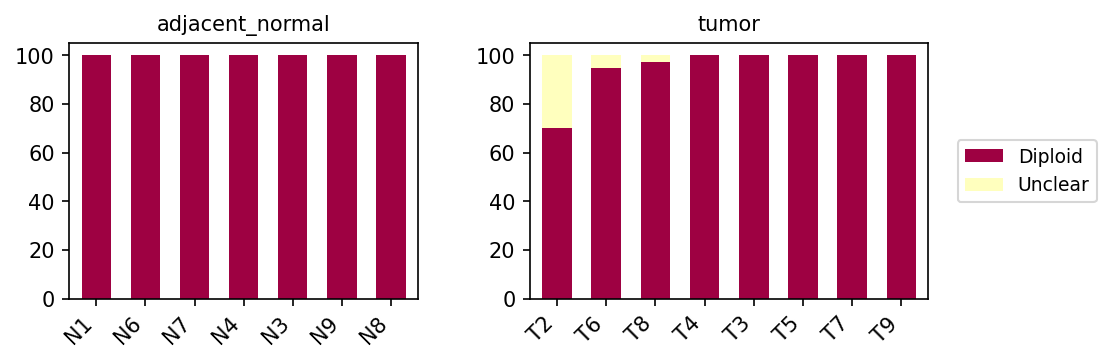
This analysis investigates the ploidy status (Aneuploid, Diploid, or Unclear) of cells classified as 'Renal Epithelial cell' (the presumed tumor origin cell type) and 'unassigned' cells in both tumor and adjacent normal kidney tissue samples. Ploidy, the number of complete sets of chromosomes in a cell, is a fundamental characteristic, and alterations, particularly aneuploidy (an abnormal number of chromosomes), are frequently associated with cancer development and progression. The results are presented as stacked bar plots, showing the proportion of each ploidy status per sample.
Visual Summary
The visualization consists of two panels, one for 'adjacent_normal' samples (N1-N9) and one for 'tumor' samples (T2-T9), each displaying the proportion of Aneuploid, Diploid, and Unclear cells within the combined 'Renal Epithelial cell' and 'unassigned' populations.
- Adjacent Normal Samples: The adjacent normal kidney tissue samples (N1-N9) are overwhelmingly dominated by diploid cells (orange bars), typically constituting over 80% of the population. Aneuploid cells (maroon bars) are present in very low proportions, generally less than 15%, and are completely absent in some normal samples (e.g., N1, N4, N2, N3). A small fraction of cells are categorized as 'Unclear' (light green), usually below 20%.
- Tumor Samples: In contrast, the tumor samples (T2-T9) exhibit a more variable ploidy landscape.
- Several tumor samples (T5, T9, T7) show a notable increase in the proportion of aneuploid cells compared to normal tissue. Specifically, sample T5 has nearly 50% aneuploid cells, while T9 and T7 show approximately 20% aneuploidy.
- Other tumor samples (T6, T2, T4, T8, T3) demonstrate very low or negligible aneuploidy, appearing largely diploid, similar to the adjacent normal samples.
- Diploid cells still constitute a substantial portion of the population across all tumor samples, even in those with high aneuploidy.
- The 'Unclear' proportion remains relatively low across tumor samples, consistent with normal tissues.
Biological Interpretation
The observed ploidy profiles provide critical insights into the genomic stability of renal epithelial cells and unassigned cells within the kidney microenvironment.
- Aneuploidy as a Hallmark of Renal Carcinoma: The distinct increase in aneuploid cell populations in a subset of tumor samples (e.g., T5, T9, T7) strongly suggests the presence of genomic instability, a well-established hallmark of cancer [PubMed Search]. This finding is particularly relevant given that 'Renal Epithelial cell' is identified as the tumor origin cell type in this dataset. Aneuploidy often arises from errors during cell division and can contribute to tumor evolution and heterogeneity.
- Inter-tumor Heterogeneity: The variability in aneuploidy across different tumor samples (some showing high aneuploidy, others low) highlights significant inter-patient heterogeneity in renal cell carcinoma. This suggests that not all tumors rely on widespread aneuploidy as a primary oncogenic driver, or that the degree of aneuploidy varies with tumor stage, grade, or molecular subtype. The "unassigned" cell population could potentially include diverse cell types, including stromal or immune cells that are typically diploid, or poorly classified tumor cells, which might influence the overall observed proportions. However, the presence of distinct aneuploid fractions in tumor samples compared to normal remains a strong indicator of malignancy-associated genetic alterations.
- Diploid Cells in the Tumor Microenvironment: The continued presence of a substantial diploid cell population in tumor samples, even those with high aneuploidy, is expected. These diploid cells likely represent a mix of:
- Non-malignant cells infiltrating the tumor microenvironment (e.g., immune cells, endothelial cells, fibroblasts).
- Normal renal epithelial cells that may be entrapped within the tumor.
- Diploid tumor cell subclones that have not acquired widespread aneuploidy or cells in an early stage of transformation.
- A significant portion of the "unassigned" cell population if it comprises largely non-malignant cells.
Clinical or Translational Implications
- Prognostic Marker: The degree of aneuploidy in renal cell carcinoma can serve as a prognostic indicator. Tumors with higher levels of aneuploidy are often associated with increased tumor aggressiveness, higher grade, and potentially worse clinical outcomes [GeneCards]. Further investigation into the correlation between aneuploidy levels and patient outcomes (e.g., pT stage, recurrence, survival) from the obs metadata would be valuable.
- Therapeutic Stratification: Identifying tumors with high aneuploidy might guide treatment strategies. Patients with highly aneuploid tumors might benefit from therapies targeting cell cycle checkpoints, DNA repair pathways, or those exploiting aneuploidy-induced cellular stress (e.g., synthetic lethality approaches).
- Diagnostic Utility: The significant difference in aneuploidy between a subset of tumor samples and adjacent normal tissues suggests that ploidy analysis could potentially aid in distinguishing malignant from benign renal lesions, especially when integrated with other diagnostic markers.
- Personalized Medicine: The observed inter-patient heterogeneity in aneuploidy emphasizes the need for personalized approaches in managing renal cell carcinoma. Molecular profiling, including ploidy assessment, can help tailor therapies to individual patient tumor characteristics.
11. 신장 종양 미세환경의 세포-세포 상호작용 패턴
[Analysis Visualization Results]...
Analysis Overview
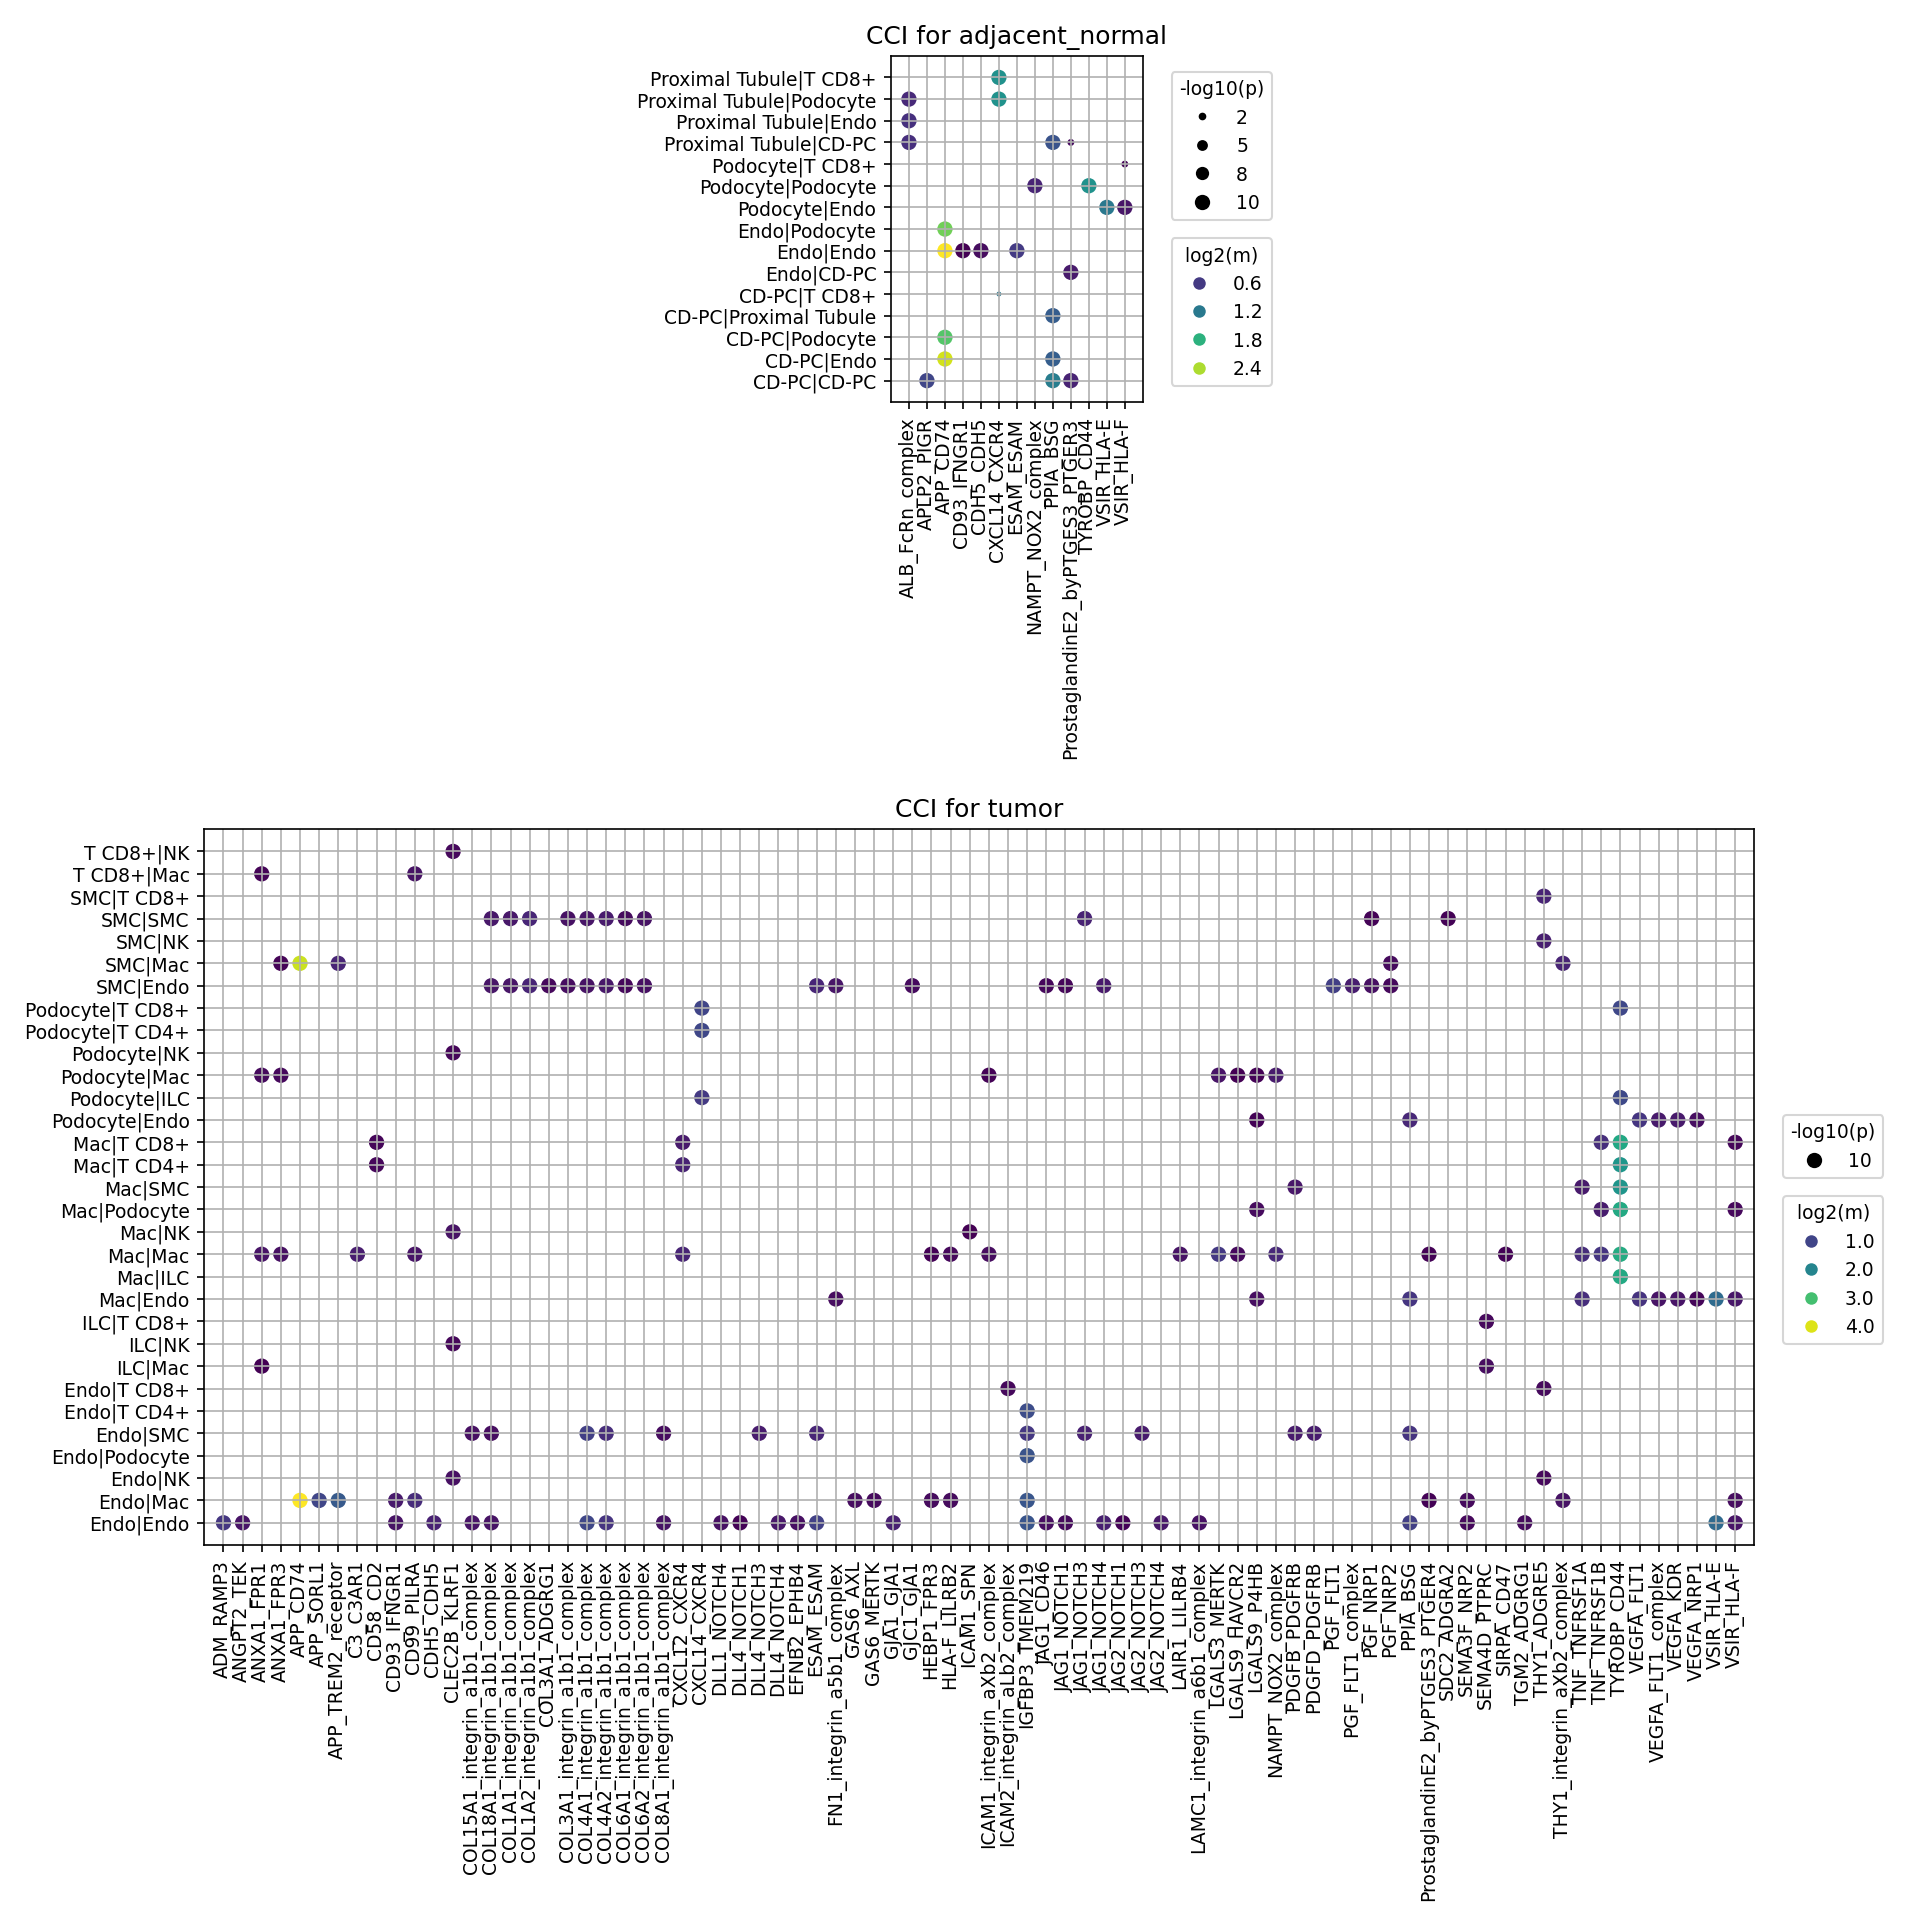
본 분석은 단일 세포 RNA 시퀀싱 데이터를 활용하여 신장 조직 내 종양(tumor)과 인접 정상(adjacent_normal) 조건 간의 세포-세포 상호작용(CCI) 패턴을 비교합니다. 특히, 종양 기원 세포인 신장 상피세포(Renal Epithelial cell)와 섬유아세포(Fibroblast), 대식세포(Macrophage), T 세포(CD4+ 및 CD8+) 간의 상호작용에 초점을 맞추었으며, 각 조건에서 유의미한 상호작용 중 최대 80개를 시각화했습니다. AnnData의 ploidy_dec 정보("Diploid", "Aneuploid")를 활용하여 종양 기원 세포(Renal Epithelial cell)의 상호작용을 플로이드 상태에 따라 세분화하여 분석했습니다.
Visual Summary
제공된 두 개의 닷 플롯은 인접 정상 조직과 종양 조직 간의 현저히 다른 세포-세포 상호작용 양상을 보여줍니다.
- 인접 정상 조직(adjacent_normal)에서의 CCI: 이 플롯에서는 'Diploid Renal Epi | T CD8+' 세포 쌍과 'CXCL14_CXCR4' 리간드-수용체 쌍 간의 단일 상호작용만 관찰됩니다. 점의 크기(-log10(p))와 색상(log2(m))이 모두 낮은 값을 나타내어, 상대적으로 약하거나 적은 수의 상호작용이 일어남을 시사합니다.
- 종양 조직(tumor)에서의 CCI: 이 플롯은 훨씬 더 다양하고 많은 수의 세포-세포 상호작용을 보여줍니다. 'Macrophage' 세포가 'T CD8+', 'T CD4+' 및 다른 'Macrophage' 세포와 다양한 리간드-수용체 쌍을 통해 활발하게 상호작용함을 확인할 수 있습니다. 'Diploid Renal Epi | T CD4+' 세포 쌍도 여러 리간드-수용체 쌍과 상호작용하며, 특히 'Macrophage' 관련 상호작용들이 큰 점 크기(낮은 p-value)와 밝은 색상(높은 평균 발현)을 보여 활발하고 유의미한 상호작용임을 나타냅니다. 'Fibroblast'는 분석 대상 세포 유형이었지만, 상위 80개 상호작용에는 포함되지 않았습니다.
Biological Interpretation
- 종양 미세환경의 복잡성 증가: 인접 정상 조직에 비해 종양 미세환경(TME)에서 세포-세포 상호작용의 수와 다양성이 급격하게 증가하는 것이 가장 두드러진 특징입니다. 이는 종양 발생과 진행 과정에서 면역 세포, 기질 세포, 종양 세포 간의 복잡한 통신 네트워크가 활성화됨을 의미합니다.
- 대식세포(Macrophage)의 중심 역할: 종양 내에서 대식세포(Macrophage)는 'Macrophage | Macrophage', 'Macrophage | T CD8+', 'Macrophage | T CD4+' 등 여러 세포 유형과 가장 활발하고 다양한 상호작용을 형성합니다. 이는 종양 관련 대식세포(TAMs)가 신장암 TME에서 면역 조절, 염증 반응, 종양 성장 촉진 등 다면적인 역할을 수행함을 시사합니다.
- 면역 억제 및 체크포인트 관련 상호작용: 'APOE_TREM2_receptor', 'LAIR1_LILRB4', 'VSIR_HLA-F', 'VSIR_HLA-E'와 같은 상호작용은 대식세포를 중심으로 면역 억제 경로와 관련되어 있습니다.
- TREM2: 대식세포의 TREM2는 종양 미세환경에서 면역 억제 및 종양 진행을 돕는 표현형과 연관되어 있습니다 PubMed search: TREM2 cancer.
- LILRB4 (ILT4): 대식세포에 발현되는 LILRB4는 T 세포 활성화를 억제하여 종양 면역 회피에 기여하는 면역 체크포인트로 알려져 있습니다 PubMed search: LILRB4 cancer immunotherapy.
- VSIR (VISTA) 및 HLA-E/F: VSIR은 면역 억제성 면역 체크포인트이며, HLA-E 및 HLA-F는 비고전적인 MHC I 분자로, 이들 간의 상호작용은 T 세포 또는 NK 세포 반응을 억제하여 종양의 면역 회피 메커니즘에 관여할 수 있습니다 GeneCards: VSIR.
- 염증 및 면역 반응 조절: 'C3_C3AR1' (보체계) 및 'TNF_TNFRSF1B' (TNF 신호) 상호작용은 TME 내 염증 반응과 면역 세포 기능 조절에 대식세포가 깊이 관여함을 나타냅니다 GeneCards: TNF.
- 신장 상피세포(종양 기원)와 T 세포 간의 상호작용 변화:
- 인접 정상 조직에서는 'Diploid Renal Epi | T CD8+' 상호작용이 'CXCL14_CXCR4'를 통해 관찰됩니다.
- 종양 조직에서는 'Diploid Renal Epi | T CD4+' 상호작용이 'CXCL14_CXCR4'뿐만 아니라 'TNF_TNFRSF1B', 'VSIR_HLA-F', 'VSIR_HLA-E' 등 여러 경로를 통해 관찰됩니다. 이는 종양 내에서 신장 상피세포와 상호작용하는 T 세포 아형이 CD8+에서 CD4+로 전환되거나, CD4+ T 세포의 역할이 더욱 중요해질 수 있음을 시사하며, 종양 세포가 직접 면역 체크포인트를 통해 T 세포 기능을 조절할 가능성을 보여줍니다.
- CXCL14-CXCR4: CXCR4는 암세포의 이동과 전이에 관여하는 것으로 알려져 있으며, 이 상호작용은 T 세포 모집 또는 기능에 영향을 미칠 수 있습니다 GeneCards: CXCR4.
- 섬유아세포(Fibroblast) 상호작용의 상대적 부재: 분석 대상에 포함되었음에도 불구하고, 상위 80개 상호작용에서 섬유아세포 관련 상호작용이 나타나지 않은 점은, 본 분석 범위 내에서 이들 세포가 다른 세포 유형(대식세포, T 세포, 신장 상피세포)만큼 활발하게 직접적인 리간드-수용체 상호작용을 하지 않거나, 더 낮은 유의성/발현 수준으로 인해 제외되었음을 의미합니다.
- Diploid Renal Epi의 특이성: 'expand_ploidy_from_tumor_origin' 파라미터가 적용되어 종양 기원 신장 상피세포가 'Diploid'와 'Aneuploid'로 세분화되었음에도 불구하고, 플롯에는 'Diploid Renal Epi'만 나타났습니다. 이는 Aneuploid Renal Epi 세포가 상위 80개 상호작용에 포함될 만큼 유의미한 상호작용을 보이지 않았거나, 종양 미세환경 내에서 Aneuploid 세포와 Diploid 세포 간의 상호작용 패턴에 차이가 있을 수 있음을 시사합니다.
Clinical or Translational Implications
- 새로운 치료 표적 발굴: 종양 미세환경에서 대식세포와 T 세포 간에 활발하게 일어나는 'LAIR1_LILRB4' 및 'VSIR_HLA-E/F'와 같은 면역 체크포인트 상호작용은 면역 치료제의 새로운 표적이 될 수 있습니다. LILRB4 (ILT4)와 VISTA (VSIR)는 종양 미세환경에서 면역 억제를 유도하여 항암 면역 반응을 약화시키므로, 이들 경로를 차단하는 치료 전략은 TME 내 항종양 면역을 강화할 수 있습니다.
- 대식세포 리프로그래밍 전략: APOE-TREM2 및 C3-C3AR1과 같은 대식세포 관련 상호작용은 대식세포의 기능적 상태를 조절하는 데 중요한 역할을 할 수 있습니다. 종양 미세환경에서 면역 억제성 대식세포를 항종양성 표현형으로 리프로그래밍하는 전략을 개발하기 위한 잠재적 표적으로 고려될 수 있습니다.
- 종양-T 세포 상호작용 조절: 'Diploid Renal Epi | T CD4+' 간의 'CXCL14_CXCR4' 및 'VSIR_HLA-E/F' 상호작용은 종양 세포 자체의 면역 회피 메커니즘을 시사합니다. 이러한 직접적인 종양-T 세포 상호작용을 차단함으로써 T 세포의 항종양 활성을 회복시킬 수 있는 치료적 접근 가능성을 제시합니다.
- 바이오마커 개발: 특정 세포 쌍과 리간드-수용체 쌍의 조합은 신장암의 진행 또는 치료 반응을 예측하는 바이오마커로 활용될 수 있습니다. 예를 들어, 대식세포 중심의 면역 억제 상호작용 강도는 특정 면역치료에 대한 환자의 반응성을 예측하는 데 도움이 될 수 있습니다.
이러한 결과는 신장 종양 미세환경의 복잡한 통신 네트워크를 이해하고, 면역 치료 및 기타 표적 치료를 위한 새로운 전략을 개발하는 데 중요한 통찰력을 제공합니다.
12. Kidney Tumor Microenvironment Cell-Cell Interaction Analysis
[Analysis Visualization Results]...
Analysis Overview
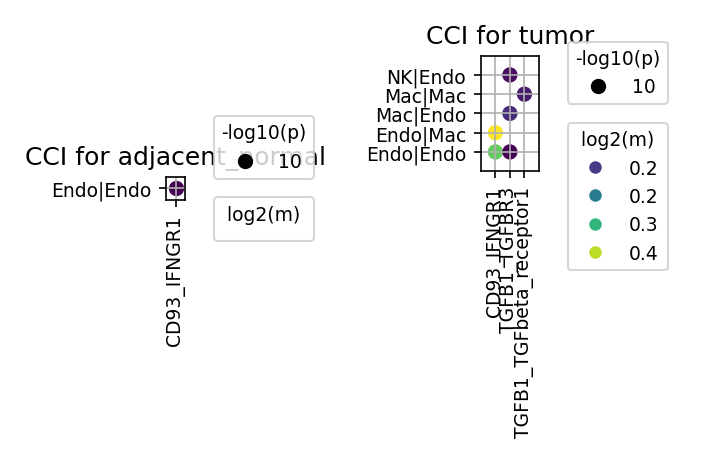
This analysis investigates significant cell-cell interactions (CCI) within the kidney tumor microenvironment (TME) using single-cell RNA sequencing data. CellPhoneDB was employed to identify ligand-receptor pairs between various cell types in the "tumor" condition. The visualization highlights the top 80 most significant interactions, displaying both the statistical significance (p-value) and the average expression level of the interacting molecules. This provides a detailed landscape of intercellular communication that may drive tumor progression, immune evasion, or stromal remodeling in kidney cancer.
Visual Summary
The dot plot visualizes cell-cell interactions within the tumor tissue. Each row represents a specific cell-cell pair (e.g., T CD8+|Mac indicates interactions from T CD8+ cells to Macrophages, or vice-versa, depending on ligand/receptor assignment), and each column represents a ligand-receptor interaction pair.
- Overall Interaction Landscape: A diverse set of cell-cell interactions is observed, involving immune cells (T CD8+, T CD4+, Macrophage, ILC), stromal cells (Smooth muscle cell, Endothelial cell), and tumor-origin cells (Diploid Renal Epithelial cell).
- Significance and Expression Strength: The size of each dot corresponds to the statistical significance of the interaction (-log10(p-value)), with larger dots indicating higher significance (smaller p-value). The color of the dot reflects the average expression level of the interacting ligand-receptor pair (log2(mean)), with yellow/green indicating higher expression and purple/blue indicating lower expression.
- Highly Active Cell Pairs: Macrophages (Mac) appear to be highly interactive, participating in numerous significant communications with other immune cells (T CD8+, T CD4+, ILC, other Macrophages) and stromal cells (Smooth muscle cell, Endothelial cell). Endothelial cells (Endo) also show extensive interactions, particularly with Macrophages, Smooth muscle cells, and other Endothelial cells, as well as with Renal Epithelial cells and T cells.
Prominent Ligand-Receptor Interactions (High Significance & Expression):
- ADM_RAMP3: This interaction shows exceptionally high expression and significance across multiple stromal-immune and immune-immune interactions, notably in SMC|T CD8+, SMC|Mac, and Mac|Mac pairs.
- APP_CD74: Significant and highly expressed in Endo|Mac interactions.
- CXCL14_CXCR4: Highly expressed and significant in Mac|ILC interactions.
- ESAM_ESAM: Highly expressed and significant in Mac|T CD8+ interactions.
- PGF_FLT1: Highly expressed and significant in Endo|Mac interactions, suggesting pro-angiogenic activity.
- LGALS9_P4HB: Significant and highly expressed in Endo|T CD8+ interactions.
- TNF_TNFRSF1B: Highly expressed and significant in Mac|T CD8+ interactions, indicating immune modulation.
- TYROBP_CD44: Highly expressed and significant in Endo|Mac interactions.
- JAG1_NOTCH4: Significant in Endo|Diploid Renal Epi interactions.
- VSIR_HLA-F: Significant in Diploid Renal Epi|T CD4+ interactions, potentially mediated by immune checkpoint signaling.
- Collagen-Integrin complexes (e.g., COL15A1_integrin_a1b1_complex): Several collagen-integrin interactions are significant among Endothelial cells (Endo|Endo), indicating strong cell-extracellular matrix (ECM) and cell-cell adhesion within the vasculature.
Biological Interpretation
The observed cell-cell interactions reveal critical communication axes within the kidney tumor microenvironment that can influence tumor growth, immune responses, and angiogenesis:
- Stromal-Immune Crosstalk (SMC, Endothelial cell, Macrophage, T cell):
- ADM-RAMP3 Signaling: The strong ADM-RAMP3 interaction between Smooth Muscle Cells (SMC) and immune cells (T CD8+, Macrophages), and within Macrophages (Mac|Mac), suggests a major role for Adrenomedullin in the kidney TME. Adrenomedullin (ADM) is known to promote angiogenesis, inflammation, and immune suppression in various cancers, contributing to tumor progression. Its prominent role here indicates active remodeling and immune modulation mediated by stromal and myeloid cells. PubMed: ADM and cancer
- PGF-FLT1 Axis: The highly significant and expressed PGF-FLT1 interaction between Endothelial cells and Macrophages points towards active angiogenesis and vascular remodeling. Placental Growth Factor (PGF) and its receptor FLT1 (VEGFR1) are crucial for blood vessel formation, a hallmark of cancer, and can also regulate macrophage function, potentially promoting a pro-tumoral phenotype. GeneCards: PGF, GeneCards: FLT1
- LAGALS9-P4HB: The interaction involving LGALS9 (Galectin-9) between Endothelial cells and CD8+ T cells is notable. Galectin-9 is a known immunomodulatory molecule that can induce T cell exhaustion and apoptosis, often promoting immune evasion in tumors. While P4HB (Protein Disulfide Isomerase) is not its canonical receptor, this interaction warrants further investigation as it could represent a mechanism by which endothelial cells suppress anti-tumor immunity. GeneCards: LGALS9
- TNF-TNFRSF1B: Macrophage-T CD8+ T cell interactions via TNF-TNFRSF1B (TNF-receptor superfamily member 1B) signify crucial immune regulatory functions. TNF can have dual roles in cancer, promoting both anti-tumor immunity and pro-tumor inflammation, depending on the context and cellular environment.
- Immune Cell Crosstalk (Macrophage, T cell, ILC):
- CXCL14-CXCR4: Macrophage-ILC communication via CXCL14-CXCR4 suggests chemokine-mediated recruitment or activation within the TME. CXCR4 signaling is often implicated in cell migration, survival, and metastasis in cancer, and this interaction could facilitate the accumulation or positioning of ILCs in the tumor. GeneCards: CXCR4
- ESAM-ESAM: The homophilic ESAM interaction between Macrophages and CD8+ T cells indicates direct adhesion and potential signaling that could influence immune synapse formation or cell-cell recognition important for anti-tumor responses.
- Endothelial Cell Interactions:
- Endo|Endo interactions (e.g., COL15A1_integrin_a1b1_complex, CDH5_CDH5): The numerous collagen-integrin and CDH5 (Cadherin-5) interactions within Endothelial cells highlight the importance of cell adhesion and ECM remodeling in maintaining vascular integrity and supporting angiogenesis within the tumor.
- Tumor-Immune/Stromal Interactions (Diploid Renal Epithelial cell):
- JAG1-NOTCH4: The interaction between Endothelial cells and Diploid Renal Epithelial cells via JAG1-NOTCH4 is highly significant. Notch signaling is a key pathway in development and disease, often dysregulated in cancer. This specific interaction could play a role in tumor epithelial cell proliferation, differentiation, or the vascularization supporting the tumor. GeneCards: JAG1, GeneCards: NOTCH4
- VSIR-HLA-F: The interaction between Diploid Renal Epithelial cells and CD4+ T cells involving VSIR (VISTA) and HLA-F is particularly intriguing. VSIR is an immune checkpoint molecule, and its interaction with HLA-F could represent a mechanism by which renal epithelial cells suppress CD4+ T cell responses, contributing to immune evasion in kidney cancer. GeneCards: VSIR
Clinical or Translational Implications
The identified cell-cell interactions present several potential therapeutic targets and diagnostic opportunities in kidney cancer:
- Targeting ADM-RAMP3: Given its high expression and significance across multiple pro-tumorigenic cell types (SMC, Macrophages, T cells), interfering with the ADM-RAMP3 axis could represent a novel strategy to inhibit tumor progression, angiogenesis, and immune suppression in kidney cancer.
- Angiogenesis Inhibition (PGF-FLT1): The PGF-FLT1 interaction in Endothelial-Macrophage crosstalk reinforces the importance of angiogenesis in kidney cancer. Targeting this pathway, similar to existing anti-VEGF therapies, could offer an additional approach to starve the tumor.
- Immune Checkpoint Modulation (LGALS9, VSIR): The potential role of LGALS9 (via LGALS9-P4HB) in Endothelial-T CD8+ cell interactions and VSIR (via VSIR-HLA-F) in Diploid Renal Epi-T CD4+ cell interactions highlights immune suppressive mechanisms. Further investigation into these interactions could lead to new immune checkpoint inhibitors or combination therapies to enhance anti-tumor immunity in kidney cancer. PubMed: Immune Checkpoint Inhibitors kidney cancer
- Stromal Remodeling (JAG1-NOTCH4, Collagen-Integrins): Disrupting the JAG1-NOTCH4 signaling between endothelial and renal epithelial cells or targeting key collagen-integrin interactions could hinder tumor growth and metastasis by affecting angiogenesis and cell adhesion.
- Biomarker Discovery: The highly expressed and significant ligand-receptor pairs, such as ADM-RAMP3 or PGF-FLT1, could serve as potential biomarkers for disease progression, response to therapy, or as targets for liquid biopsy-based diagnostics.
Further experimental validation is warranted to confirm the functional relevance of these interactions and their potential as therapeutic targets in kidney cancer.
13. Condition-Specific Cell-Cell Interaction Patterns in Kidney Tissue
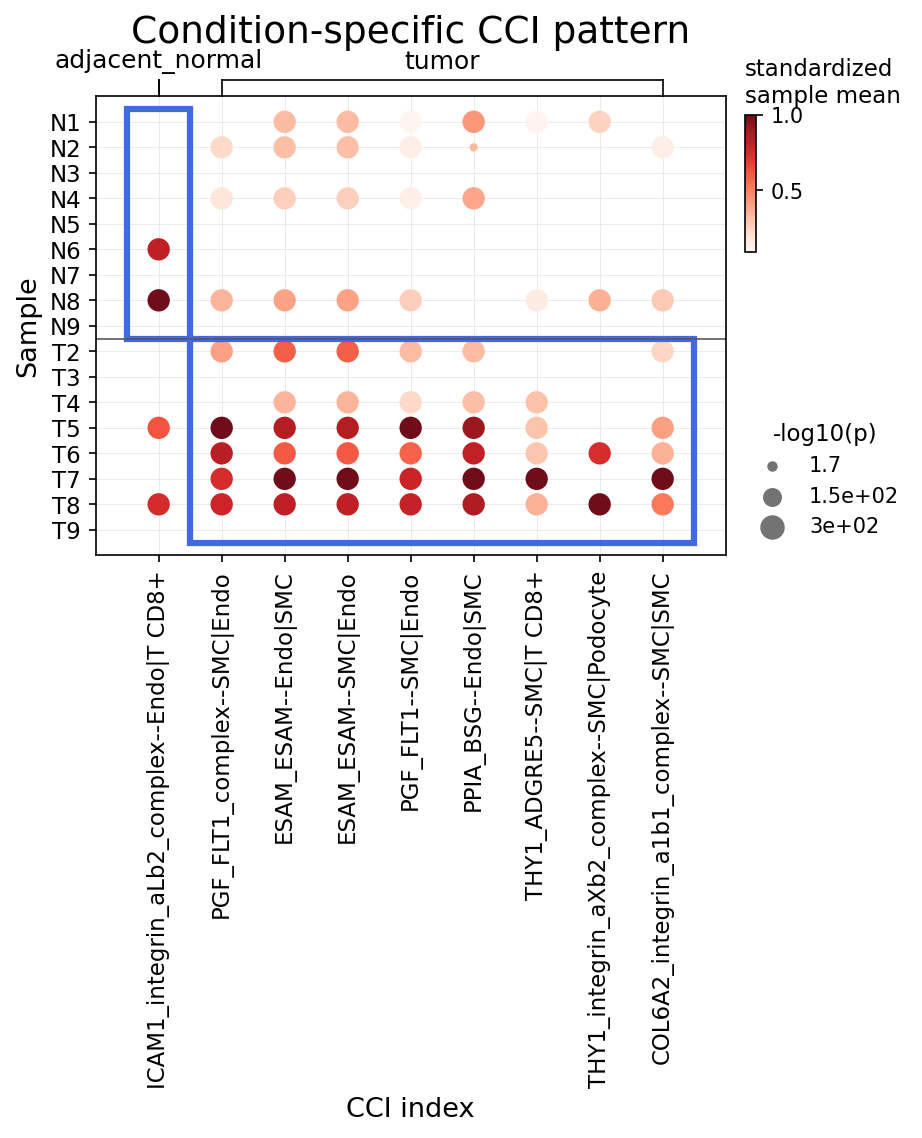
[Analysis Visualization Results]...
Analysis Overview
This analysis visualizes the statistically significant differences in cell-cell interactions (CCIs) between adjacent normal and tumor kidney tissue conditions. The dot plot displays 25 of the most significant CCIs involving major immune and stromal cell types, comparing their activity across individual samples. The color intensity of each dot represents the standardized mean interaction strength within a sample, while the dot size indicates the statistical significance (-log10(p-value)) of the interaction.
Visual Summary
The dot plot clearly segregates samples based on condition, with adjacent_normal samples (N1-N9) grouped at the top and tumor samples (T2-T9) at the bottom. A striking pattern emerges:
- Adjacent Normal-Specific Interactions: The upper blue box highlights a cluster of CCIs predominantly active and significant in adjacent normal samples (e.g., CXCL14-CXCR4, OSM-LIFR, EFNB1-EPHB4, RARRES2-CCRRL2, DLL4-NOTCH4). These interactions show strong signals (dark red, large dots) in most normal samples but are largely absent or weak in tumor samples. These involve interactions between Renal Epithelial cells, T cells, Macrophages, Endothelial cells, and Smooth Muscle Cells.
- Tumor-Specific Interactions: The lower blue box reveals a large panel of CCIs that are highly active and statistically significant almost exclusively in tumor samples. These interactions are characterized by dark red, large dots consistently observed across nearly all tumor samples (T2-T9), with minimal to no activity in adjacent normal samples. Many of these involve Endothelial cells (Endo), Smooth Muscle Cells (SMC), Macrophages (Mac), and T cells, notably:
- Multiple interactions related to collagen (COL4A2) and fibronectin (FN1) with integrins (e.g., COL4A2_integrin_a1b1_complex, FN1_integrin_a1b1_complex) between Endothelial cells and Smooth Muscle Cells.
- Angiogenic signaling: PGF-FLT1 (Endo|Endo, Endo|SMC).
- Cell adhesion and communication: ESAM-ESAM (Endo|Endo, Endo|SMC), GJA1-GJA1 (Endo|Endo), CDH5-CDH5 (Endo|Endo).
- Immune and stromal interactions: PPIA-BSG (Endo|Endo, Endo|SMC, T CD8+|Endo), CD99-PILRA (SMC|Mac), THY1-ADGRE5 (SMC|T CD8+), CD93-IFNGR1 (Endo|Mac), APP-CD74 (Endo|Mac, SMC|Mac), and TNF-TNFRSF1A/B (Mac|Mac).
The clear separation by condition indicates substantial remodeling of the cell-cell communication landscape in kidney tumors compared to adjacent normal tissue.
Biological Interpretation
The observed shifts in cell-cell interactions provide crucial insights into the tumor microenvironment (TME) dynamics in kidney cancer:
- Loss of Homeostatic Interactions in Normal Tissue: The interactions prominent in adjacent normal tissue, such as CXCL14-CXCR4 (Renal Epi|T CD8+, Renal Epi|Mac) and OSM-LIFR (Endo|Mac), likely represent pathways critical for maintaining tissue homeostasis, immune surveillance, or normal tissue repair processes. CXCL14 is known for its chemoattractant properties and diverse roles in immunity, while OSM is a pleiotropic cytokine. The downregulation of these pathways in the tumor suggests a disruption of normal kidney tissue functions. DLL4-NOTCH4 (Endo|Endo) is a key pathway in regulating vascular development and angiogenesis; its reduced activity in tumor tissue might indicate a switch to pathological angiogenic mechanisms.
- PubMed search: CXCL14 CXCR4 kidney immunity
- PubMed search: DLL4 NOTCH4 angiogenesis cancer
- Pro-Tumorigenic Interactions in the TME: The strong upregulation of numerous CCIs in tumor samples points to a highly active and distinct TME.
- Angiogenesis and Vascular Remodeling: The pronounced activity of interactions like PGF-FLT1 (Placental Growth Factor - FMS-like Tyrosine Kinase 1 receptor), ESAM-ESAM (Endothelial Cell Selective Adhesion Molecule), GJA1-GJA1 (Gap Junction Alpha-1 Protein), and CDH5-CDH5 (Cadherin-5) predominantly within Endothelial cells (Endo|Endo) and between Endothelial cells and Smooth Muscle Cells (Endo|SMC) strongly suggests active neo-angiogenesis, vascular abnormalization, and altered endothelial barrier function, which are hallmarks of tumor growth and metastasis. PGF-FLT1 signaling is a known driver of pathological angiogenesis.
- GeneCards: PGF
- GeneCards: CDH5
- ECM Remodeling and Adhesion: Increased interactions involving collagens (COL4A2) and fibronectin (FN1) with integrin complexes (a1b1_complex), particularly between Endothelial cells and Smooth Muscle Cells, highlight significant extracellular matrix (ECM) remodeling. This remodeling often facilitates tumor cell invasion, angiogenesis, and modulates immune responses.
- Immune Cell Engagement and Inflammation: Interactions involving Macrophages, T cells, Endothelial cells, and Smooth Muscle Cells, such as PPIA-BSG (Peptidylprolyl Isomerase A - Basigin/CD147), CD99-PILRA, THY1-ADGRE5, CD93-IFNGR1, and especially TNF-TNFRSF1A/B (Tumor Necrosis Factor - TNF Receptors), suggest an inflammatory and immune-active TME. CD147 (BSG) is frequently overexpressed in cancer and promotes tumor invasion and angiogenesis. The robust activation of TNF signaling between macrophages (Mac|Mac) indicates a prominent inflammatory response, which can be both pro- and anti-tumorigenic depending on the context.
- GeneCards: BSG
- GeneCards: TNF
Clinical or Translational Implications
The distinct condition-specific CCI patterns offer several potential clinical and translational implications:
- Biomarker Discovery: The highly active tumor-specific CCIs could serve as novel diagnostic or prognostic biomarkers for kidney cancer. For instance, the expression levels of interacting ligands and receptors (e.g., PGF, FLT1, components of integrin complexes, TNF) could be assessed in biopsies or liquid biopsies.
- Therapeutic Targets: The identified tumor-specific interactions represent attractive targets for therapeutic intervention. Inhibiting crucial pro-angiogenic pathways (e.g., PGF-FLT1) or disrupting ECM-related interactions (e.g., integrin blocking antibodies) could impede tumor growth and metastasis. Modulating immune-stromal interactions like the TNF-TNFRSF1A/B axis or PPIA-BSG could also be explored, although the context-dependent effects of TNF require careful consideration.
- Understanding Treatment Resistance: Differential CCI patterns might explain variations in response to existing therapies, particularly those targeting angiogenesis or immune checkpoints. Characterizing these interactions could help in stratifying patients for more personalized treatment strategies.
- Monitoring Disease Progression: Changes in the strength or presence of these specific CCIs could potentially be used to monitor disease progression or recurrence following treatment.
14. Renal Epithelial Cell Condition-Specific Surfaceome Markers in Kidney Tissue
[Analysis Visualization Results]...
Analysis Overview
This analysis identifies condition-specific surfaceome markers within Renal Epithelial cells, comparing tumor tissue to adjacent normal tissue. The results are presented as a dot plot, showing the mean expression level (color intensity) and the fraction of cells expressing each marker (dot size) for individual patients, further categorized by their ploidy status (Diploid vs. Aneuploid/non-Diploid) and tissue origin (Normal vs. Tumor). The analysis specifically focused on surfaceome markers to highlight potential candidates for cell-surface-targeted interventions or diagnostics.
Visual Summary
The dot plot effectively distinguishes between marker expression patterns in diploid adjacent normal renal epithelial cells and aneuploid tumor renal epithelial cells.
- Distinct Expression Patterns: A clear separation of markers is observed based on tissue condition and ploidy status. Genes on the left side of the plot are predominantly expressed in adjacent normal samples, particularly in the aneuploid normal cells (e.g., N6-N2 within the lower red box), with a generally lower expression in tumor cells. Conversely, genes on the right side show strong expression in tumor samples, especially in aneuploid tumor cells (e.g., T5-T2 within the lower red box), with minimal expression in normal cells.
- Adjacent Normal Markers: A cluster of markers, including ATP1B1, CLTRN, SIGIRR, DPEP1, TMEM219, ANPEP, SLC family genes (e.g., SLC3A1, SLC6A13, SLC37A4, SLC13A3, SLC3A2, SLC5A12, SLC22A2, SLC22A6), AQP1, EPCAM, PTH1R, SLC34A1, THY1, TMEM37, SLC6A19, SLC39A5, show high expression and prevalence in renal epithelial cells from adjacent normal kidney tissue. These markers are particularly prominent in the aneuploid subset of adjacent normal cells (patients N6-N2 in the lower left red box).
- Tumor-Specific Markers: A robust set of markers, including HLA class I genes (HLA-A, HLA-B, HLA-C, HLA-E, HLA-F), HLA-DRB1 (MHC class II), CD24, CD63, CD151, SPINT2, LY6E, APLP2, PTTG1IP, ATRAID, APP, CA12, DPP4, BST2, LMAN2, VCAM1, LRP2, exhibit strong and widespread expression in renal epithelial cells from tumor tissue. This pattern is particularly striking in the aneuploid tumor cells (patients T5, T7, T9, T6, T2 in the lower right red box).
Ploidy-Associated Differences
- Diploid renal epithelial cells from adjacent normal samples (e.g., Diploid N6-N3) show a relatively mild expression of the "normal" marker set compared to their aneuploid normal counterparts.
- Diploid renal epithelial cells from tumor samples (e.g., Diploid T7, T5, T8, T9) generally show lower expression of the "tumor" marker set compared to aneuploid tumor cells, although some (e.g., Diploid T5) exhibit noticeable expression of tumor-associated markers like HLA-A/B/C.
- Aneuploid renal epithelial cells, whether from normal or tumor samples, tend to show more pronounced and distinct marker profiles, suggesting that ploidy status significantly influences gene expression in these cells.
Biological Interpretation
The observed condition-specific surfaceome markers in Renal Epithelial cells highlight fundamental biological changes occurring during kidney tumorigenesis, particularly in aneuploid cells.
- Maintaining Homeostasis in Adjacent Normal Tissue: Markers such as ATP1B1 (a component of Na+/K+-ATPase, critical for renal ion transport and fluid balance) [GeneCards ATP1B1: GeneCards], DPEP1 (renal dipeptidase, involved in peptide metabolism and drug detoxification), ANPEP (aminopeptidase N, involved in peptide degradation and diverse physiological processes, often a renal epithelial marker) [UniProt ANPEP: UniProt], SLC family genes (solute carriers, essential for reabsorption and secretion in kidney tubules), and AQP1 (aquaporin 1, vital for water reabsorption) are characteristic of healthy, functional renal epithelial cells. Their prevalence in adjacent normal tissue, even in aneuploid subsets, reflects the attempt to maintain normal kidney physiology. EPCAM (epithelial cell adhesion molecule) is also an expected marker of epithelial cells, often associated with maintaining tissue integrity [GeneCards EPCAM: GeneCards]. The presence of some aneuploid cells in "adjacent normal" tissue with distinct marker profiles could signify early cellular changes or a field effect, where seemingly normal tissue harbors genetically altered cells.
- Immune Modulation and Evasion in Tumor Cells: The striking upregulation of HLA class I genes (HLA-A, HLA-B, HLA-C, HLA-E, HLA-F) and HLA-DRB1 (MHC class II) in tumor renal epithelial cells suggests significant changes in immune recognition and potential immune evasion strategies.
- Classical HLA Class I molecules (HLA-A, -B, -C) present endogenous peptides to CD8+ T cells. Their upregulation could make tumor cells more visible to cytotoxic T lymphocytes, but also provides a platform for presenting neoantigens.
- Non-classical HLA molecules like HLA-E and HLA-F can modulate NK cell activity and T cell responses, often contributing to immune evasion in cancer [PubMed search HLA-E cancer: PubMed Search].
- Aberrant expression of HLA-DRB1 (a component of MHC Class II) on non-professional antigen-presenting cells like tumor epithelial cells can occur under inflammatory conditions or as a stress response, potentially influencing CD4+ T cell responses.
- Cancer Progression and Metastasis-Associated Markers: Several identified tumor-specific surface markers are well-known to be involved in cancer hallmarks:
- CD24 is often associated with cancer stem cell properties, metastasis, and poor prognosis in various cancers, including kidney cancer [GeneCards CD24: GeneCards].
- CD63 (a tetraspanin) and CD151 (another tetraspanin) are involved in cell adhesion, migration, and signal transduction pathways critical for tumor invasion and metastasis [GeneCards CD63: GeneCards; GeneCards CD151: GeneCards].
- SPINT2 (serine protease inhibitor Kunitz type 2) can modulate cell invasion and migration, with dysregulation linked to various cancers.
- LY6E is a glycosylphosphatidylinositol-anchored protein often upregulated in aggressive cancers, promoting cell survival, migration, and invasion [PubMed search LY6E cancer: PubMed Search].
- VCAM1 (vascular cell adhesion molecule 1) is involved in leukocyte adhesion and transmigration, and its expression in tumor cells can promote metastasis by facilitating interaction with endothelial cells [GeneCards VCAM1: GeneCards].
- CA12 (carbonic anhydrase 12) is involved in pH regulation and is frequently overexpressed in hypoxic tumor microenvironments, contributing to tumor growth and progression [PubMed search CA12 renal cancer: PubMed Search].
- BST2 (bone marrow stromal antigen 2, tetherin) plays roles in immune regulation and is implicated in tumor immunity [GeneCards BST2: GeneCards].
- Ploidy as a Driver of Phenotype: The analysis reveals that aneuploid renal epithelial cells, particularly in the tumor context, exhibit a more robust and distinct "tumor" transcriptional signature compared to their diploid counterparts. This suggests that the presence of chromosomal abnormalities (aneuploidy) is strongly associated with the activation of pathways that promote aggressive tumor characteristics and immune evasion.
Clinical or Translational Implications
The identified condition-specific surfaceome markers in Renal Epithelial cells hold significant promise for clinical applications in kidney cancer.
- Biomarker Development: The distinct expression patterns of genes like CD24, LY6E, VCAM1, CA12, and specific HLA types in tumor renal epithelial cells make them excellent candidates for diagnostic and prognostic biomarkers for renal cell carcinoma (RCC). These could be detected via tissue biopsy, liquid biopsy (e.g., circulating tumor cells or exosomes), or imaging.
- Therapeutic Targets: Given that these markers are surfaceome proteins, they represent highly accessible targets for novel cancer therapies.
- Antibody-Drug Conjugates (ADCs): Antibodies targeting highly expressed tumor-specific surface proteins (e.g., CD24, LY6E, VCAM1) could deliver cytotoxic payloads directly to cancer cells, minimizing off-target toxicity.
- CAR T-cell therapy: Chimeric Antigen Receptor (CAR) T cells engineered to recognize and destroy renal epithelial cells expressing these specific surface markers could offer a personalized immunotherapy approach.
- Immune Checkpoint Modulation: The observed alterations in HLA molecule expression suggest potential avenues for modulating the immune response. For example, understanding how HLA-E/F upregulation contributes to immune evasion could inform strategies to overcome resistance to existing immunotherapies.
- Patient Stratification: The differences in marker profiles between aneuploid and diploid renal epithelial cells suggest that ploidy status could be a crucial factor for stratifying patients. Patients with aneuploid tumors might present with more aggressive disease or respond differently to certain treatments, warranting personalized therapeutic strategies.
- Monitoring Disease Progression and Recurrence: Longitudinal monitoring of these surface markers could help track disease progression, assess treatment response, and detect minimal residual disease or recurrence. For example, an increase in tumor-specific surface markers in biopsy or liquid biopsy samples could signal disease progression.
15. Macrophage Condition-Specific Surfaceome Markers in Kidney Tissue
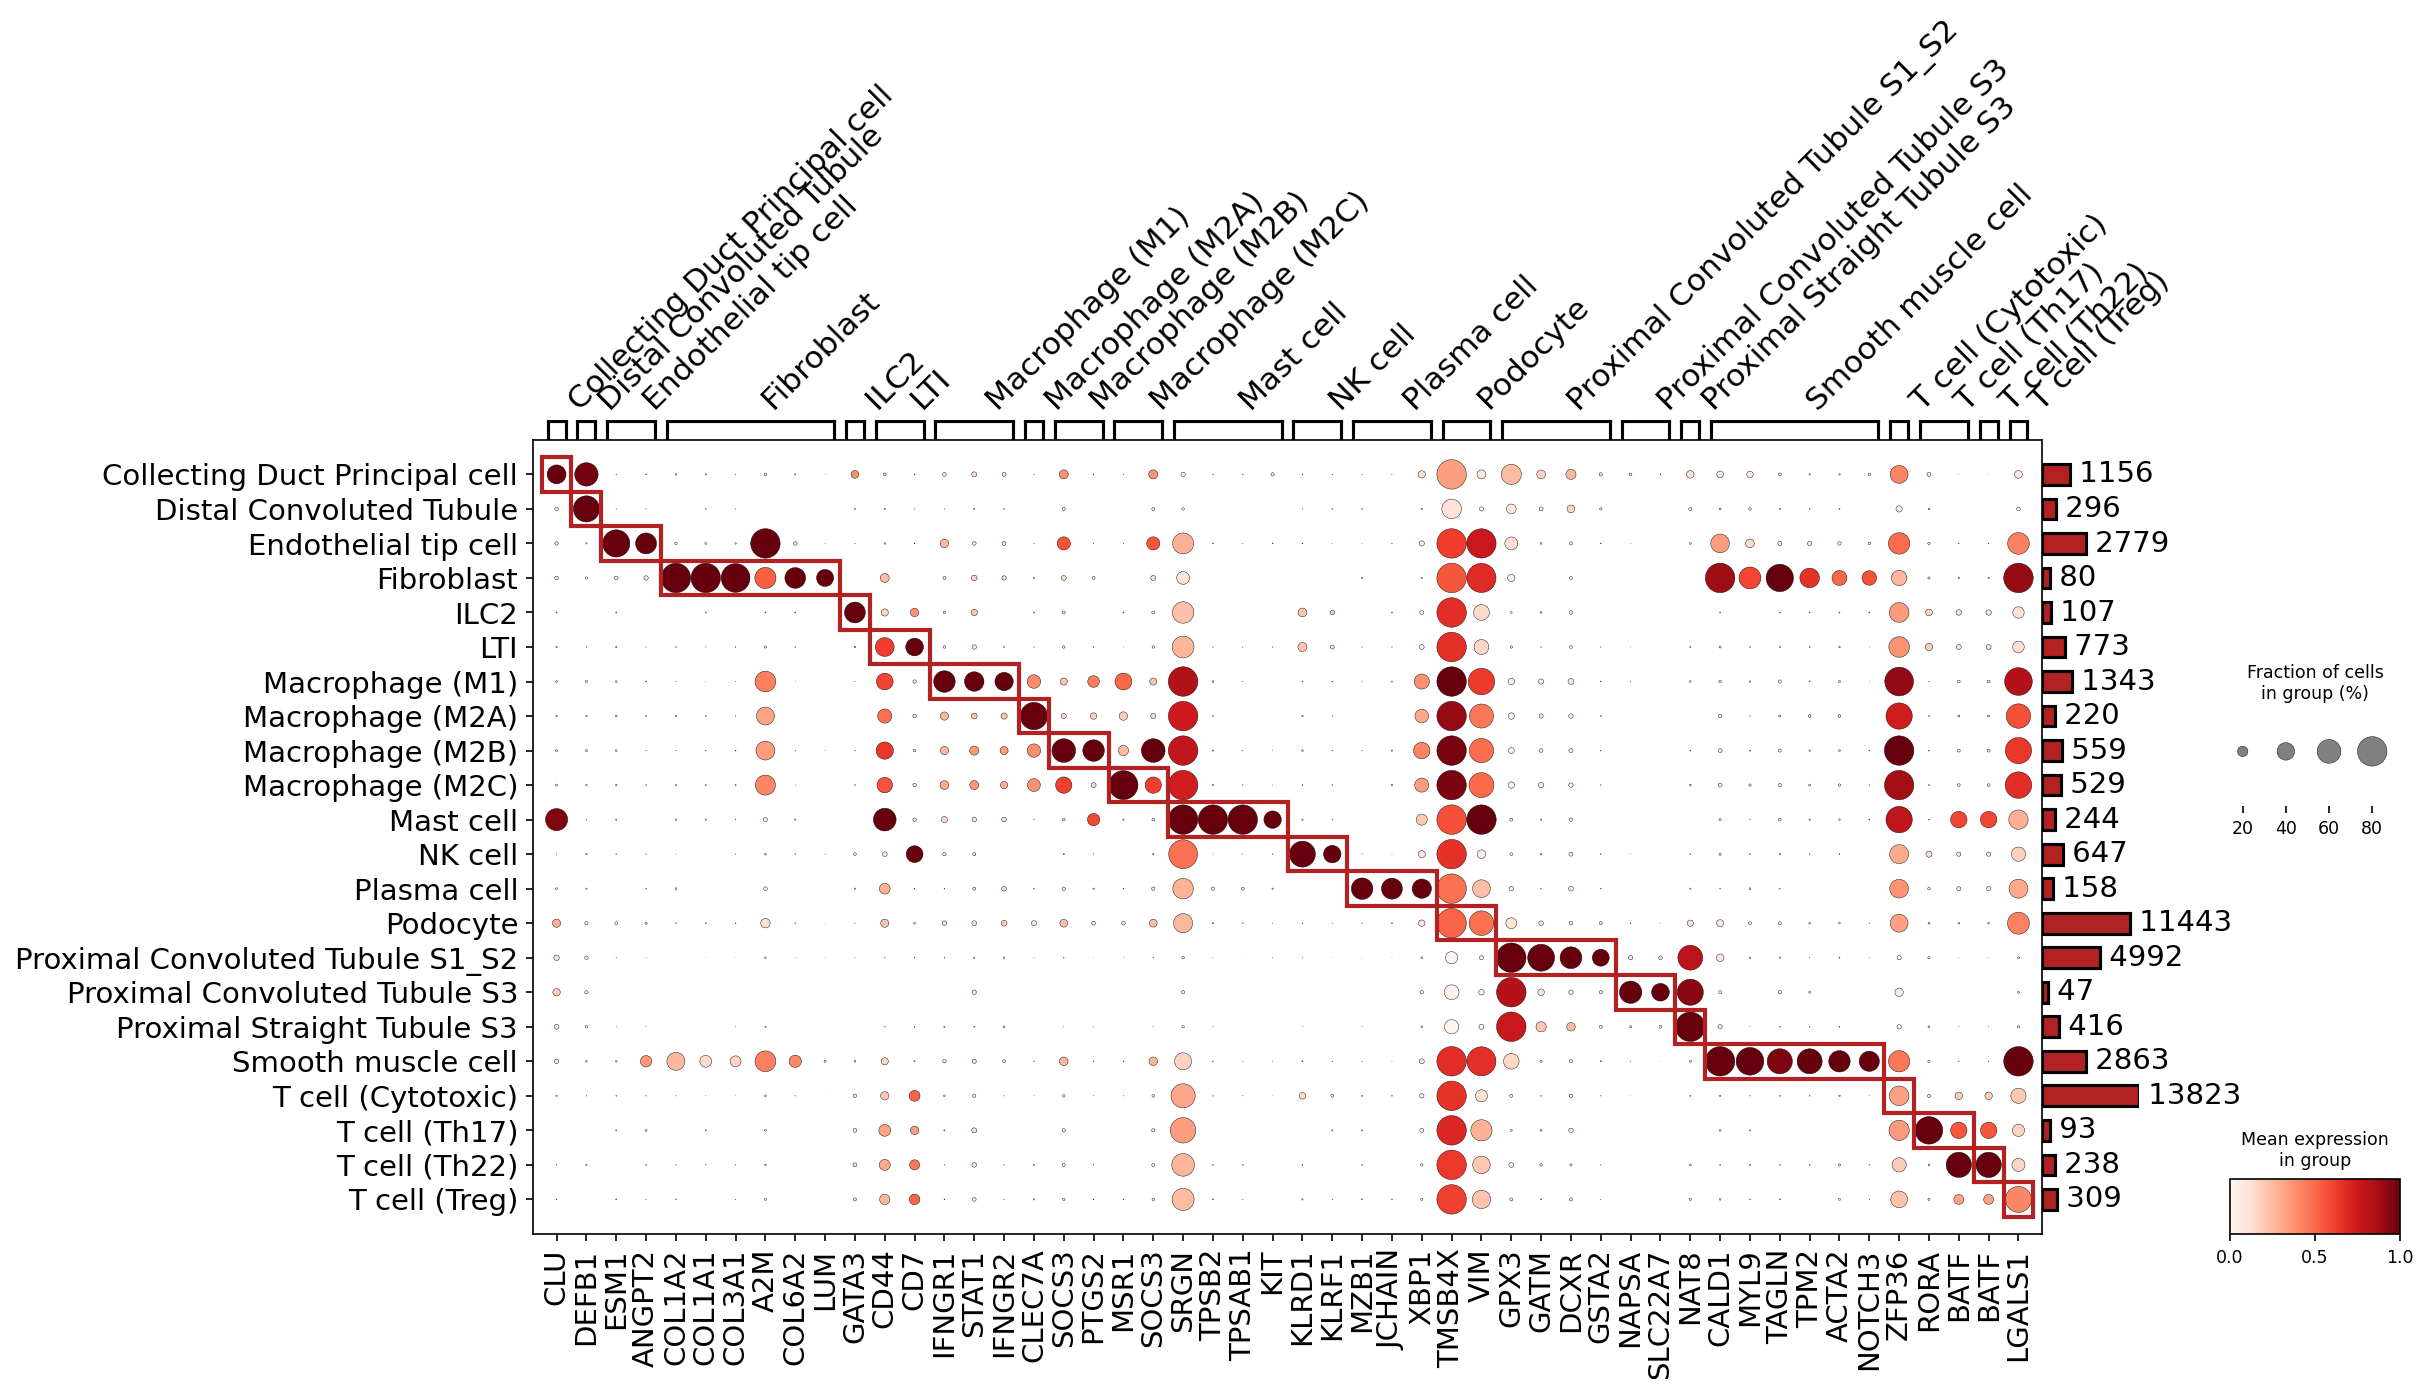
[Analysis Visualization Results]...
Analysis Overview
This analysis identifies surfaceome markers that are differentially expressed in Macrophage cells within the kidney, specifically comparing tumor tissue to adjacent normal tissue. By focusing on surfaceome markers, this analysis highlights potential candidates for cellular phenotyping, diagnostic tools, and therapeutic targets. The dot plot visualizes the mean expression level (color intensity) and the fraction of cells expressing each marker (dot size) for individual samples clustered by their condition (adjacent normal vs. tumor).
Visual Summary
The dot plot clearly segregates Macrophage samples based on their tissue origin: adjacent normal (N-prefixed samples) and tumor (T-prefixed samples).
- Distinct Expression Patterns: A prominent feature is the striking difference in marker expression profiles between macrophages from adjacent normal and tumor tissues.
- Adjacent Normal-Associated Markers: Macrophages from adjacent normal kidney tissue (samples N6, N1, N8, N4) show higher expression of specific markers such as EREG, CCRL2, HLA-DQB1, and HLA-DMB. These markers are expressed in a substantial fraction of cells within these normal samples (larger dot sizes) with moderate to high mean expression (redder colors).
- Tumor-Associated Macrophage (TAM) Markers: In contrast, macrophages from tumor samples (samples T7, T9, T5, T8, T6, T2, T4, T3) exhibit a broad and robust upregulation of a distinct set of surface markers. Key examples include FCGR3A, GPR183, TREM2, PLXDC2, HLA-F, CD9, CPM, MSR1, GPNMB, LAIR1, SLC1A3, LRP1, CD84, GPR34, SLCO2B1, ATRAID, SORL1, CD302, and FCGR1A. For many of these markers, a high fraction of tumor-associated macrophages express them (large dot sizes), and their mean expression levels are notably high (dark red colors).
- Sample-Level Consistency: Within each condition, the expression patterns across different samples appear largely consistent, indicating a reproducible phenotypic shift in macrophages in the tumor microenvironment.
- Cell Counts: The bar chart on the right indicates the number of Macrophage cells contributing to each sample group. Tumor samples generally have a higher number of detected macrophages compared to adjacent normal samples in this dataset.
Biological Interpretation
The differential expression of surfaceome markers in macrophages from tumor versus adjacent normal kidney tissue highlights significant changes in macrophage phenotype and function within the tumor microenvironment.
Macrophages in Adjacent Normal Tissue:
- The prominent expression of HLA-DQB1 and HLA-DMB indicates active antigen presentation capabilities, which are crucial for immune surveillance and maintaining immune homeostasis in healthy tissue.
- CCRL2 (C-C motif chemokine receptor-like 2) is an atypical chemokine receptor often involved in chemokine scavenging and regulating immune cell trafficking, suggesting roles in maintaining tissue immune balance.
- EREG (Epiregulin) is an EGFR ligand, often associated with tissue repair and epithelial proliferation, potentially reflecting homeostatic functions or mild responses to local cues in normal kidney.
- Tumor-Associated Macrophages (TAMs) Phenotype: The robust upregulation of numerous surface markers in TAMs points towards a distinct, often pro-tumoral, functional state:
Immunomodulatory Receptors:
- TREM2 (Triggering Receptor Expressed on Myeloid Cells 2) is a well-known marker of disease-associated macrophages, including TAMs, and is often implicated in promoting tumor progression by supporting cell survival, phagocytosis of apoptotic cells, and immunosuppression. https://pubmed.ncbi.nlm.nih.gov/35221294/
- LAIR1 (Leukocyte-associated immunoglobulin-like receptor 1) is an inhibitory receptor that can dampen immune responses, suggesting an immunosuppressive role for TAMs expressing this molecule. https://pubmed.ncbi.nlm.nih.gov/32572186/
- FCGR3A (CD16a) and FCGR1A (CD64) are Fc-gamma receptors. Their co-expression can indicate an activated macrophage state, potentially involved in antibody-dependent functions, but their specific roles in TAMs can be complex, spanning both pro- and anti-tumor immunity depending on the context.
- HLA-F is a non-classical MHC class I molecule, whose role in TAMs might involve modulating interactions with NK or T cells, often contributing to immune evasion.
Adhesion, Migration, and Proliferation Markers:
- CD9 is a tetraspanin involved in cell migration, adhesion, and signal transduction, frequently linked to cancer progression.
- PLXDC2 (Plexin Domain Containing 2) is associated with angiogenesis and cell adhesion, suggesting TAM involvement in tumor vascularization.
- GPNMB (Glycoprotein NMB, Osteoactivin) promotes tumor growth, metastasis, and immunosuppression in various cancers, often associated with poor prognosis. https://pubmed.ncbi.nlm.nih.gov/33927236/
Metabolic and Scavenger Receptors:
- MSR1 (Macrophage Scavenger Receptor 1, CD204) is involved in phagocytosis and modulates inflammation, often associated with an M2-like, pro-tumoral macrophage phenotype.
- LRP1 (Low-Density Lipoprotein Receptor-Related Protein 1) is a multifaceted receptor with roles in lipid metabolism, cytokine signaling, and cell migration, often contributing to cancer progression. https://pubmed.ncbi.nlm.nih.gov/35306352/
- SLC1A3 (Glutamate aspartate transporter) suggests altered metabolic activity in TAMs.
- GPR183 (EBI2) and GPR34 are G-protein coupled receptors that could be involved in sensing specific chemokines or metabolites within the tumor microenvironment, guiding TAM recruitment or function.
The overall pattern suggests that macrophages in kidney tumors adopt a specialized phenotype characterized by enhanced immunomodulatory capacity, altered metabolism, and roles in processes like angiogenesis and tissue remodeling, all contributing to the creation of a pro-tumoral microenvironment.
Clinical or Translational Implications
The identification of these distinct surfaceome markers on macrophages in kidney tumor versus adjacent normal tissue offers several valuable clinical and translational avenues:
Biomarker Discovery for Renal Cell Carcinoma (RCC):
- Diagnostic/Prognostic Markers: The specific upregulation of markers like TREM2, GPNMB, LAIR1, and LRP1 on TAMs could serve as diagnostic or prognostic biomarkers for RCC. Their presence and abundance could be assessed in tissue biopsies (e.g., via immunohistochemistry) or even potentially in liquid biopsies (e.g., via circulating extracellular vesicles expressing these markers) to inform disease staging or predict patient outcomes.
- Patient Stratification: These markers could help stratify patients based on their tumor immune microenvironment composition, guiding personalized treatment strategies.
Therapeutic Targeting of TAMs:
- Antibody-based Therapies: Surface receptors such as TREM2, GPNMB, LAIR1, LRP1, CD9, FCGR3A, and FCGR1A are highly accessible and represent promising targets for antibody-based therapies, including monoclonal antibodies or antibody-drug conjugates (ADCs). Targeting these molecules could aim to deplete pro-tumoral TAMs, reprogram their phenotype towards an anti-tumoral state, or block their immunosuppressive functions.
- Immune Checkpoint Modulation: Given the immunosuppressive nature suggested by markers like TREM2 and LAIR1, targeting these pathways could potentially enhance the efficacy of existing immune checkpoint inhibitors (e.g., anti-PD-1/PD-L1) in RCC.
- Combination Therapies: Developing combination therapies that concurrently target TAMs (e.g., via TREM2 inhibition) alongside other immunotherapeutic strategies or conventional treatments could be a promising approach to overcome resistance and improve patient responses. https://pubmed.ncbi.nlm.nih.gov/35221294/
Experimental Validation:
- Further experimental validation is crucial. This could involve characterizing protein expression of these markers using multiplex immunofluorescence, mass cytometry (CyTOF), or imaging mass cytometry (IMC) on larger cohorts of human RCC samples to confirm their spatial localization and co-expression patterns.
- *In vitro* and *in vivo* functional studies (e.g., using patient-derived organoids or xenograft models) could explore the precise roles of these markers in TAM differentiation, activation, and interaction with tumor cells, and evaluate the efficacy of targeted interventions.
16. Renal Epithelial Cell Gene Ontology Analysis Across Ploidy and Tumor Conditions
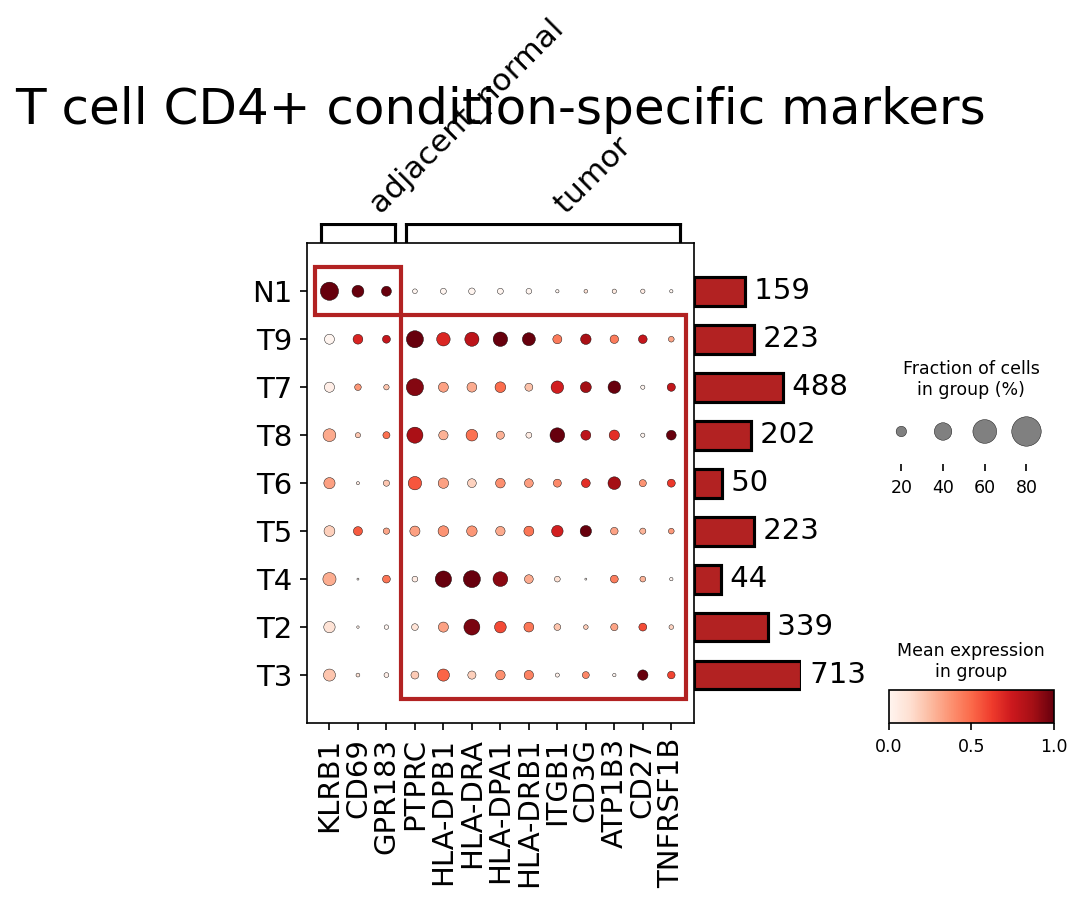
[Analysis Visualization Results]...
Analysis Overview
This analysis utilizes Gene Ontology (GSA) to identify enriched biological pathways and terms within Renal Epithelial cells, comparing different cellular states and conditions. Specifically, three comparisons were performed:
- Diploid_vs_others: Examining pathways upregulated in diploid renal epithelial cells compared to all other cells (potentially including aneuploid tumor cells).
- adjacent_normal_vs_others: Identifying pathways enriched in renal epithelial cells from adjacent normal tissue compared to all other cells.
- tumor_vs_others: Characterizing pathways specifically upregulated in renal epithelial cells within tumor tissue compared to all other cells.
The results are presented as bar plots, showing the significance of enrichment for various GO terms, quantified by -log(p-val) and -log(q-val).
Visual Summary
The three bar plots effectively display the most significantly enriched Gene Ontology terms for Renal Epithelial cells under different conditions. The length of each bar corresponds to the statistical significance (-log(p-val) and -log(q-val)), with longer bars indicating higher significance.
- Diploid_vs_others: This plot shows a strong and distinct enrichment for terms primarily related to immune responses, inflammation, and host defense against pathogens. Terms like "Staphylococcus aureus infection," "Systemic lupus erythematosus," "Coronavirus disease," "Intestinal immune network for IgA production," and various autoimmune/inflammatory diseases are highly significant.
- adjacent_normal_vs_others: This plot is dominated by terms associated with fundamental metabolic processes. Highly significant pathways include "Oxidative phosphorylation," "Ribosome," "Citrate cycle," "Fatty acid degradation," and various amino acid metabolism pathways. Several neurodegenerative disease terms also appear, often linked to underlying metabolic or protein handling issues.
- tumor_vs_others: This plot exhibits a mixed profile. While it shares some metabolic terms with the adjacent normal group (e.g., "Oxidative phosphorylation," "Ribosome"), it also highlights pathways related to protein processing and degradation, stress responses (e.g., "HIF-1 signaling pathway"), and directly or indirectly, cancer hallmarks (e.g., "Renal cell carcinoma," "Tight junction," "Cell cycle"). Infection-related terms are also noted.
Biological Interpretation
Diploid Renal Epithelial Cells: Immune & Inflammatory Engagement
The remarkable enrichment of immune and inflammatory pathways in diploid renal epithelial cells suggests a significant role for these non-transformed cells in the kidney's immune microenvironment. Epithelial cells are increasingly recognized not just as barriers but as active participants in innate immunity, capable of sensing pathogens and initiating inflammatory responses. The observed enrichment for terms like "Staphylococcus aureus infection" and "Coronavirus disease" could indicate active pathogen recognition or immune signaling pathways. Furthermore, the presence of autoimmune disease pathways implies their potential involvement in modulating immune tolerance or contributing to inflammatory conditions. This profile suggests that diploid epithelial cells, which are generally non-malignant, maintain robust immune surveillance or response capabilities.
Adjacent Normal Renal Epithelial Cells: Metabolic Powerhouses
The adjacent normal renal epithelial cells show a highly active metabolic profile, characteristic of healthy, functional kidney tissue. Pathways such as "Oxidative phosphorylation," "Citrate cycle," and various lipid and amino acid metabolism terms highlight their critical roles in energy production and the complex processes of filtration, reabsorption, and secretion. The kidney, especially the renal tubules, is one of the most metabolically active organs, requiring vast amounts of ATP to maintain ion gradients and transport solutes. The appearance of neurodegenerative disease terms (e.g., "Parkinson disease," "Huntington disease") often reflects underlying cellular stress mechanisms like mitochondrial dysfunction, proteostasis imbalance, or oxidative stress, which are general cellular pathologies not exclusive to neural tissues but can be exacerbated in metabolically demanding cells.
Tumor Renal Epithelial Cells: Reprogrammed Metabolism and Stress Response
Tumor renal epithelial cells exhibit a distinct pathway enrichment, indicating metabolic reprogramming and adaptation to the oncogenic state. While "Oxidative phosphorylation" and "Ribosome" remain highly active, suggesting continued high energy demand and protein synthesis for rapid proliferation, there's an increased emphasis on protein processing and degradation (e.g., "Proteasome," "Ubiquitin mediated proteolysis"). This may reflect increased protein turnover, misfolding, or degradation associated with malignant transformation. The "HIF-1 signaling pathway" is a key indicator of adaptation to hypoxia and is frequently activated in renal cell carcinoma, driving metabolic shifts and angiogenesis. The disruption of cell-cell adhesion, implied by pathways like "Tight junction," is a hallmark of epithelial-mesenchymal transition (EMT) and metastasis in cancer. The direct association with "Renal cell carcinoma" terms further validates the tumor-specific biological landscape. The presence of infection-related terms might suggest altered immune interactions or stress responses within the tumor microenvironment.
Clinical or Translational Implications
The distinct pathway enrichments observed in diploid, adjacent normal, and tumor renal epithelial cells provide crucial insights into kidney cancer biology and potential therapeutic strategies:
- Metabolic Vulnerabilities: The stark metabolic differences between adjacent normal and tumor cells present opportunities for targeted therapies. Disrupting specific metabolic pathways critical for tumor cell survival (e.g., HIF-1-driven glycolysis or specific protein processing) could be effective in renal cell carcinoma.
- *Reference for HIF-1 signaling in RCC:* GeneCards: HIF1A
- Immune Microenvironment Modulation: The active immune response pathways in diploid epithelial cells suggest their role in shaping the local immune context. Understanding how tumor cells suppress or evade these immune-competent bystander epithelial cells could lead to novel immunotherapeutic approaches that re-engage the epithelial defense mechanisms.
- Biomarker Discovery: Specific genes within these enriched pathways, particularly those unique to tumor cells (e.g., components of HIF-1 signaling, cell adhesion molecules involved in EMT), could serve as diagnostic or prognostic biomarkers for renal cell carcinoma.
- Understanding Disease Progression: The shift from a healthy metabolic profile to a reprogrammed, stress-adapted state in tumor cells illustrates key aspects of oncogenic transformation, potentially informing strategies to detect early changes or prevent progression.
17. Gene Set Enrichment Analysis of Kidney Tumor Microenvironment Cell Types
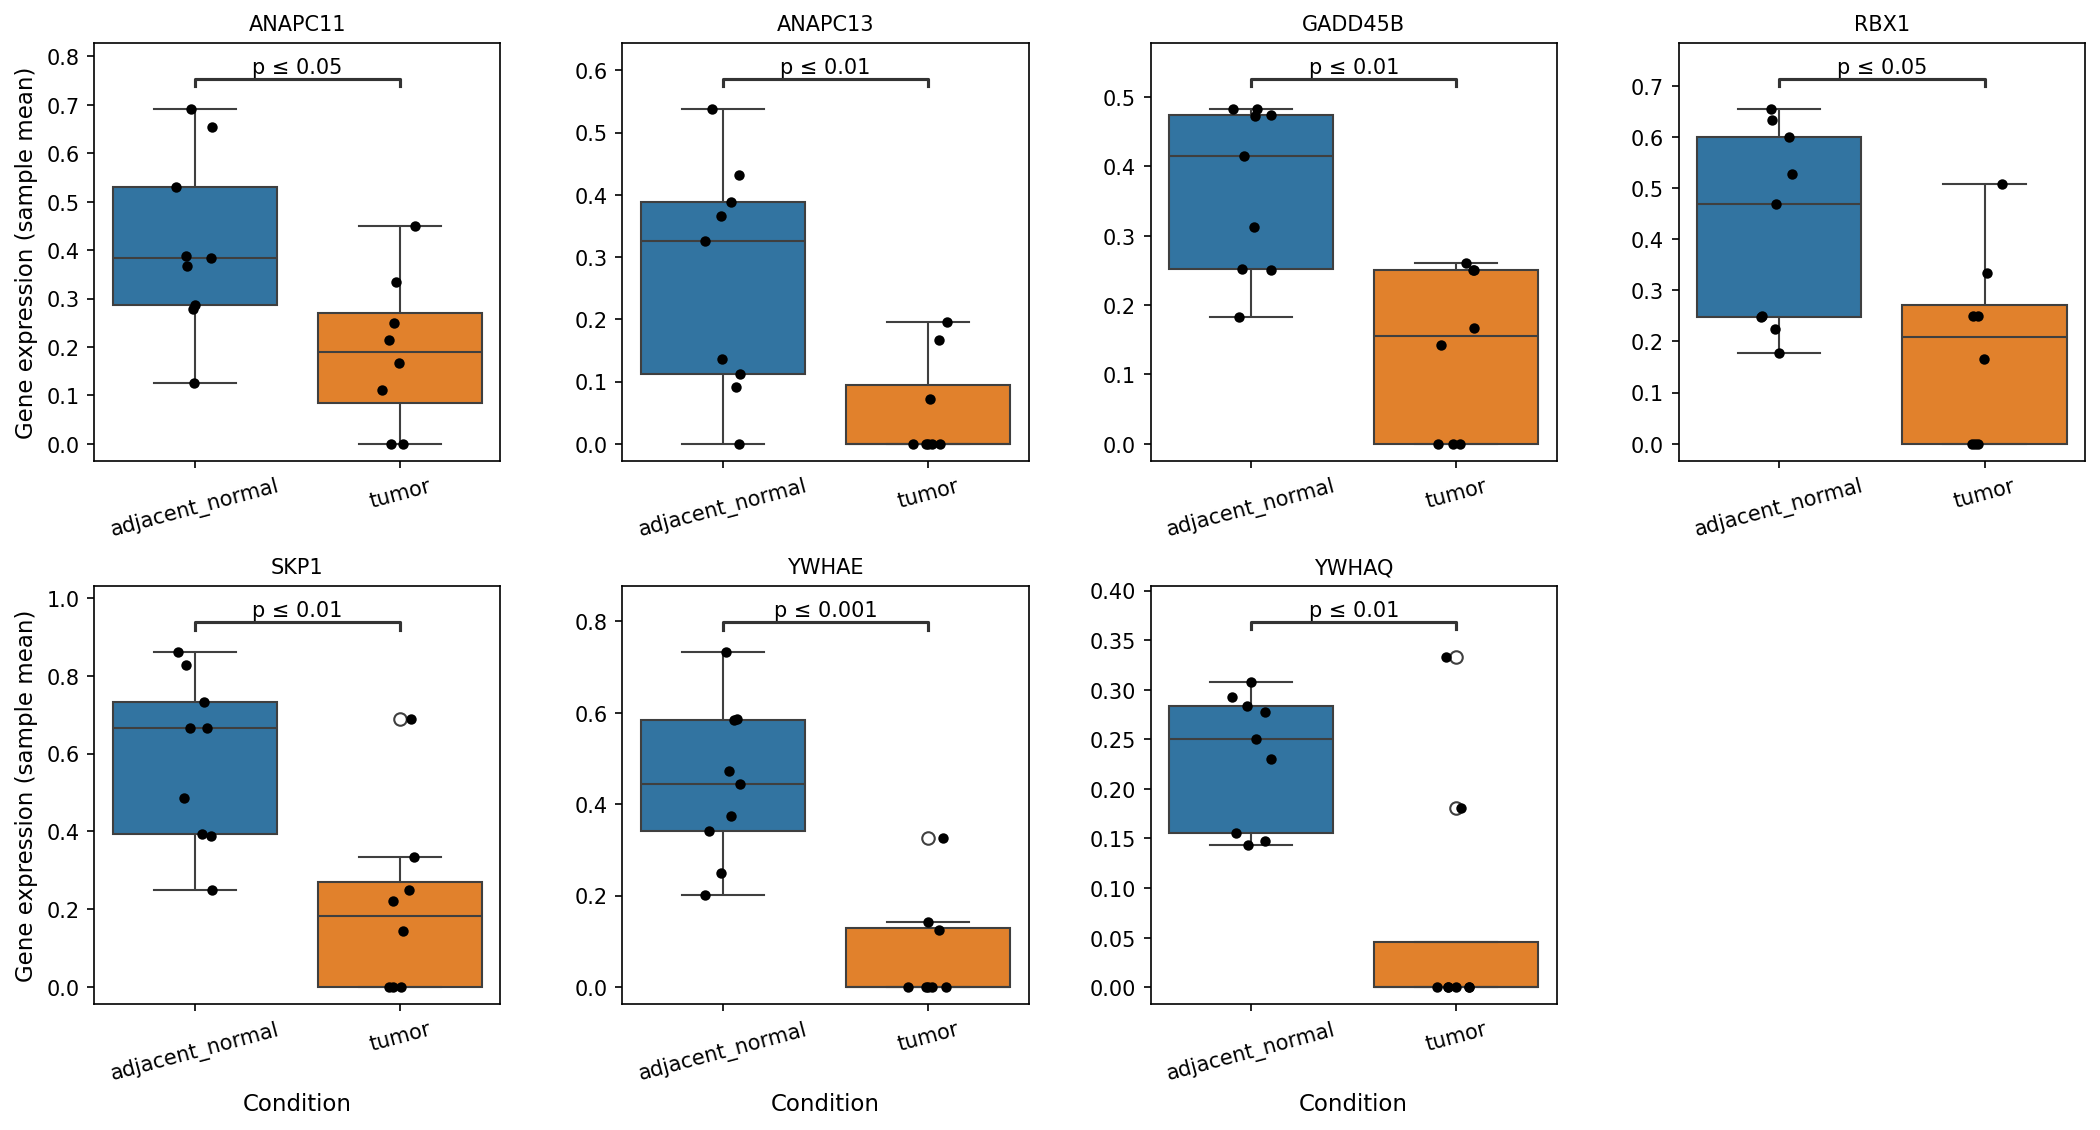
[Analysis Visualization Results]...
Analysis Overview
This analysis utilizes Gene Set Enrichment Analysis (GSEA) to identify statistically significant biological pathways and processes that are differentially active across various major cell types within the kidney tissue, comparing tumor conditions with adjacent normal tissue, and also exploring ploidy differences within renal epithelial cells. The results are presented as a dot plot, where dot size reflects the significance (negative log10 p-value) and dot color indicates the Normalized Enrichment Score (NES), with red representing positive enrichment (upregulation) and blue representing negative enrichment (downregulation) of the pathway.
Visual Summary
The dot plot effectively visualizes the enrichment patterns of 80 selected pathways across 14 different comparison groups, encompassing Endothelial cells, ILCs, Macrophages, Renal Epithelial cells, Smooth muscle cells, T cell CD4+, and T cell CD8+. Each cell type is analyzed for its 'adjacent_normal_vs_others' and 'tumor_vs_others' states, except for Renal Epithelial cells, which also include a 'Diploid_vs_others' comparison.
Key visual features observed:
- Renal Epithelial Cells (Tumor vs. Diploid Distinction): A striking pattern emerges in Renal Epithelial cells. Pathways related to "Central carbon metabolism in cancer", "HIF-1 signaling pathway", "Glyoxylate and dicarboxylate metabolism", "mTOR signaling pathway", "p53 signaling pathway", and "Ubiquitin mediated proteolysis" are strongly positively enriched (large red dots) in 'Renal Epithelial cell: tumor_vs_others'. Conversely, these same pathways are strongly negatively enriched (large blue dots) in 'Renal Epithelial cell: Diploid_vs_others', indicating a clear shift in metabolic and regulatory programs associated with tumor transformation and ploidy status.
- Immune Cell Activation in Tumor: For Macrophages, T cell CD4+, and T cell CD8+ in the 'tumor_vs_others' comparisons, several immune-related pathways show positive enrichment, such as "Chemokine signaling pathway" and "Antigen processing and presentation". Macrophages within the tumor also exhibit enrichment in cancer-associated metabolic pathways like "HIF-1 signaling pathway" and "Central carbon metabolism in cancer", suggesting their active role in the tumor microenvironment.
- Stromal and Endothelial Remodeling: Endothelial cells and Smooth muscle cells in the 'tumor_vs_others' condition show positive enrichment in pathways like "HIF-1 signaling pathway", "Central carbon metabolism in cancer", "Glyoxylate and dicarboxylate metabolism", "mTOR signaling pathway", and "Vascular smooth muscle contraction". This points towards active angiogenesis, metabolic reprogramming, and extracellular matrix remodeling processes within the tumor stroma.
- Adjacent Normal Signatures: In general, 'adjacent_normal_vs_others' comparisons often show either less significant enrichment or, in some cases, an inverse pattern to the 'tumor_vs_others' comparisons for cancer-associated pathways. For instance, "Collecting duct acid secretion" shows some positive enrichment in Endothelial and Renal Epithelial cells from adjacent normal tissue, which could indicate maintenance of some physiological functions.
Biological Interpretation
The GSEA results provide strong biological insights into the molecular changes occurring in specific cell types within the kidney tumor microenvironment.
- Renal Epithelial Cell Transformation: The differential enrichment in Renal Epithelial cells (the presumed tumor origin cell type) between 'tumor_vs_others' and 'Diploid_vs_others' comparisons highlights a metabolic and proliferative shift.
- Tumor Epithelial Cells exhibit upregulation of pathways critical for cancer cell growth and survival:
- Metabolic Reprogramming: "Central carbon metabolism in cancer", "Glyoxylate and dicarboxylate metabolism", "HIF-1 signaling pathway" indicate altered glucose and glutamine metabolism, consistent with the Warburg effect and adaptations to hypoxia within the tumor [PubMed Search].
- Growth and Proliferation Signaling: "mTOR signaling pathway" and "p53 signaling pathway" suggest increased cell proliferation, survival, and potentially genomic instability or stress responses [PubMed Search].
- Protein Turnover: "Ubiquitin mediated proteolysis" is often upregulated in cancer for protein quality control and regulating cell cycle progression.
- Diploid Renal Epithelial Cells show a reverse pattern, with these same pathways being negatively enriched, suggesting these cells maintain a more quiescent or normal metabolic state, contrasting with the aneuploid or more transformed tumor cells. This strongly validates ploidy as a relevant biological discriminator.
Immune Infiltration and Activation:
- The positive enrichment of "Chemokine signaling pathway" and "Antigen processing and presentation" in Macrophages, T cells (CD4+ and CD8+), and ILCs in the tumor context indicates active recruitment and engagement of these immune cells. This is a common feature of the tumor microenvironment, where both anti-tumor and pro-tumor immune responses are orchestrated [PubMed Search].
- Macrophages also show enrichment of "HIF-1 signaling pathway" and "Central carbon metabolism in cancer", suggesting metabolic reprogramming similar to tumor cells, which can drive their polarization towards pro-tumor (e.g., M2-like) phenotypes [Link].
Stromal Remodeling and Angiogenesis:
- Endothelial cells and Smooth muscle cells within the tumor show enrichment in "HIF-1 signaling pathway" and "Vascular smooth muscle contraction", which are crucial for angiogenesis and the formation of new blood vessels that supply the growing tumor [PubMed Search].
- Their engagement in "Central carbon metabolism in cancer" and "mTOR signaling pathway" further points to their active participation in supporting tumor growth and remodeling the extracellular matrix.
Clinical or Translational Implications
The distinct pathway enrichments observed in this GSEA analysis hold significant clinical and translational potential, particularly for kidney cancer.
- Therapeutic Targeting of Metabolic Reprogramming: The consistent upregulation of metabolic pathways like "Central carbon metabolism in cancer", "HIF-1 signaling pathway", and "mTOR signaling pathway" across tumor epithelial cells, macrophages, and endothelial cells suggests these pathways are crucial dependencies for tumor growth and survival. Inhibitors targeting these pathways (e.g., mTOR inhibitors, HIF-1α inhibitors) could be explored as therapeutic strategies, potentially disrupting multiple components of the tumor ecosystem simultaneously.
- Immune Checkpoint Modulation: Understanding the specific immune pathways activated (e.g., "Chemokine signaling pathway", "Antigen processing and presentation") in tumor-infiltrating immune cells can help in designing more effective immunotherapies. For instance, targeting specific chemokine axes could enhance or suppress immune cell recruitment as desired, or understanding antigen presentation mechanisms could inform vaccine development or adoptive cell therapies.
- Ploidy as a Biomarker: The striking difference in pathway enrichment between 'tumor' and 'Diploid' renal epithelial cells underscores the biological significance of ploidy status. This suggests that ploidy could serve as a valuable biomarker for disease progression, prognosis, or even a stratification factor for treatment decisions in kidney cancer.
- Anti-angiogenic Strategies: The enrichment of "HIF-1 signaling pathway" and "Vascular smooth muscle contraction" in endothelial and smooth muscle cells reinforces the importance of angiogenesis in kidney tumor progression. Existing anti-angiogenic therapies could be more effectively applied, or novel targets within these pathways could be investigated.
18. Discussion
The single-cell analysis of human kidney cancer reveals a profoundly altered cellular and molecular landscape in tumor tissue compared to adjacent normal tissue. Genomic analysis (Sections 4, 5, 10) unequivocally identifies aneuploidy as a robust hallmark of malignant renal epithelial cells, driving a distinct transcriptional phenotype. Recurrent copy number variations, such as deletions on chromosome 3p (a known locus for the *VHL* tumor suppressor gene in ccRCC) and amplifications on 5q, 7q, 11q, and 12q, provide clear genomic evidence of malignancy and align with established drivers of kidney cancer progression. Critically, these genomic profiles also help re-classify a subset of 'unassigned' cells in tumor samples as likely malignant, emphasizing the importance of integrating multi-modal data for accurate cell identification.
Cellular composition analysis (Section 6) demonstrates a dramatic decrease in normal kidney parenchymal cells, notably Proximal Tubule cells, and a reciprocal increase in immune and stromal populations within the tumor microenvironment (TME). This extensive immune infiltration is dominated by an increased proportion of cytotoxic T cells (Section 7) and a significant enrichment of macrophages (Section 6). While the T cell landscape suggests an active anti-tumor immune response, the concurrent presence of regulatory T cells (Treg) hints at potential immune evasion mechanisms. Macrophage analysis (Sections 8, 16) reveals a complex polarization shift, with an increased proportion of M1-like macrophages but a trending decrease in M2A, alongside the robust upregulation of distinct pro-tumoral surface markers such as TREM2, GPNMB, LAIR1, and LRP1. GSEA further confirms that these tumor-associated macrophages (TAMs) undergo metabolic reprogramming, including HIF-1 signaling and central carbon metabolism, mirroring tumor epithelial cells and suggesting their active role in shaping the immunosuppressive TME.
Intercellular communication analysis (Sections 11, 12, 14) shows a dramatic increase in the number and complexity of cell-cell interactions in the TME. Key tumor-specific interactions include ADM-RAMP3 (stromal-immune), PGF-FLT1 (endothelial-macrophage, driving angiogenesis), and immune checkpoint interactions such as VSIR-HLA-F (renal epithelial cell-T cell) and LGALS9-P4HB (endothelial-T cell). These pathways orchestrate angiogenesis, extracellular matrix remodeling, and immune suppression, highlighting the intricate crosstalk essential for tumor survival and progression. The identification of surfaceome markers unique to tumor renal epithelial cells (CD24, LY6E, VCAM1, CA12, and various HLA class I/II molecules) (Section 15) provides direct evidence of phenotypic changes linked to malignancy, immune modulation, and metastatic potential.
Finally, Gene Ontology and GSEA (Sections 17, 18) illuminate the underlying molecular programs. Diploid renal epithelial cells are characterized by robust metabolic activity and immune response pathways, reflecting their homeostatic and immune surveillance roles. In contrast, tumor renal epithelial cells exhibit significant metabolic reprogramming (upregulation of HIF-1, mTOR, p53, central carbon metabolism) and altered protein processing, consistent with aggressive proliferation and adaptation to the hypoxic TME. This comprehensive analysis paints a detailed picture of RCC progression, driven by genomic instability, cellular plasticity, and a complex, highly interactive microenvironment.
Hypotheses:
- Aneuploidy in renal epithelial cells is a primary driver of metabolic reprogramming (e.g., HIF-1 signaling, central carbon metabolism) and immune modulation, which collectively promote tumor growth and immune evasion in kidney cancer.
- Tumor-associated macrophages (TAMs) in the kidney tumor microenvironment (TME) adopt a mixed M1/M2 phenotype with specific surface markers (e.g., TREM2, LAIR1, GPNMB) that orchestrate immunosuppression and angiogenesis, thereby fostering tumor progression despite the presence of cytotoxic T cells.
- The ADM-RAMP3 and PGF-FLT1 ligand-receptor axes represent critical communication pathways between stromal and immune cells that drive pathological angiogenesis and contribute to immune escape in renal cell carcinoma.
- The upregulation of specific surfaceome markers (e.g., CD24, LY6E, VCAM1, CA12) on malignant renal epithelial cells mediates their increased proliferative, migratory, and immune evasive capabilities, contributing to tumor aggressiveness and metastasis.
- A significant fraction of 'unassigned' cells within tumor samples are malignant renal epithelial cells that have undergone dedifferentiation or epithelial-mesenchymal transition, thereby adopting altered transcriptional profiles while retaining tumor-specific genomic aberrations.
Potential therapeutic targets:
- HIF-1 signaling pathway: Upregulated in malignant renal epithelial cells, tumor-associated macrophages, and endothelial cells within the tumor microenvironment, driving metabolic reprogramming, hypoxia adaptation, and angiogenesis essential for tumor growth and survival. Evidence: GSEA (Section 18) shows strong positive enrichment of 'HIF-1 signaling pathway' in tumor renal epithelial cells, macrophages, and endothelial cells. GO analysis (Section 17) also identifies 'HIF-1 signaling pathway' enrichment in tumor renal epithelial cells. Validation: Evaluate the efficacy of HIF-1α inhibitors (e.g., belzutifan) as monotherapy or in combination with existing RCC treatments in preclinical models and clinical trials, monitoring tumor growth and metabolic markers.
- TREM2 (Triggering Receptor Expressed on Myeloid Cells 2): Highly expressed on tumor-associated macrophages (TAMs), TREM2 is implicated in promoting tumor progression, immunosuppression, and survival of TAMs in various cancers. Evidence: Upregulated in macrophages from tumor samples as a condition-specific surfaceome marker (Section 16). CCI analysis (Section 11) also identifies TREM2 interactions, suggesting its role in the TME. Validation: Develop and test TREM2-blocking antibodies or small molecule inhibitors to reprogram TAMs towards an anti-tumoral phenotype, or deplete pro-tumoral TAMs in preclinical kidney cancer models. Evaluate its potential as a combination therapy target with immune checkpoint inhibitors.
- ADM-RAMP3 axis (Adrenomedullin-Receptor Activity-Modifying Protein 3): A highly significant cell-cell interaction in the tumor microenvironment, particularly between stromal cells (SMC) and immune cells (macrophages, T cells), known to promote angiogenesis, inflammation, and immune suppression. Evidence: Identified as a highly expressed and significant interaction in tumor CCI analysis (Sections 12, 14), involving SMC, macrophages, and T cells. Validation: Develop blocking antibodies or antagonists against ADM or RAMP3 and test their ability to inhibit tumor growth, angiogenesis, and enhance anti-tumor immunity in preclinical models of kidney cancer.
- CD24 and LY6E: Both CD24 and LY6E are significantly upregulated surfaceome markers on malignant renal epithelial cells and are associated with cancer stem cell properties, metastasis, and poor prognosis. Evidence: Prominent upregulation as tumor-specific surfaceome markers in renal epithelial cells (Section 15), particularly in aneuploid tumor cells. Validation: Develop Antibody-Drug Conjugates (ADCs) or CAR T-cell therapies targeting CD24 or LY6E to selectively eliminate tumor cells expressing these markers, and assess their efficacy in preclinical models and patient-derived organoids.
Follow-up validation ideas:
- Genomic Alterations Validation: Perform Fluorescence In Situ Hybridization (FISH) or quantitative PCR (qPCR) to validate recurrent CNVs (e.g., 3p deletion, 5q/12q amplifications) in a larger cohort of fresh-frozen or FFPE kidney tumor samples, correlating results with ploidy status and clinical outcomes.
- Cell Type Phenotyping and Functional Validation: Use multiplex immunofluorescence (mIF) or Imaging Mass Cytometry (IMC) on tissue sections to validate the spatial distribution and co-expression of identified cell type-specific surface markers (e.g., TREM2, LAIR1 on macrophages; CD24, VCAM1 on renal epithelial cells). Subsequently, perform *in vitro* functional assays (e.g., cytokine production, phagocytosis, proliferation) on sorted cell populations to confirm their functional states.
- Cell-Cell Interaction Functional Assays: Establish co-culture systems using patient-derived tumor epithelial cells, macrophages, and T cells to experimentally validate key ligand-receptor interactions (e.g., ADM-RAMP3, VSIR-HLA-F). Use receptor blocking antibodies or genetic knockdowns/knockins to assess the impact on tumor cell proliferation, immune cell activity, and macrophage polarization.
- Metabolic Reprogramming Confirmation: Conduct targeted metabolomics or stable isotope tracing experiments on sorted tumor renal epithelial cells and tumor-associated macrophages to confirm the predicted shifts in central carbon metabolism and HIF-1 signaling pathways, and identify critical metabolic vulnerabilities.
- In Vivo Therapeutic Efficacy: Utilize syngeneic or humanized xenograft mouse models of renal cell carcinoma to test the *in vivo* efficacy of inhibiting identified therapeutic targets (e.g., small molecule inhibitors against mTOR or HIF-1; antibodies targeting ADM-RAMP3, VSIR, or surface markers like CD24) as single agents or in combination with existing immunotherapies.
Limitations:
This single-cell RNA-seq analysis provides valuable insights into gene expression patterns and inferred cellular states but does not directly capture protein expression levels, post-translational modifications, or dynamic cellular processes. Copy number variation inference is computational and requires validation with orthogonal genomic methods like FISH. Cell-cell interaction predictions are correlative and necessitate experimental validation to confirm functional causality. The observed inter-patient heterogeneity, especially in ploidy, suggests that findings may not generalize to all kidney cancer subtypes or stages. The functional states of immune cells (e.g., T cell exhaustion or macrophage activation) are inferred from transcriptional profiles, which might not fully capture their complex immunological roles. Finally, causality cannot be definitively established from this observational dataset alone.
19. Query List
- Show UMAP with condition, sample, major cell type, minor cell type, ploidy_dec, celltype_subset in 2 columns and save.
- Show major celltype score on UMAP and save.
- Show the overall Celltype_subset marker expression dot plot and save it. Keep target_cell as None and keep the other arguments at their default values.
- Show CNV heatmap for Renal Epithelial cell (tumor origin cells) and unassigned cells, grouped by sample, along with a summary of significantly amplified copy number regions, and save.
- Show CNV patterns as UMAP, including major cell type, minor cell type, ploidy results, condition, and sample, in 2 columns, and save.
- Show population bar plot for minor cell types and save.
- Show subset population barplot for T cells and save.
- Show subset population barplot for macrophages and save.
- Show boxplot for macrophage subset populations if there are significant differences between conditions, and save. Determine ncols appropriately based on the total number of panels.
- Show ploidy population barplot for Renal Epithelial cell (tumor origin cells) and unassigned cells, and save.
- Show cell-cell interaction patterns by condition, including Renal Epithelial cell (tumor origin cells), Fibroblast, Macrophage, and T cells, and save. Limit cell-cell interactions to a maximum of 80 per condition.
- Show cell-cell interactions by condition and save the result. Select at most 80 cell-cell interactions for each condition.
- Find statistically significant differences in cell-cell interactions by condition for major immune and stromal cells, show as a dot plot, and save. Set max_n_items_per_group = 25.
- Show the condition-specific markers for tumor-origin cells (Renal Epithelial cell) as a dot plot and save the result. Use only surfaceome markers, up to 50 markers per condition.
- Extract condition-specific markers for Macrophage and show as a dot plot, saving only surfaceome markers, up to 50 per condition.
- Show Gene Ontology (GSA) analysis results for epithelial cells as bar plots and save the result.
- Show Gene set enrichment analysis results as a dot plot for major cell types (Endothelial cell, ILC, Macrophage, Renal Epithelial cell, Smooth muscle cell, T cell CD4+, T cell CD8+), and save. Use RdBu_r as the color map and set n_pws_to_show = 80.