Single-Cell Transcriptomic and Genomic Landscape of Lung Cancer Progression: Elucidating Cellular Dynamics, Immune Evasion, and Therapeutic Vulnerabilities
This comprehensive single-cell analysis maps the molecular and cellular dynamics of lung cancer progression from normal to early and advanced tumor stages. Key findings include widespread genomic instability and aneuploidy in tumor-origin Lung Epithelial cells, coupled with their active proliferation driven by dysregulated cell cycle genes (e.g., MCM7, E2F4). The tumor microenvironment undergoes significant remodeling, characterized by decreased anti-tumor NK cell populations, increased immunosuppressive regulatory T cells (Treg), and a shift towards pro-tumorigenic M2B macrophages. Pathological cell-cell interactions, particularly involving EGFR, TGF-beta, and CD47-SIRPα signaling, establish an immune-evasive and pro-growth niche. Condition-specific surface markers further reveal distinct phenotypes for malignant epithelial cells, tumor-associated macrophages, and fibroblasts, highlighting potential diagnostic and therapeutic vulnerabilities.
Contents
- Dataset overview
- UMAP Visualization of Single-Cell RNA-Seq Data by Condition, Sample, Cell Type, and Ploidy
- Major Cell Type Score and Ploidy Distribution on UMAP
- Celltype Subtype Marker Expression Analysis for Annotation Validation
- Tumor-Origin Lung Epithelial Cell CNV Analysis: Patterns and Clinical Significance
- UMAP Visualization of CNV Patterns across Cell Types, Ploidy, and Conditions in Lung Tissue
- Minor Cell Type Population Analysis Across Lung Conditions
- T Cell Subtype Population Dynamics Across Lung Tissue Conditions
- T cell Subset Population Analysis Across Lung Conditions
- Macrophage Subset Population Analysis Across Lung Cancer Conditions
- Macrophage Subset Population Shifts Across Lung Cancer Progression
- Ploidy Status of Lung Epithelial Cells Across Normal, Early, and Advanced Lung Cancer Conditions
- Cell-Cell Interaction Patterns in Lung Cancer Microenvironment
- Immune Checkpoint and Cell Cycle Pathway Cell-Cell Interactions Across Lung Cancer Progression
- Condition-Specific Cell-Cell Interaction Patterns in Lung Cancer
- Lung Epithelial Cell Condition-Specific Surfaceome Markers
- Macrophage Condition-Specific Surfaceome Markers in Lung Tissue
- Fibroblast Condition-Specific Surfaceome Markers in Normal and Early-Stage Lung Tumors
- CD4+ T Cell Condition-Specific Surfaceome Markers in Lung Cancer
- Dysregulation of Cell Cycle Pathway Genes in Lung Epithelial Cells Across Tumor Progression
- Lung Epithelial Cell Gene Ontology (GSA) Analysis: Condition-Specific Pathway Enrichment
- Gene Set Enrichment Analysis (GSEA) Across Cell Types and Conditions in Lung Tissue
- Discussion
- Query List
0. Dataset overview
Dataset Summary
- Total Cells & Genes: This dataset contains 84,300 cells and 23,489 genes.
- Species & Tissue: The data is from human lung tissue.
- Conditions: It includes data from three conditions: Tumor (advanced), Tumor (early), and Normal.
- Cell Type Hierarchy: Cells are annotated at three levels: major (e.g., T cell, Lung Epithelial cell), minor (e.g., T cell CD8+, Macrophage), and subset (e.g., T cell (Cytotoxic), Alveolar type 2).
- Tumor Origin Cell Type: Lung Epithelial cells are identified as the tumor origin cell type.
- Ploidy Information: Cells are categorized by ploidy as 'Aneuploid' or 'Diploid'.
Precomputed Analyses: The dataset includes precomputed results for
- Cell-Cell Interactions (CCI) per condition and sample.
- Differential Expression Genes (DEG) comparing conditions (vs. rest and vs. Normal reference) for various cell types.
- Gene Set Enrichment Analysis (GSEA) for conditions (vs. rest and vs. Normal reference).
- Gene Ontology (GO/GSA) for conditions (vs. rest and vs. Normal reference).
- Copy Number Variation (CNV) estimates (obsm['X_cnv']).
1. UMAP Visualization of Single-Cell RNA-Seq Data by Condition, Sample, Cell Type, and Ploidy
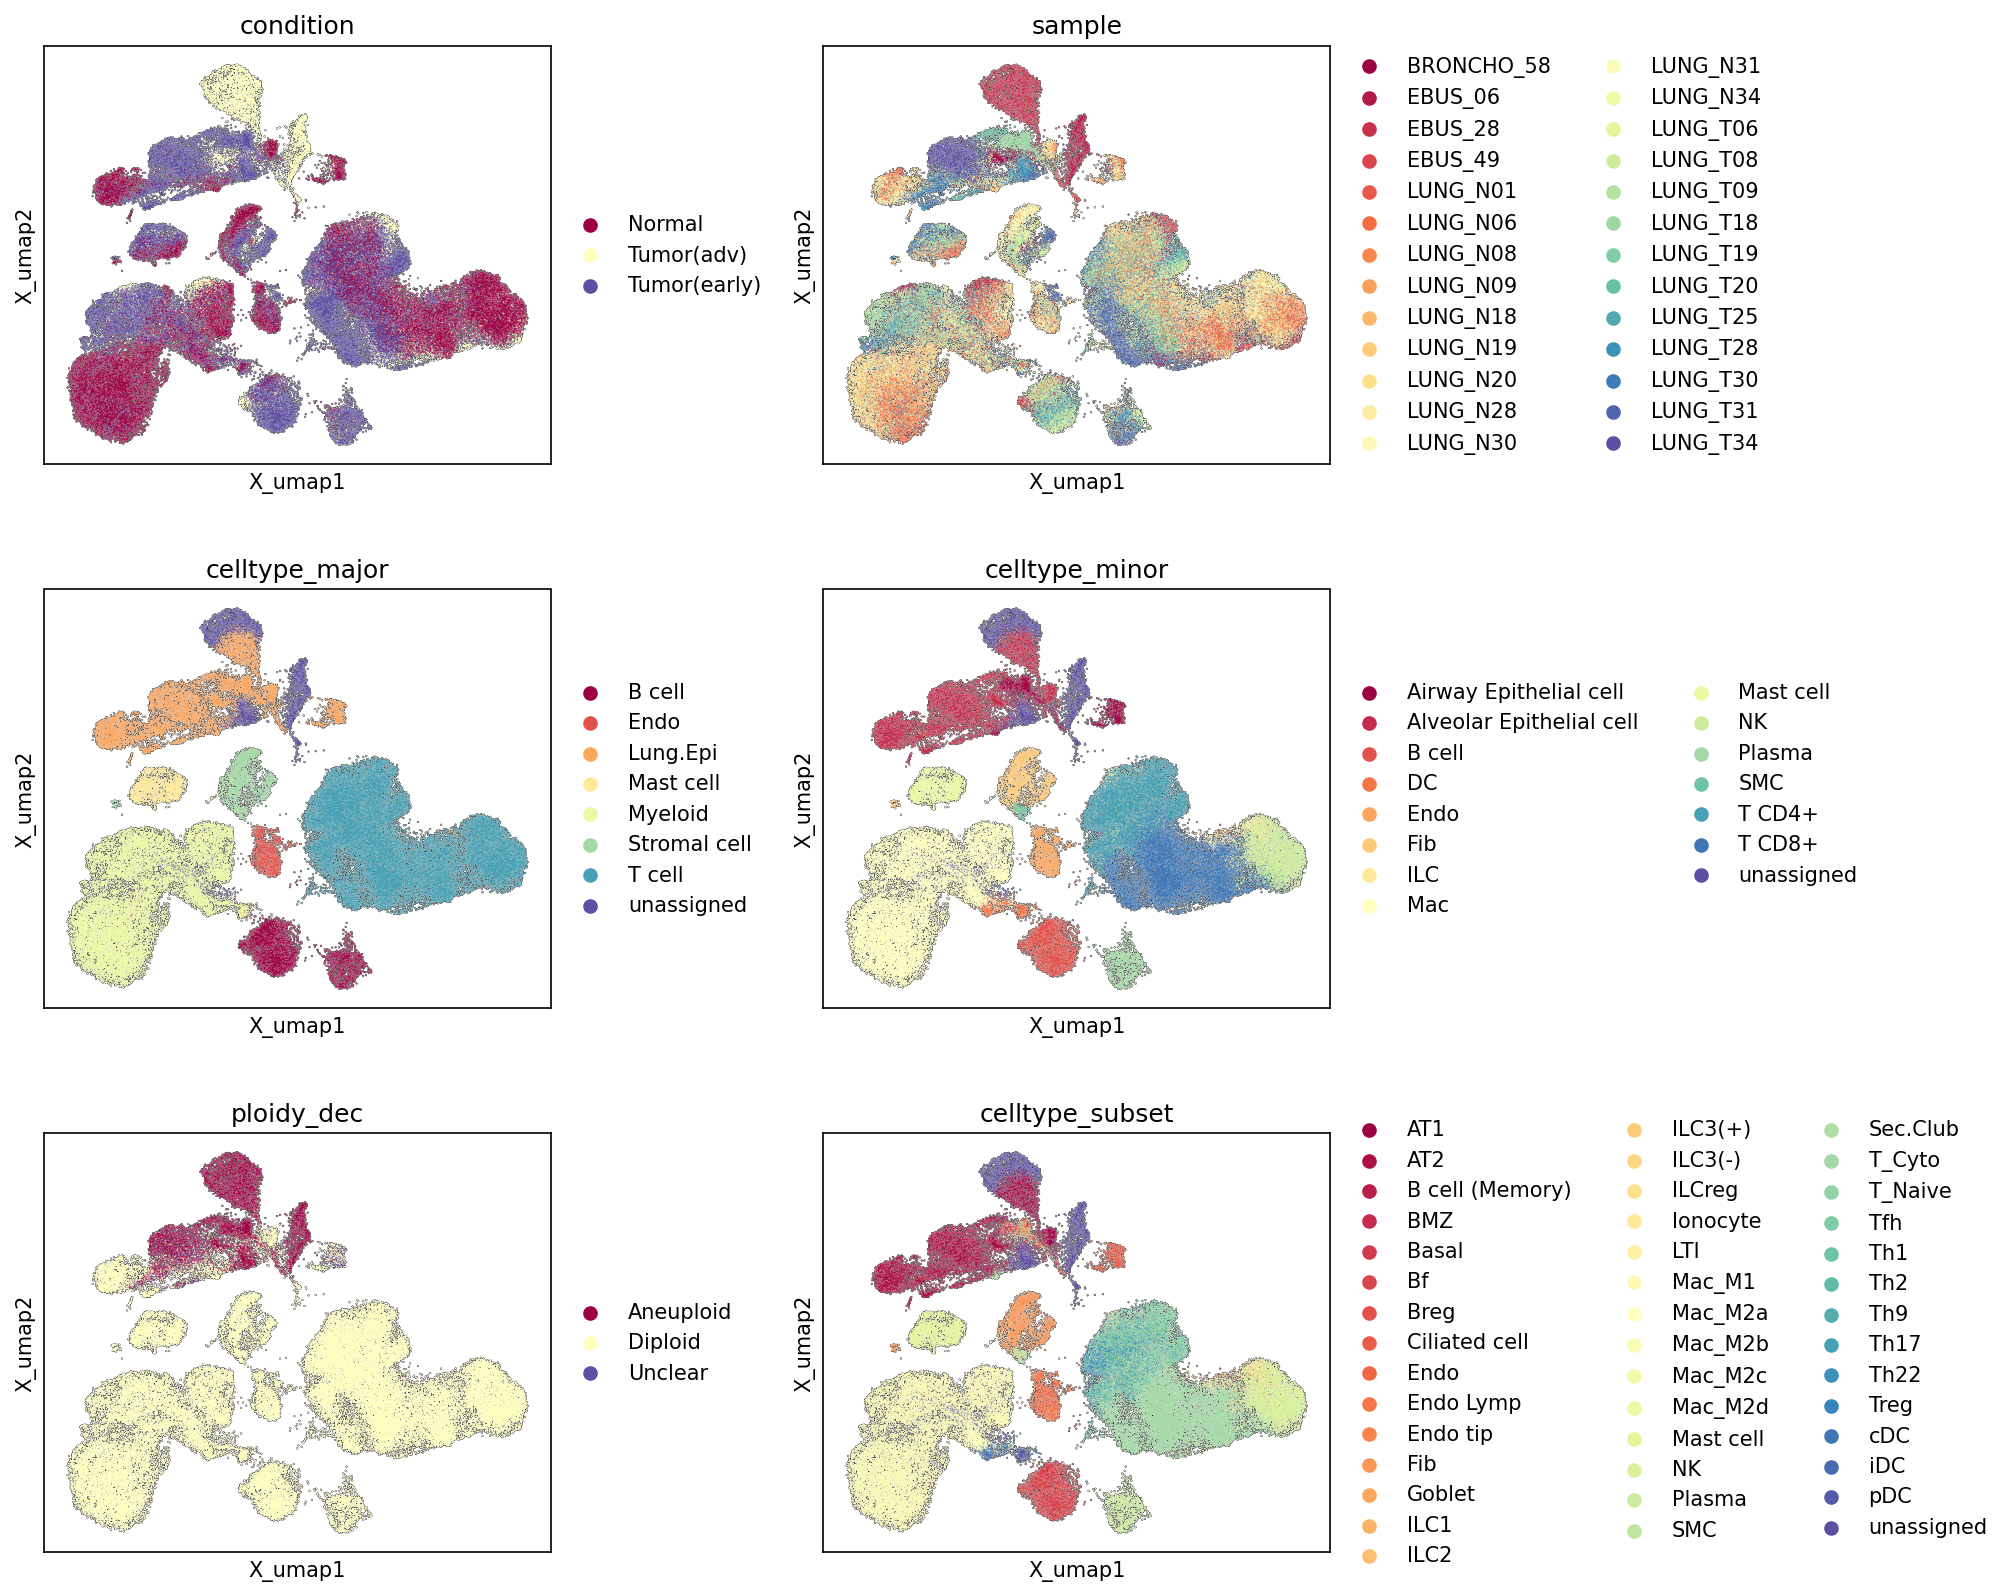
[Analysis Visualization Results]...
Analysis Overview
This analysis presents Uniform Manifold Approximation and Projection (UMAP) plots, a dimensionality reduction technique used to visualize the high-dimensional single-cell RNA sequencing data in a 2D space. The UMAPs are colored by various metadata attributes, including condition, sample, celltype_major, celltype_minor, ploidy_dec, and celltype_subset. This comprehensive visualization allows for an assessment of dataset structure, cell type clustering quality, sample integration, and the distribution of key biological features like tumor condition and ploidy status.
Visual Summary
Condition UMAP
The UMAP colored by condition (Normal, Tumor(adv), Tumor(early)) reveals distinct segregation between normal and tumor cells. Normal cells (dark red) form a well-defined set of clusters primarily located on the left and upper-left regions of the UMAP. Tumor cells, both advanced (light yellow) and early (dark blue), largely occupy the central and right portions of the embedding. While there's a clear separation from normal cells, Tumor(early) and Tumor(adv) cells show substantial intermixing, suggesting a continuum of transcriptional states during tumor progression or shared cellular adaptations within the tumor microenvironment.
Sample UMAP
The sample UMAP displays a remarkable intermixing of cells from different samples across the entire embedding. This indicates successful integration of data, effectively minimizing strong sample-specific batch effects and allowing for a robust biological interpretation across diverse patient samples. While some small, peripheral clusters might be enriched for specific samples, the overall distribution suggests that the biological signals are dominant over technical variations.
Cell_type_major UMAP
The celltype_major UMAP shows excellent separation of distinct cell lineages. Large, well-defined clusters are observed for:
- T cells (cyan), predominantly located in the lower-right and upper-right.
- Lung Epithelial cells (orange), forming distinct groups in the mid-left and upper regions.
- Myeloid cells (yellow-green), typically found in the lower-mid region, often adjacent to T cells.
- Smaller, yet clearly delineated, clusters represent B cells (dark red), Endothelial cells (red-orange), Mast cells (light yellow), and Stromal cells (green).
The clear boundaries between these major cell types affirm the robustness of the initial cell type annotation.
Cell_type_minor UMAP
Further refinement of the major cell types is evident in the celltype_minor UMAP:
- Within the T cell compartment, T cell CD8+ (dark blue) and T cell CD4+ (light blue) form distinct sub-clusters.
- Lung Epithelial cells are further resolved into Alveolar Epithelial cells (dark red) and Airway Epithelial cells (burgundy).
- Myeloid cells show distinct populations of Macrophages (yellow-green) and Dendritic cells (orange).
This level of detail indicates that the annotation captures expected biological heterogeneity and provides confidence in differentiating closely related cell populations.
Ploidy_dec UMAP
The ploidy_dec UMAP highlights the distribution of aneuploid and diploid cells. Aneuploid cells (dark red) are predominantly concentrated in specific, well-defined clusters, mainly in the upper-mid and left-mid regions. Diploid cells (light yellow) are broadly distributed across the majority of the UMAP, reflecting the abundance of normal and non-malignant cells. The distinct localization of aneuploid cells suggests they correspond to specific cellular populations.
Celltype_subset UMAP
The celltype_subset UMAP provides the highest resolution of cell type identities, revealing intricate sub-populations:
- Epithelial cells are further subdivided into Alveolar type 1 (AT1, burgundy), Alveolar type 2 (AT2, dark red), Secretory club cells (Sec.Club, light green), Goblet cells, Ciliated cells, and Basal cells.
- Within the T cell compartment, diverse subsets like T cell (Cytotoxic) (T_Cyto, light green), T cell (Naive) (T_Naive, beige), T cell (Treg) (dark blue), T cell (Tfh) (light yellow), and various helper T cell subsets (Th1, Th2, Th9, Th17, Th22) are distinctly represented.
- Macrophage populations are finely discriminated into Macrophage (M1) and various Macrophage (M2A, M2B, M2C, M2D) subtypes, indicating diverse polarization states.
- Other detailed subsets like different B cell types, ILCs, and Endothelial cell subtypes are also clearly defined.
This granularity further validates the comprehensive and high-resolution nature of the single-cell annotations.
Biological Interpretation
- Tumor Microenvironment Heterogeneity: The UMAPs clearly illustrate the profound transcriptomic differences between normal and tumor lung tissues. The spatial separation of normal cells from tumor cells in the condition UMAP suggests distinct underlying biological processes. The substantial overlap between early and advanced tumor stages could imply common adaptive mechanisms or a continuous evolution of the tumor cells and their microenvironment.
- Robust Cell Type Identification: The sequential resolution from celltype_major to celltype_minor and celltype_subset UMAPs demonstrates highly effective cell type annotation. The distinct clustering of cell populations at each hierarchical level, without excessive mixing, provides strong confidence in the assigned cell identities. This robust annotation is crucial for downstream analyses, ensuring that differential gene expression and pathway analyses are performed on biologically meaningful and homogeneous cell populations.
- Malignant Cell Identification through Ploidy: The localized distribution of Aneuploid cells in specific UMAP regions, particularly when compared with the celltype_major UMAP, strongly suggests these correspond to malignant cells. Given that Lung Epithelial cell is designated as the 'Tumor origin celltype', it is highly probable that these aneuploid clusters represent the transformed epithelial cells, which are a hallmark of lung cancer [1]. These aneuploid populations likely overlap with the Lung Epithelial cell clusters, especially those enriched in the Tumor(adv) and Tumor(early) conditions, providing a crucial biological marker for tumor cells within the dataset.
- Complex Immune Landscape: The detailed celltype_subset UMAP reveals the high diversity of immune cells within the lung tissue. The presence of various T cell subsets (cytotoxic, regulatory, helper T cells) and distinct macrophage polarization states (M1, M2 subtypes) highlights the complex immune responses active in the lung, likely shaped by the tumor microenvironment. Understanding the precise distribution and activation states of these immune cells is critical for deciphering anti-tumor immunity and immune evasion mechanisms.
Annotation Notes
- The unassigned cell clusters in celltype_major and celltype_minor UMAPs are sparsely distributed rather than forming a single cohesive cluster. This suggests these cells might represent rare populations, transitional states between defined cell types, or cells of ambiguous quality that did not clearly fit into predefined categories. Further investigation into these unassigned cells might uncover novel cell states or populations.
- The Unclear category for ploidy_dec is minimal, indicating a high confidence level in the ploidy inference for the vast majority of cells, which is important for distinguishing malignant from non-malignant cells.
---
References:
- Aneuploidy in Cancer: For general information on aneuploidy as a hallmark of cancer. PubMed search: "aneuploidy cancer" OR "aneuploidy tumor"
2. Major Cell Type Score and Ploidy Distribution on UMAP
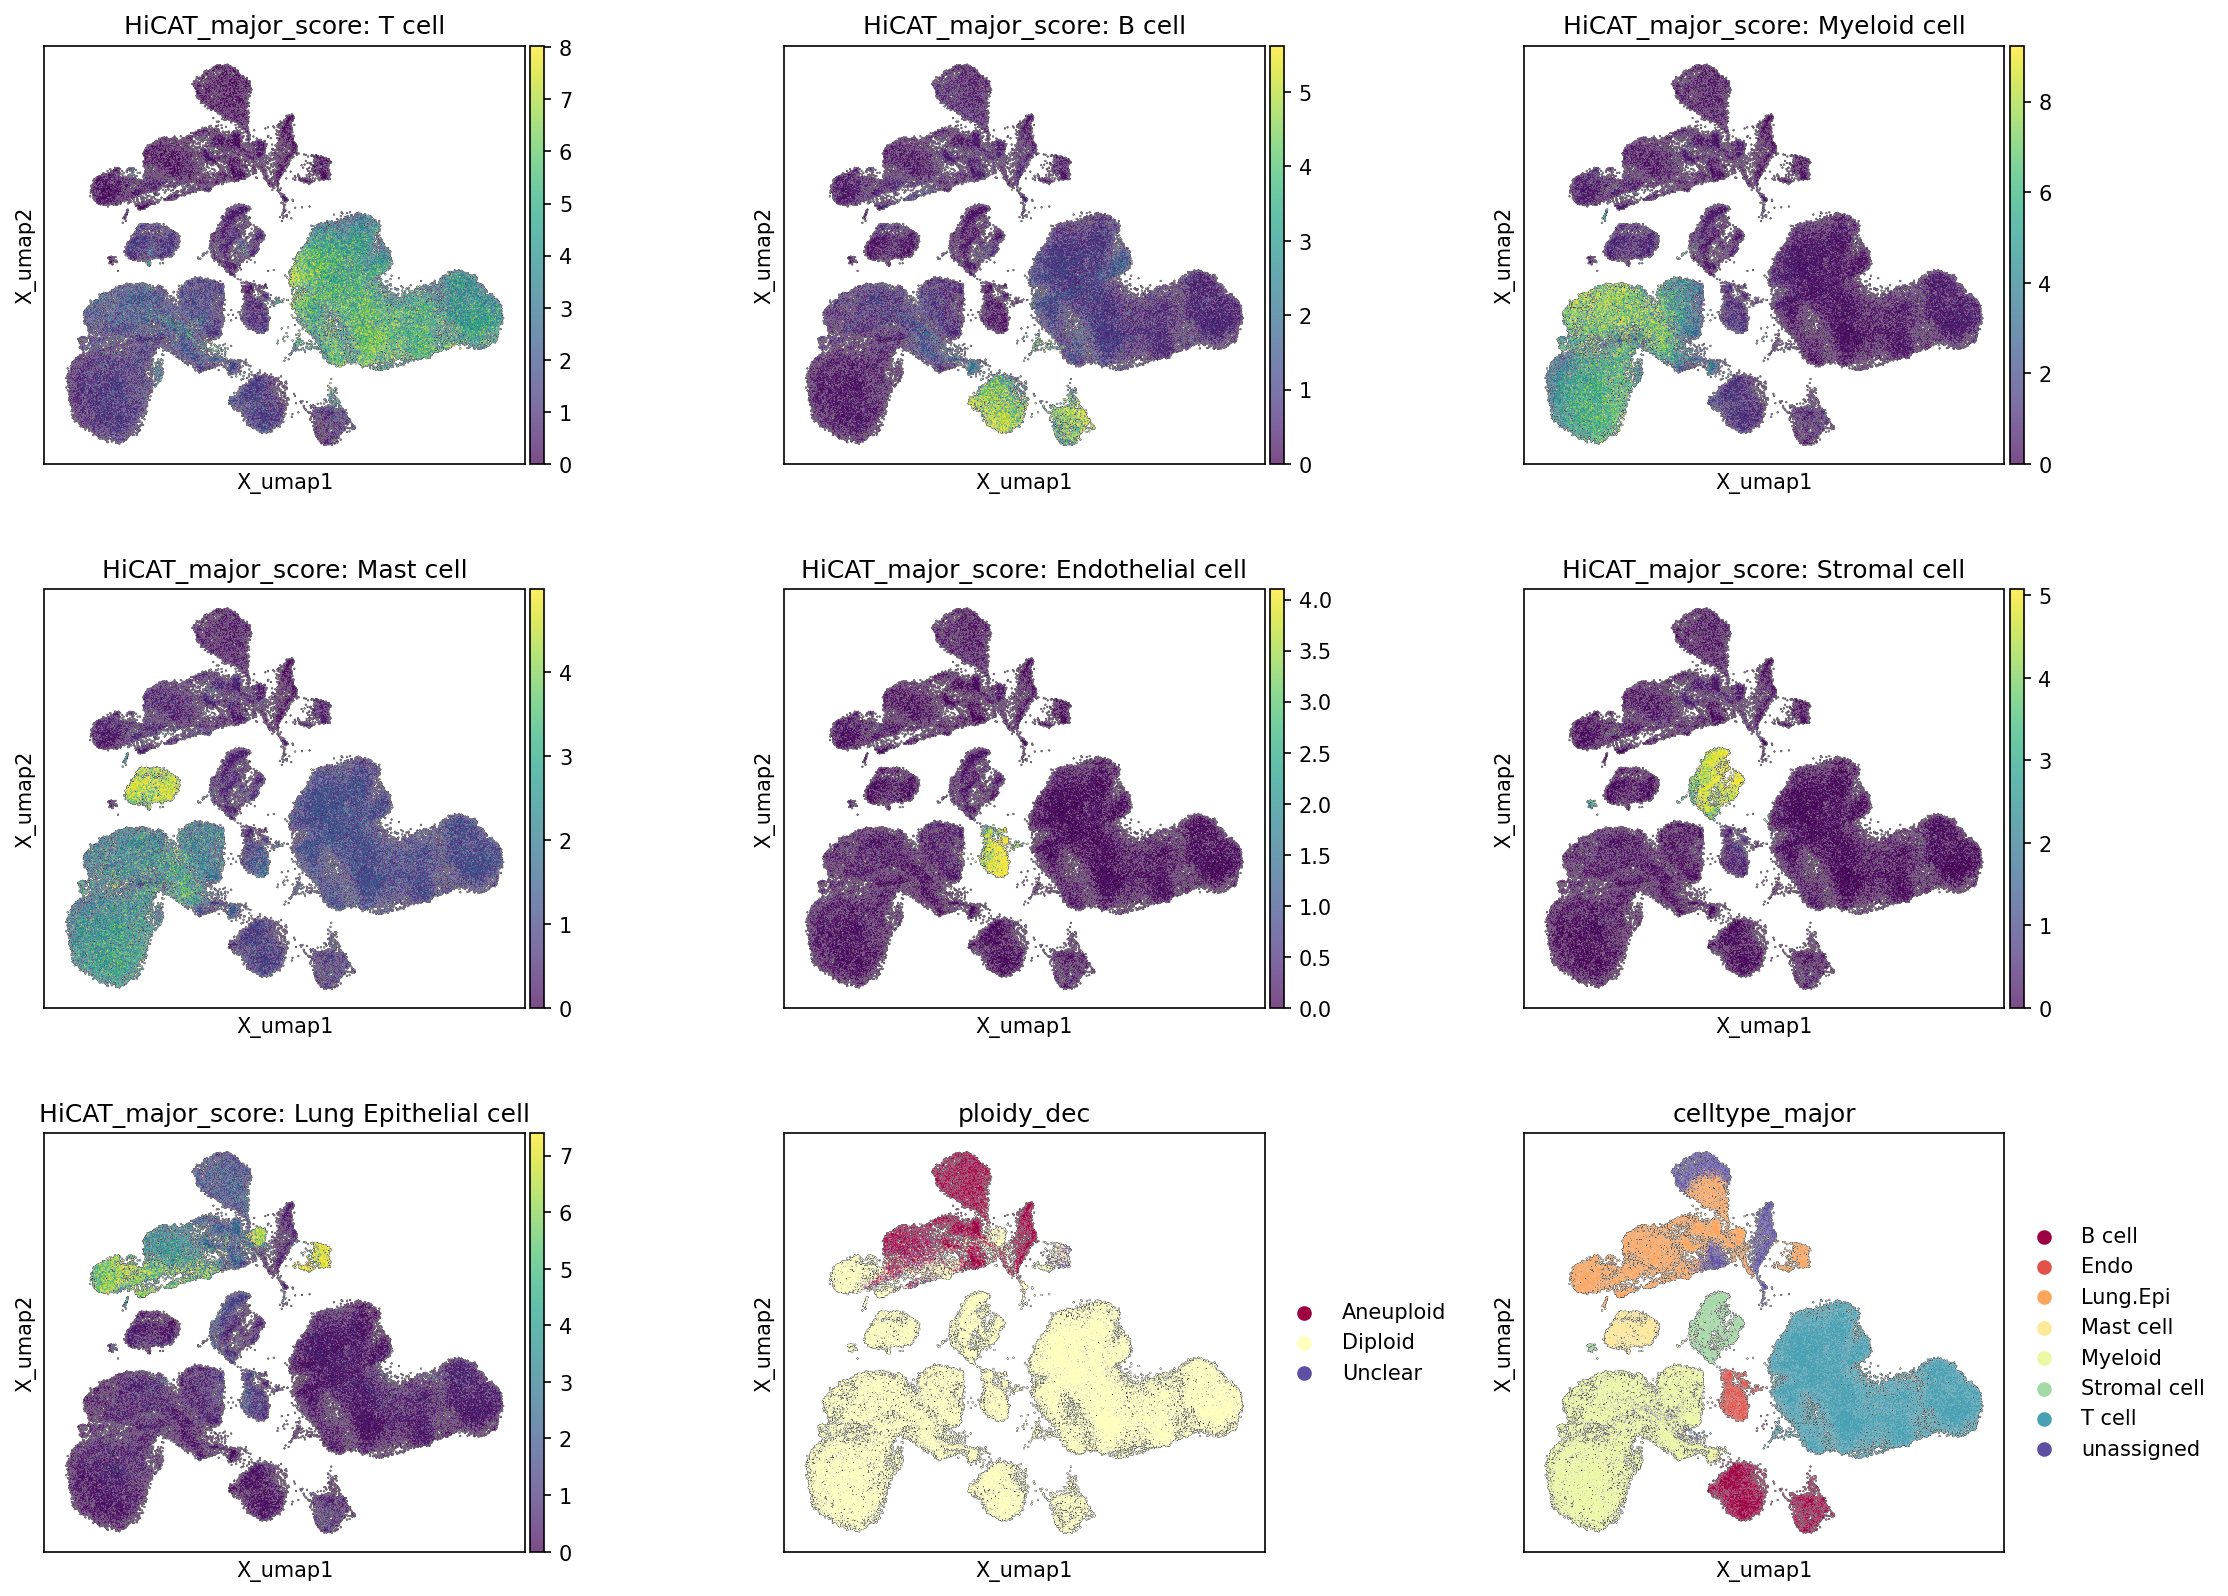
[Analysis Visualization Results]...
Analysis Overview
This analysis visualizes the distribution of major cell types inferred by HiCAT scores and their corresponding spatial relationships on a UMAP embedding. Additionally, it overlays ploidy status (Aneuploid/Diploid) and the pre-existing celltype_major annotations onto the same UMAP space. This allows for an assessment of cell type annotation quality and the identification of potentially malignant cell populations based on aneuploidy.
Visual Summary
The UMAP embedding reveals a complex cellular landscape, where different major cell types are largely organized into distinct clusters.
Cell Type Score Distribution:
- T cell (HiCAT_major_score: T cell): A prominent, large cluster on the right side of the UMAP exhibits high T cell scores (bright yellow). This strongly aligns with the "T cell" cluster identified by celltype_major (teal color), indicating robust identification.
- Myeloid cell (HiCAT_major_score: Myeloid cell): Another large cluster, primarily on the left-central side, shows high myeloid cell scores. This corresponds well with the "Myeloid cell" cluster in celltype_major (light green).
- Lung Epithelial cell (HiCAT_major_score: Lung Epithelial cell): High scores for Lung Epithelial cells are concentrated in distinct clusters located towards the top-left and top-central regions. These regions are clearly demarcated as "Lung.Epi" (beige/light yellow) in the celltype_major plot.
- B cell (HiCAT_major_score: B cell): A smaller, well-defined cluster with high B cell scores is visible near the top-left. This matches the "B cell" cluster in celltype_major (maroon).
- Mast cell (HiCAT_major_score: Mast cell): A very compact, distinct cluster showing high Mast cell scores is observed on the left side, accurately reflecting the "Mast cell" cluster (yellow) in celltype_major.
- Endothelial cell (HiCAT_major_score: Endothelial cell): High scores for Endothelial cells are present in a few smaller, distinct regions, particularly in the top-middle and bottom-middle, consistent with the "Endo" clusters (orange) in celltype_major.
- Stromal cell (HiCAT_major_score: Stromal cell): A cluster showing elevated stromal cell scores is visible towards the central-left, aligning with the "Stromal cell" cluster (dark green) in celltype_major.
Ploidy Status (ploidy_dec):
- The ploidy_dec plot highlights a clear spatial segregation of Aneuploid (maroon) and Diploid (light yellow) cells.
- A significant proportion of cells identified as Aneuploid (maroon) are predominantly localized within the clusters corresponding to Lung Epithelial cells (top-left and top-central regions).
- Conversely, the vast majority of T cells, Myeloid cells, B cells, Mast cells, Endothelial cells, and Stromal cells appear to be Diploid (light yellow), as expected for non-malignant populations.
Celltype Annotation (celltype_major):
- The celltype_major plot serves as a reference, showing the well-separated clusters for each cell type (T cell, Lung Epithelial cell, Myeloid cell, B cell, Mast cell, Stromal cell, Endothelial cell, unassigned). The colors for each cell type align directly with the distinct regions of high scores in the individual HiCAT_major_score plots.
Biological Interpretation
The visualizations confirm a robust and well-separated clustering of major cell types within the UMAP embedding. The high correlation between the HiCAT_major_score for each cell type and the pre-annotated celltype_major clusters indicates high confidence in the cell type assignments generated by the scoring method. This is critical for downstream analyses, as accurate cell type identification is foundational.
A key observation pertains to the Lung Epithelial cell population. Given that "Lung Epithelial cell" is specified as the "Tumor origin celltype" in the data context, its co-localization with Aneuploid cells is highly significant. This strong overlap suggests that the aneuploid cell populations predominantly represent the malignant tumor cells derived from lung epithelial lineage. The presence of aneuploidy is a hallmark of cancer, reflecting genomic instability and often correlating with tumor progression and severity [1].
The observation that immune cells (T cells, B cells, Myeloid cells, Mast cells) and stromal cells (Fibroblasts, Smooth muscle cells, Endothelial cells) are largely Diploid is consistent with their expected non-malignant roles within the tumor microenvironment or normal tissue. While immune cells can exhibit functional changes in cancer, their genomic integrity typically remains diploid, unless they are undergoing specific transformation events (which are rare for typical tumor-infiltrating lymphocytes or myeloid cells).
Annotation Notes
The strong concordance between the HiCAT_major_score plots and the celltype_major reference plot confirms the quality and consistency of the major cell type annotations across the dataset. The scoring method effectively delineates distinct cell populations, reinforcing the confidence in the cell type labels used for subsequent analyses. The minor populations labeled as 'unassigned' in the celltype_major plot do not show clear high scores for any specific major cell type, which is expected for cells that couldn't be definitively classified into one of the predefined major types.
References
- Aneuploidy in Cancer: Search PubMed for "aneuploidy cancer hallmark" for extensive literature. Example: https://pubmed.ncbi.nlm.nih.gov/?term=aneuploidy+cancer+hallmark
3. Celltype Subtype Marker Expression Analysis for Annotation Validation
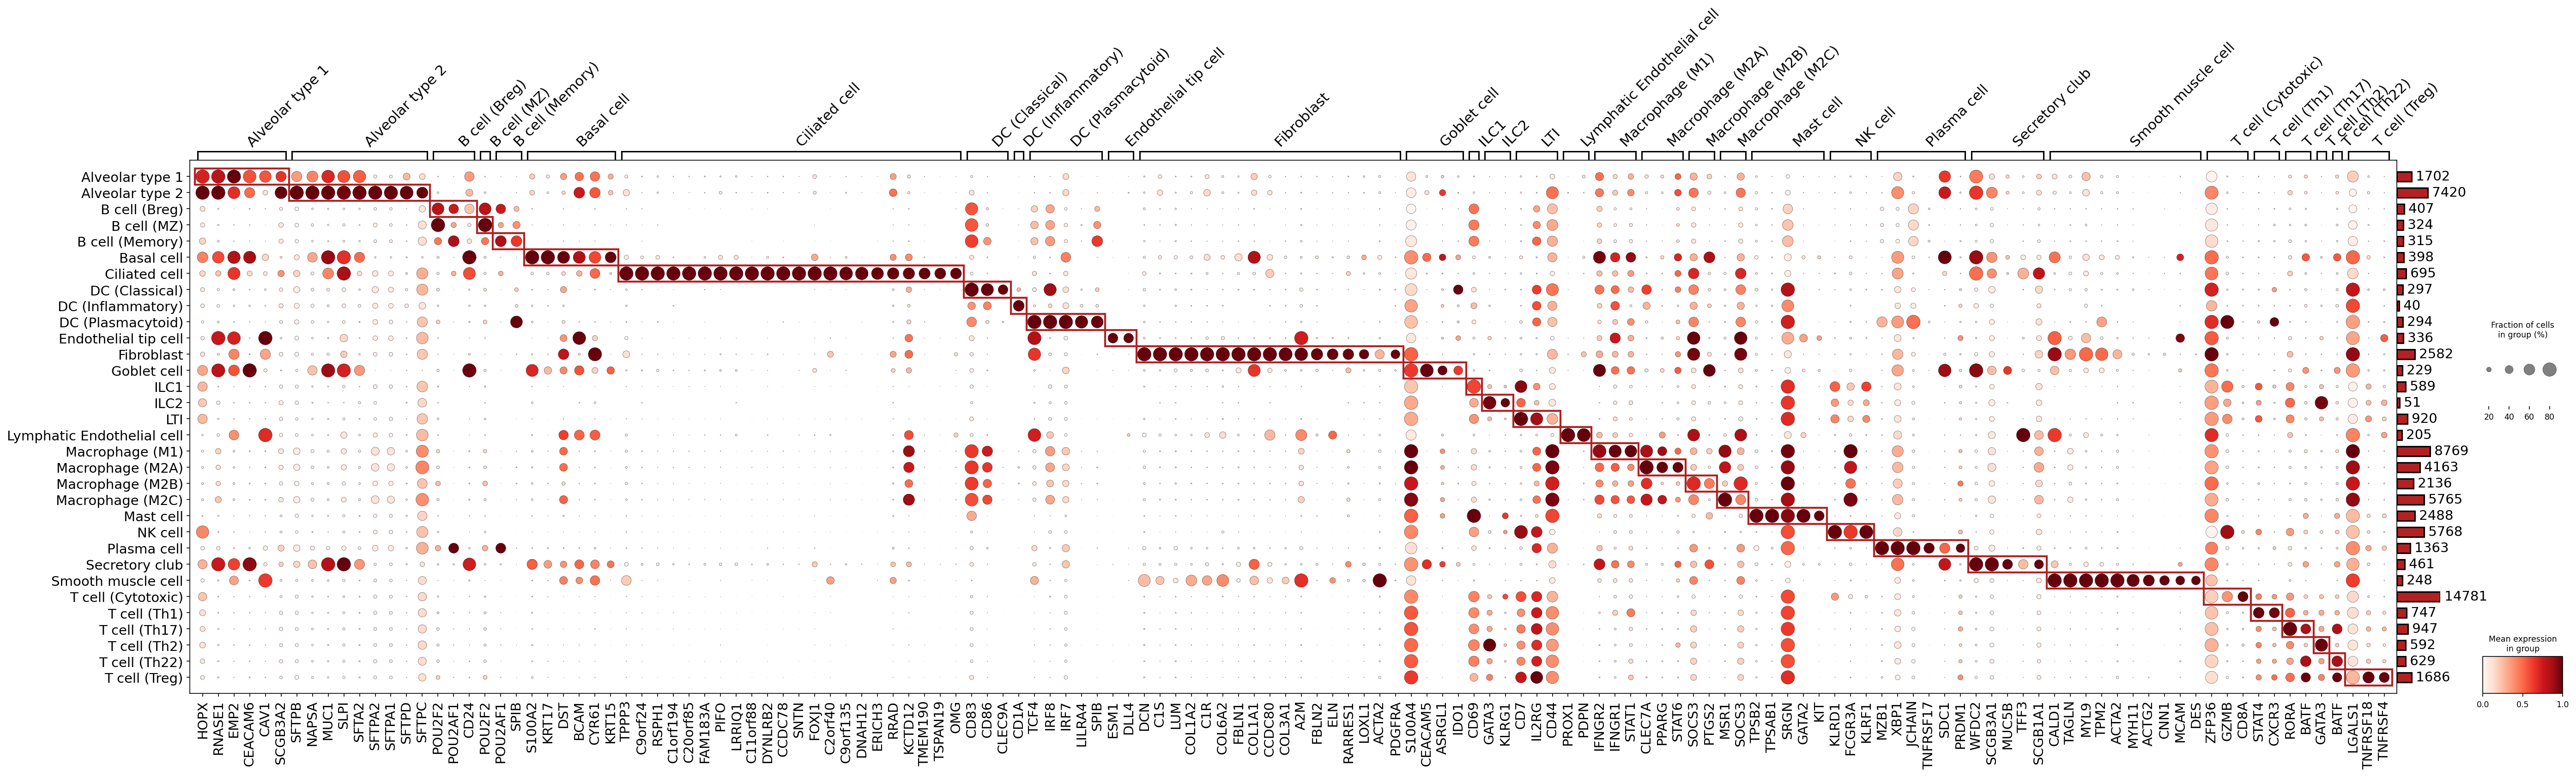
[Analysis Visualization Results]...
Analysis Overview
This analysis presents a dot plot illustrating the expression of key marker genes across different celltype_subset populations identified in the single-cell RNA-seq data from human lung tissue. The primary goal is to visualize cell type-specific gene expression patterns to validate the granular cell subtype annotations and assess their distinct molecular identities. Each dot's size represents the fraction of cells within a group expressing a particular gene, while its color intensity indicates the mean expression level of that gene within the group. The red boxes highlight marker genes that are particularly enriched and specific to a given cell subtype, aiding in the assessment of annotation quality.
Visual Summary
The dot plot effectively visualizes the distinct expression profiles of marker genes across 38 identified celltype_subset populations. A clear diagonal pattern of enriched gene expression is observed, where specific genes are highly expressed and prevalent in their corresponding cell subtypes, confirming the specificity of these markers.
- Distinct Cell Subtype Markers: Many cell subtypes exhibit highly specific marker gene expression, indicated by large, dark red dots primarily along the diagonal of the plot. For instance:
- Alveolar type 1 cells show strong and specific expression of *HOPX*.
- Alveolar type 2 cells are characterized by high expression of surfactant proteins like *SFTPC*, *SFTPB*, and *NAPSA*.
- B cell (Breg), B cell (MZ), and B cell (Memory) populations show shared B cell markers such as *POU2F2* and *CD24*, with some subtle differences potentially defining their subsets.
- Basal cells display prominent expression of *KRT5* and *KRT15*.
- Ciliated cells are marked by *FOXJ1* and *DNAH12*.
- Dendritic cell (Classical) and DC (Inflammatory) populations show enrichment of genes like *CD1A*, *CD83*, and *CD86*, while DC (Plasmacytoid) cells are characterized by *LILRA4* and *IRF7*.
- Endothelial cells (Endothelial tip cell, Lymphatic Endothelial cell) express genes like *PLVAP*, *PECAM1*, and *PROX1*.
- Fibroblasts show strong expression of collagen genes (*COL1A1*, *COL3A1*) and *DCN*.
- Goblet cells are distinct with high expression of mucin genes like *MUC5B* and *TFF3*.
- Macrophages (M1, M2A, M2B, M2C, M2D) share general macrophage markers such as *MSR1*, *SPP1*, and *CD68*, with some variations that might delineate their specific polarization states.
- Mast cells are clearly identified by *KIT*, *TPSAB1*, and *GATA2*.
- NK cells express *KLRD1* and *GZMB*.
- Plasma cells show characteristic markers like *JCHAIN* and *XBP1*.
- Secretory club cells are marked by *SCGB1A1* and *SCGB3A1*.
- Smooth muscle cells are identified by *ACTA2*, *MYH11*, and *TPM2*.
- T cell subsets (Cytotoxic, Th1, Th17, Th2, Th22, Treg) show appropriate T cell markers like *CD8A* (Cytotoxic) and *FOXP3* (Treg), with other subset-specific transcription factors or cytokine receptors.
- Minor Overlaps: While distinct, some markers show low-level expression or presence in a few other unrelated cell types, which could reflect shared biological functions or technical noise. However, the overall pattern remains highly specific.
- Cell Group Sizes: The bar plot on the right indicates the number of cells contributing to each celltype_subset, ranging from as few as 40 cells (ILC2, DC (Plasmacytoid)) to over 14,000 cells (T cell (Cytotoxic)). Most cell types have sufficient representation for reliable marker identification.
Biological Interpretation
The marker expression patterns observed in this dot plot strongly support the robust and granular annotation of celltype_subset populations within the human lung tissue. Each major cell lineage, such as epithelial cells, immune cells, stromal cells, and endothelial cells, is further subdivided into specific functional or developmental subtypes, and their molecular identities are confirmed by canonical marker gene expression.
- Epithelial Cell Diversity: The distinct expression of *SFTPC* and *SFTPB* in Alveolar type 2 cells (AT2) and *HOPX* in Alveolar type 1 cells (AT1) accurately reflects their specialized roles in surfactant production and gas exchange, respectively [1, 2]. The clear separation of Basal, Ciliated, Goblet, and Secretory club cells by markers like *KRT5*, *FOXJ1*, *MUC5B*, and *SCGB1A1* respectively, validates the comprehensive characterization of the airway epithelial lineage [3].
Immune Cell Lineage Confirmation:
- B cells are delineated into Breg, MZ, and Memory subtypes, although their specific markers here are more general B cell identifiers, suggesting further investigation might be needed for ultra-fine discrimination if required.
- Dendritic cells are appropriately segmented into classical, inflammatory, and plasmacytoid types using established markers such as *CD1A/CLEC9A* for conventional DCs and *LILRA4/IRF7* for pDCs [4].
- Macrophages (M1, M2A-D) exhibit general macrophage markers, indicating their myeloid origin. While general markers are shown, further analysis of specific gene sets or pathways might be required to fully confirm the functional polarization states (M1/M2 subtypes) in this context.
- Mast cells (e.g., *KIT*, *TPSAB1*) and NK cells (e.g., *KLRD1*, *GZMB*) are well-defined by their well-known markers, confirming their presence and identity [5, 6].
- Plasma cells are clearly identified by markers like *JCHAIN* (immunoglobulin joining chain) and *XBP1* (a key transcription factor for plasma cell differentiation) [7].
- T cell subsets (CD8+ Cytotoxic, CD4+ Th1, Th17, Th2, Th22, Treg) are distinguished by their lineage-specific markers and transcription factors (e.g., *CD8A*, *FOXP3* for Treg, *STAT4* for Th1, *RORC* for Th17, *GATA3* for Th2), supporting the high-resolution T cell phenotyping [8].
- Stromal and Endothelial Cell Clarity: The distinct markers for Fibroblasts (e.g., collagens, *DCN*), Smooth muscle cells (e.g., *ACTA2*, *MYH11*), and Endothelial cells (e.g., *PLVAP*, *PECAM1*) reinforce the accurate annotation of the structural and vascular components of the lung [9, 10]. The presence of *PROX1* as a lymphatic endothelial cell marker further refines the endothelial compartment.
Overall, the observed marker expression patterns align very well with established biological knowledge for human lung cell types, confirming the high quality and accuracy of the celltype_subset annotations.
Annotation Notes
This analysis provides strong evidence for the validity and specificity of the celltype_subset annotations. The distinct and expected expression of canonical marker genes across almost all identified cell subtypes confirms that these annotations accurately represent unique cell populations with characteristic molecular profiles. This robust annotation is critical for downstream analyses, ensuring that differential expression, pathway analysis, and cell-cell interaction studies are performed on accurately defined cell populations. The clear segregation of cell identities, even at a granular level (e.g., different T helper subsets, macrophage polarization states), highlights the success of the annotation strategy.
---
References:
- HOPX in Alveolar Type 1 Cells:
PubMed search: HOPX alveolar type 1
- SFTPC, SFTPB, NAPSA in Alveolar Type 2 Cells:
- Airway Epithelial Cell Markers:
PubMed search: KRT5 FOXJ1 MUC5B SCGB1A1 lung epithelium
- Dendritic Cell Markers:
PubMed search: CD1A CLEC9A LILRA4 IRF7 dendritic cell lung
- Mast Cell Markers:
- NK Cell Markers:
- Plasma Cell Markers:
- T Cell Subset Markers:
PubMed search: CD8A FOXP3 STAT4 RORC GATA3 T cell lung
- Fibroblast Markers:
PubMed search: COL1A1 DCN lung fibroblast
- Endothelial Cell Markers:
4. Tumor-Origin Lung Epithelial Cell CNV Analysis: Patterns and Clinical Significance
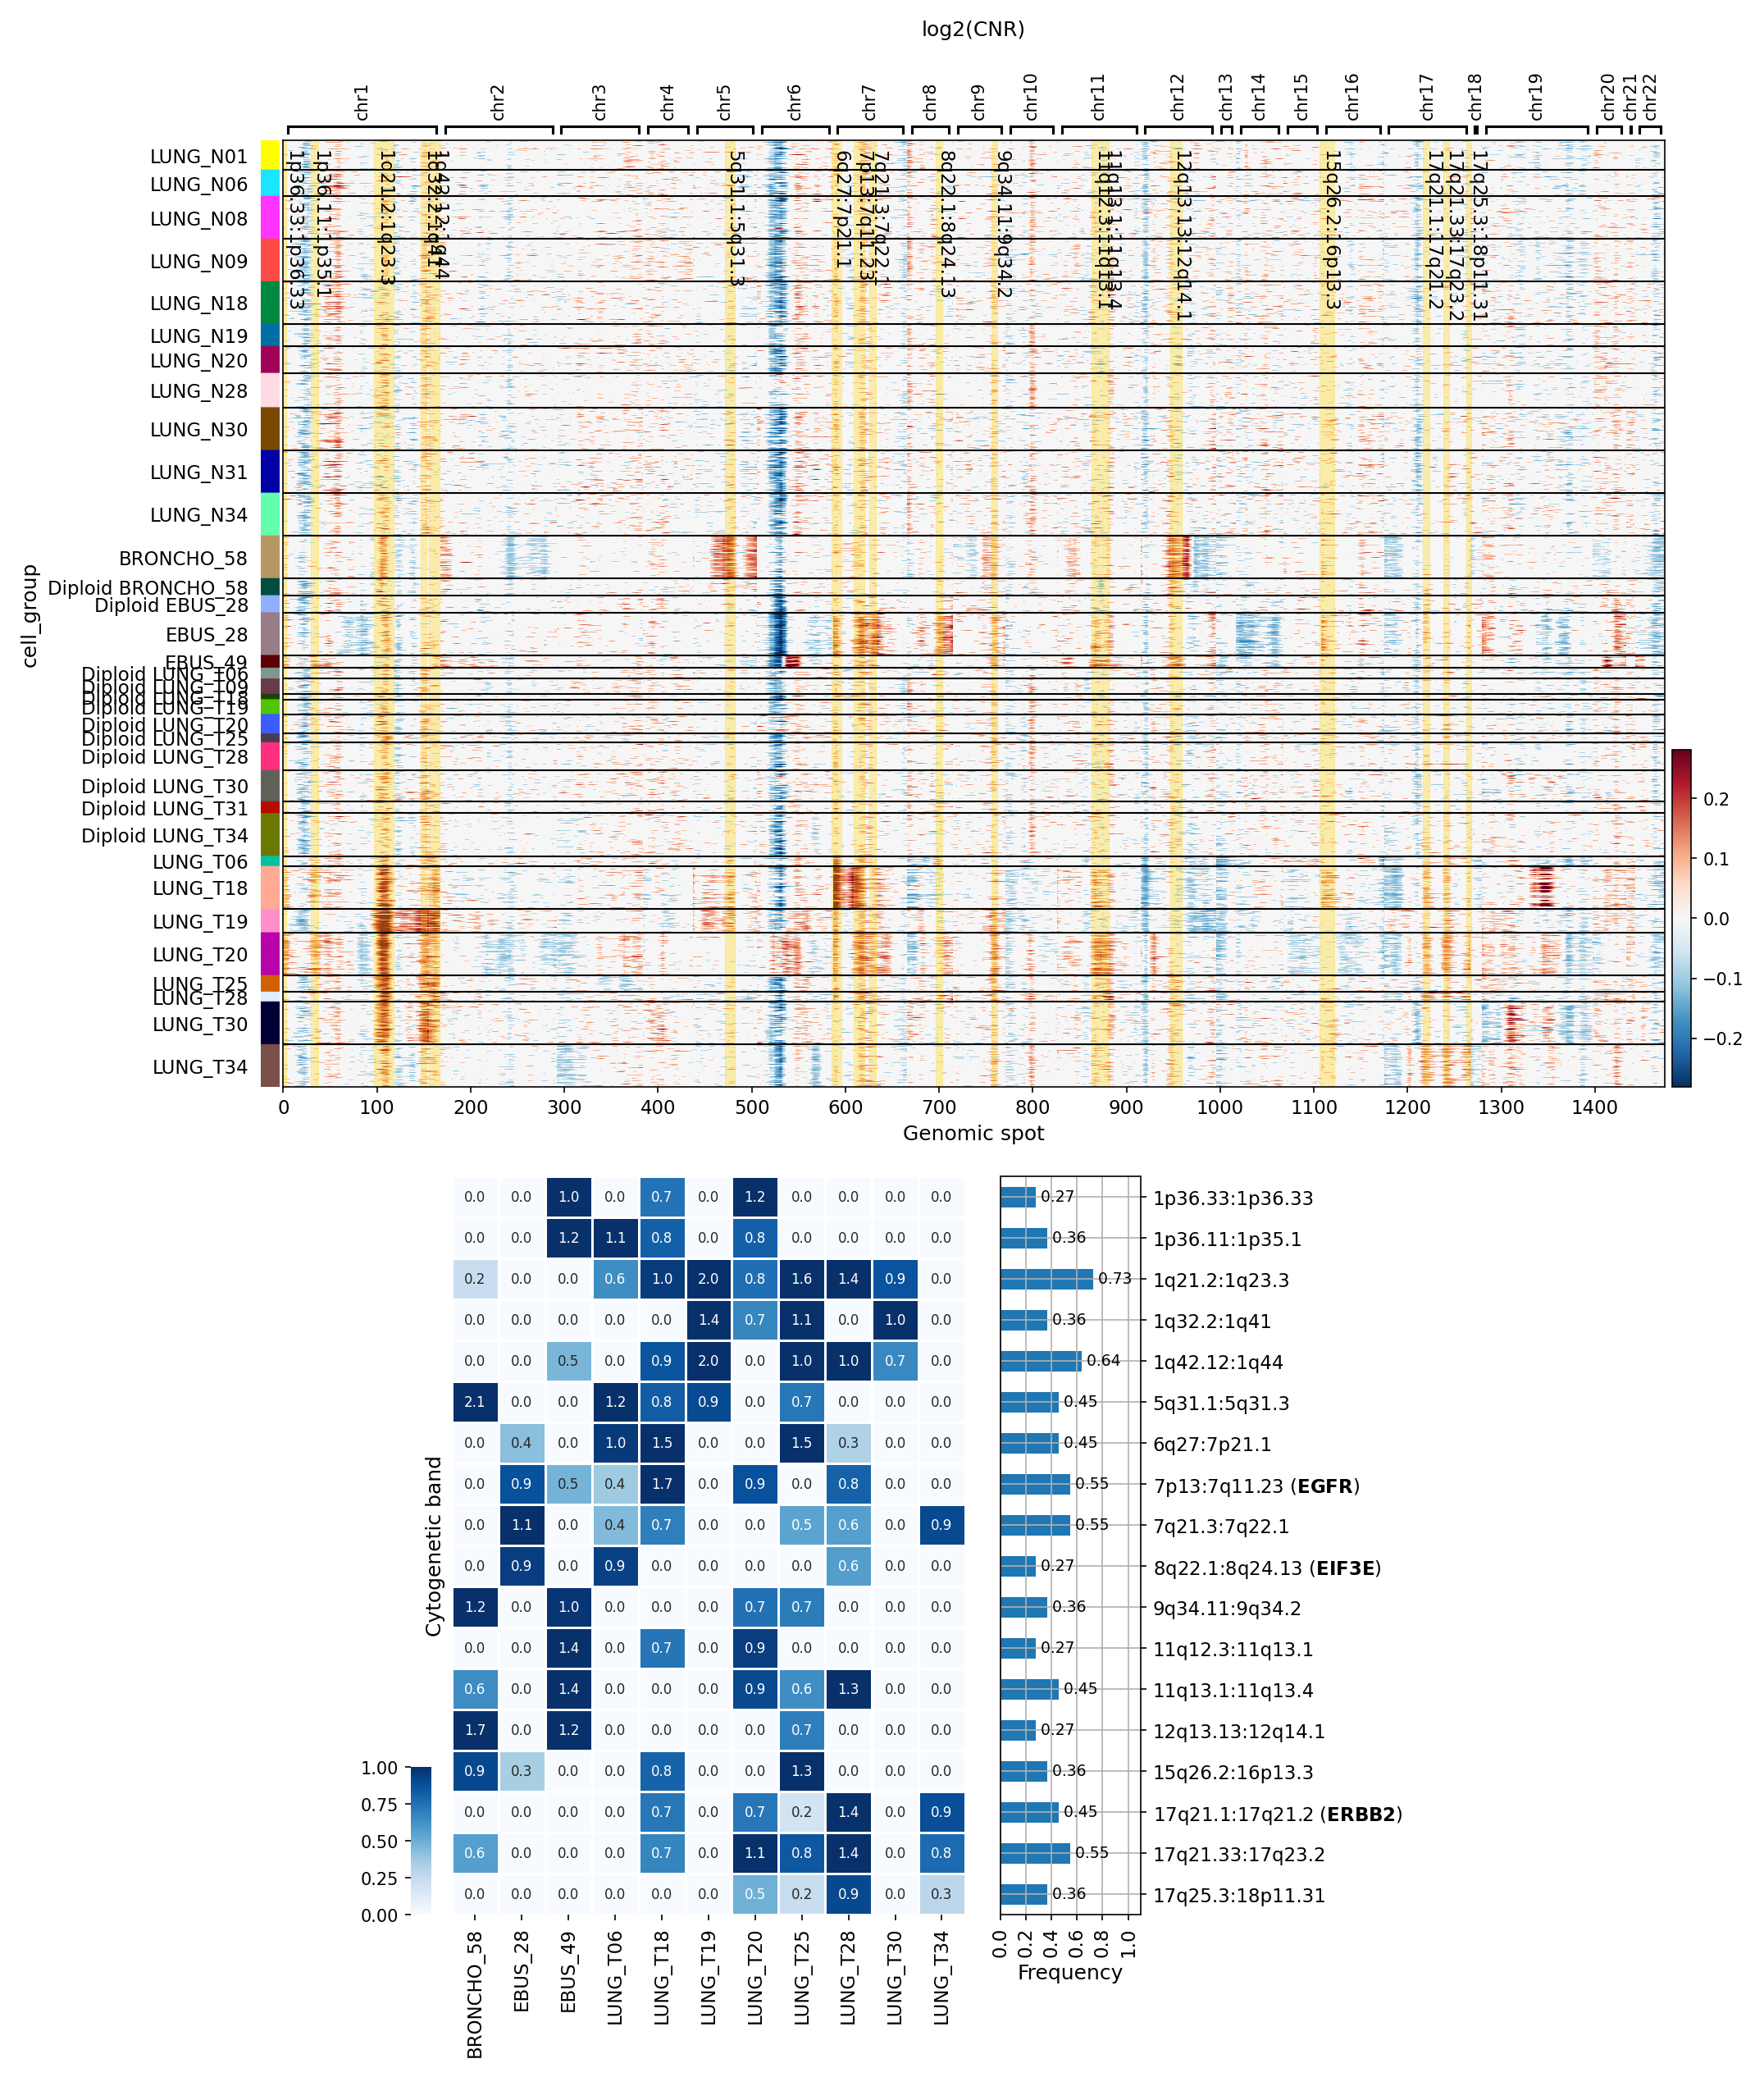
[Analysis Visualization Results]...
Analysis Overview
This analysis investigates copy number variations (CNVs) specifically within tumor-origin Lung Epithelial cells from single-cell RNA-seq data. The goal is to identify common and unique CNV patterns across different patient samples and conditions (Normal, Tumor(early), Tumor(adv)) and to summarize regions with significant amplifications. The results include a CNV heatmap displaying log2(CNR) values across genomic spots for each sample group, alongside a summary heatmap and bar plot highlighting the frequency of amplified cytogenetic bands.
Visual Summary
The visualization consists of two main parts: a CNV heatmap and a summary of significantly amplified regions.
CNV Heatmap (log2(CNR))
- Normal vs. Tumor Samples: The heatmap clearly segregates normal lung samples (LUNG_N01 to LUNG_N34) at the top from tumor-associated samples (BRONCHO_58, EBUS_28, EBUS_49, LUNG_Txx) below. Normal samples exhibit a relatively uniform, light color close to zero log2(CNR), indicating a diploid state with minimal CNV activity. In contrast, tumor-associated samples display extensive and varied patterns of copy number gains (red/brown) and losses (blue).
- Aneuploidy Patterns: Many tumor-associated samples, particularly those not prefixed with "Diploid" (e.g., LUNG_T06, LUNG_T18, LUNG_T19, LUNG_T20, LUNG_T25, LUNG_T28, LUNG_T30, LUNG_T34), show widespread and significant CNVs across multiple chromosomes, indicative of an aneuploid status. Some samples, explicitly labeled "Diploid LUNG_Txx", appear to have fewer global CNVs but may still harbor focal alterations.
- Recurrent CNV Regions: Several genomic regions show recurrent amplification or deletion across multiple tumor samples. For instance, amplifications are noticeable on chromosomes 1q, 5p, 7p, 8q, 12q, 17q, and deletions on chromosomes 3p, 4q, 6q, 9p, 10q, 13q, 16q. Specific cytogenetic bands are highlighted at the top of the heatmap, such as 1p36.33, 1p35.1, 1q21.2, 1q32.2, 5q31.1, 6q27, 7p11.23 (EGFR), 7q21.3, 8q22.1 (EIF3E), 9q34, 11q13.1, 12q13.13, 15q26.2, 17q21.17 (ERBB2), and 17q25.3.
Summary of Significantly Amplified Regions
- Recurrent Amplifications: The summary heatmap and bar plot quantify the frequency of amplification for specific cytogenetic bands across the analyzed tumor samples. Key recurrent amplification events include:
- 1q21.2:1q23.3 and 1q32.2:1q41: Frequently amplified, with frequencies up to 0.73 and 0.64 respectively.
- 5q31.1:5q13: Shows an amplification frequency of 0.45.
- 7p13:7p11.23 (EGFR): Amplified in a significant proportion of samples (frequency of 0.55), notably high in samples like LUNG_T06 and LUNG_T18.
- 8q22.1:8q24.13 (EIF3E): Amplified with a frequency of 0.27.
- 11q12.3:11q13.1 and 11q13.1:11q13.4: Show amplifications with frequencies of 0.36 and 0.27 respectively.
- 12q13.13:12q14.1: Amplified with a frequency of 0.45.
- 17q21.17:17q21.2 (ERBB2): Amplified with a frequency of 0.36, prominently in samples like BRONCHO_58 and LUNG_T20.
- Sample-Specific Patterns: While some amplifications are recurrent, specific samples show distinct amplification profiles. For example, BRONCHO_58 shows strong amplification across 1q and 17q (including ERBB2), while LUNG_T06 and LUNG_T18 show strong amplification at 7p (EGFR).
Biological Interpretation
The CNV analysis on Lung Epithelial cells provides crucial insights into the genomic instability and driver alterations in lung cancer.
- Tumor-Specific Genomic Instability: The stark contrast between normal and tumor samples highlights the extensive genomic instability characteristic of cancer cells. The presence of widespread CNVs in tumor cells, often reflecting aneuploidy, underscores a fundamental aspect of tumorigenesis, where abnormal chromosome numbers and structures contribute to uncontrolled cell proliferation and survival.
- Driver Gene Amplifications: The identification of recurrent amplifications in specific cytogenetic bands points to potential driver genes critical for lung cancer development and progression.
- EGFR (7p11.23): Epidermal Growth Factor Receptor (EGFR) amplification is a well-known oncogenic driver in non-small cell lung cancer (NSCLC), particularly in adenocarcinomas, which originate from epithelial cells. Amplification of EGFR leads to increased receptor expression and constitutive activation of downstream signaling pathways, promoting cell growth, survival, and metastasis. GeneCards: EGFR
- ERBB2 (HER2, 17q21.17): The ERBB2 gene, encoding HER2, is another receptor tyrosine kinase whose amplification is observed in various cancers, including a subset of lung cancers. ERBB2 amplification can lead to uncontrolled cell division and is associated with aggressive disease. GeneCards: ERBB2
- EIF3E (8q22.1): Eukaryotic Translation Initiation Factor 3 Subunit E (EIF3E) has been implicated in various cancers. Its overexpression or amplification can promote protein synthesis, which is often dysregulated in cancer to support rapid cell proliferation and tumor growth. GeneCards: EIF3E
- Confirmation of Tumor Origin: The observed extensive and recurrent CNVs strongly support the 'Lung Epithelial cell' annotation as the primary tumor cell population within these samples. Normal epithelial cells would typically maintain a stable, diploid genome.
- Ploidy Status: The distinction between "Diploid" and apparently aneuploid tumor samples (lacking the "Diploid" prefix based on the add_condition_prefix_to_aneuploid parameter) highlights the heterogeneity of genomic alterations even within tumor types. While some tumor cells may retain a near-diploid state, many progress towards aneuploidy, suggesting different evolutionary paths or stages of tumor development.
Clinical or Translational Implications
- Biomarker for Diagnosis and Prognosis: The presence and specific patterns of CNVs, especially amplifications of known oncogenes like EGFR and ERBB2, can serve as diagnostic or prognostic biomarkers for lung cancer. Their detection can indicate the presence of tumor cells and potentially predict disease aggressiveness.
- Therapeutic Targets: Amplifications of EGFR and ERBB2 are actionable targets in lung cancer. Patients with EGFR amplification (or activating mutations) often respond to EGFR tyrosine kinase inhibitors (TKIs). Similarly, ERBB2-amplified lung cancers may benefit from HER2-targeted therapies. Identifying these amplifications in tumor-origin cells can guide personalized treatment strategies. PubMed: EGFR in lung cancer therapy PubMed: HER2 in lung cancer therapy
- Tumor Heterogeneity: The sample-specific CNV profiles, even among tumor cells of the same origin, underscore tumor heterogeneity. This has implications for therapeutic resistance, as different subclones within a tumor might harbor distinct genomic alterations. Single-cell CNV analysis, as performed here, is crucial for unraveling this heterogeneity.
5. UMAP Visualization of CNV Patterns across Cell Types, Ploidy, and Conditions in Lung Tissue
[Analysis Visualization Results]...
Analysis Overview
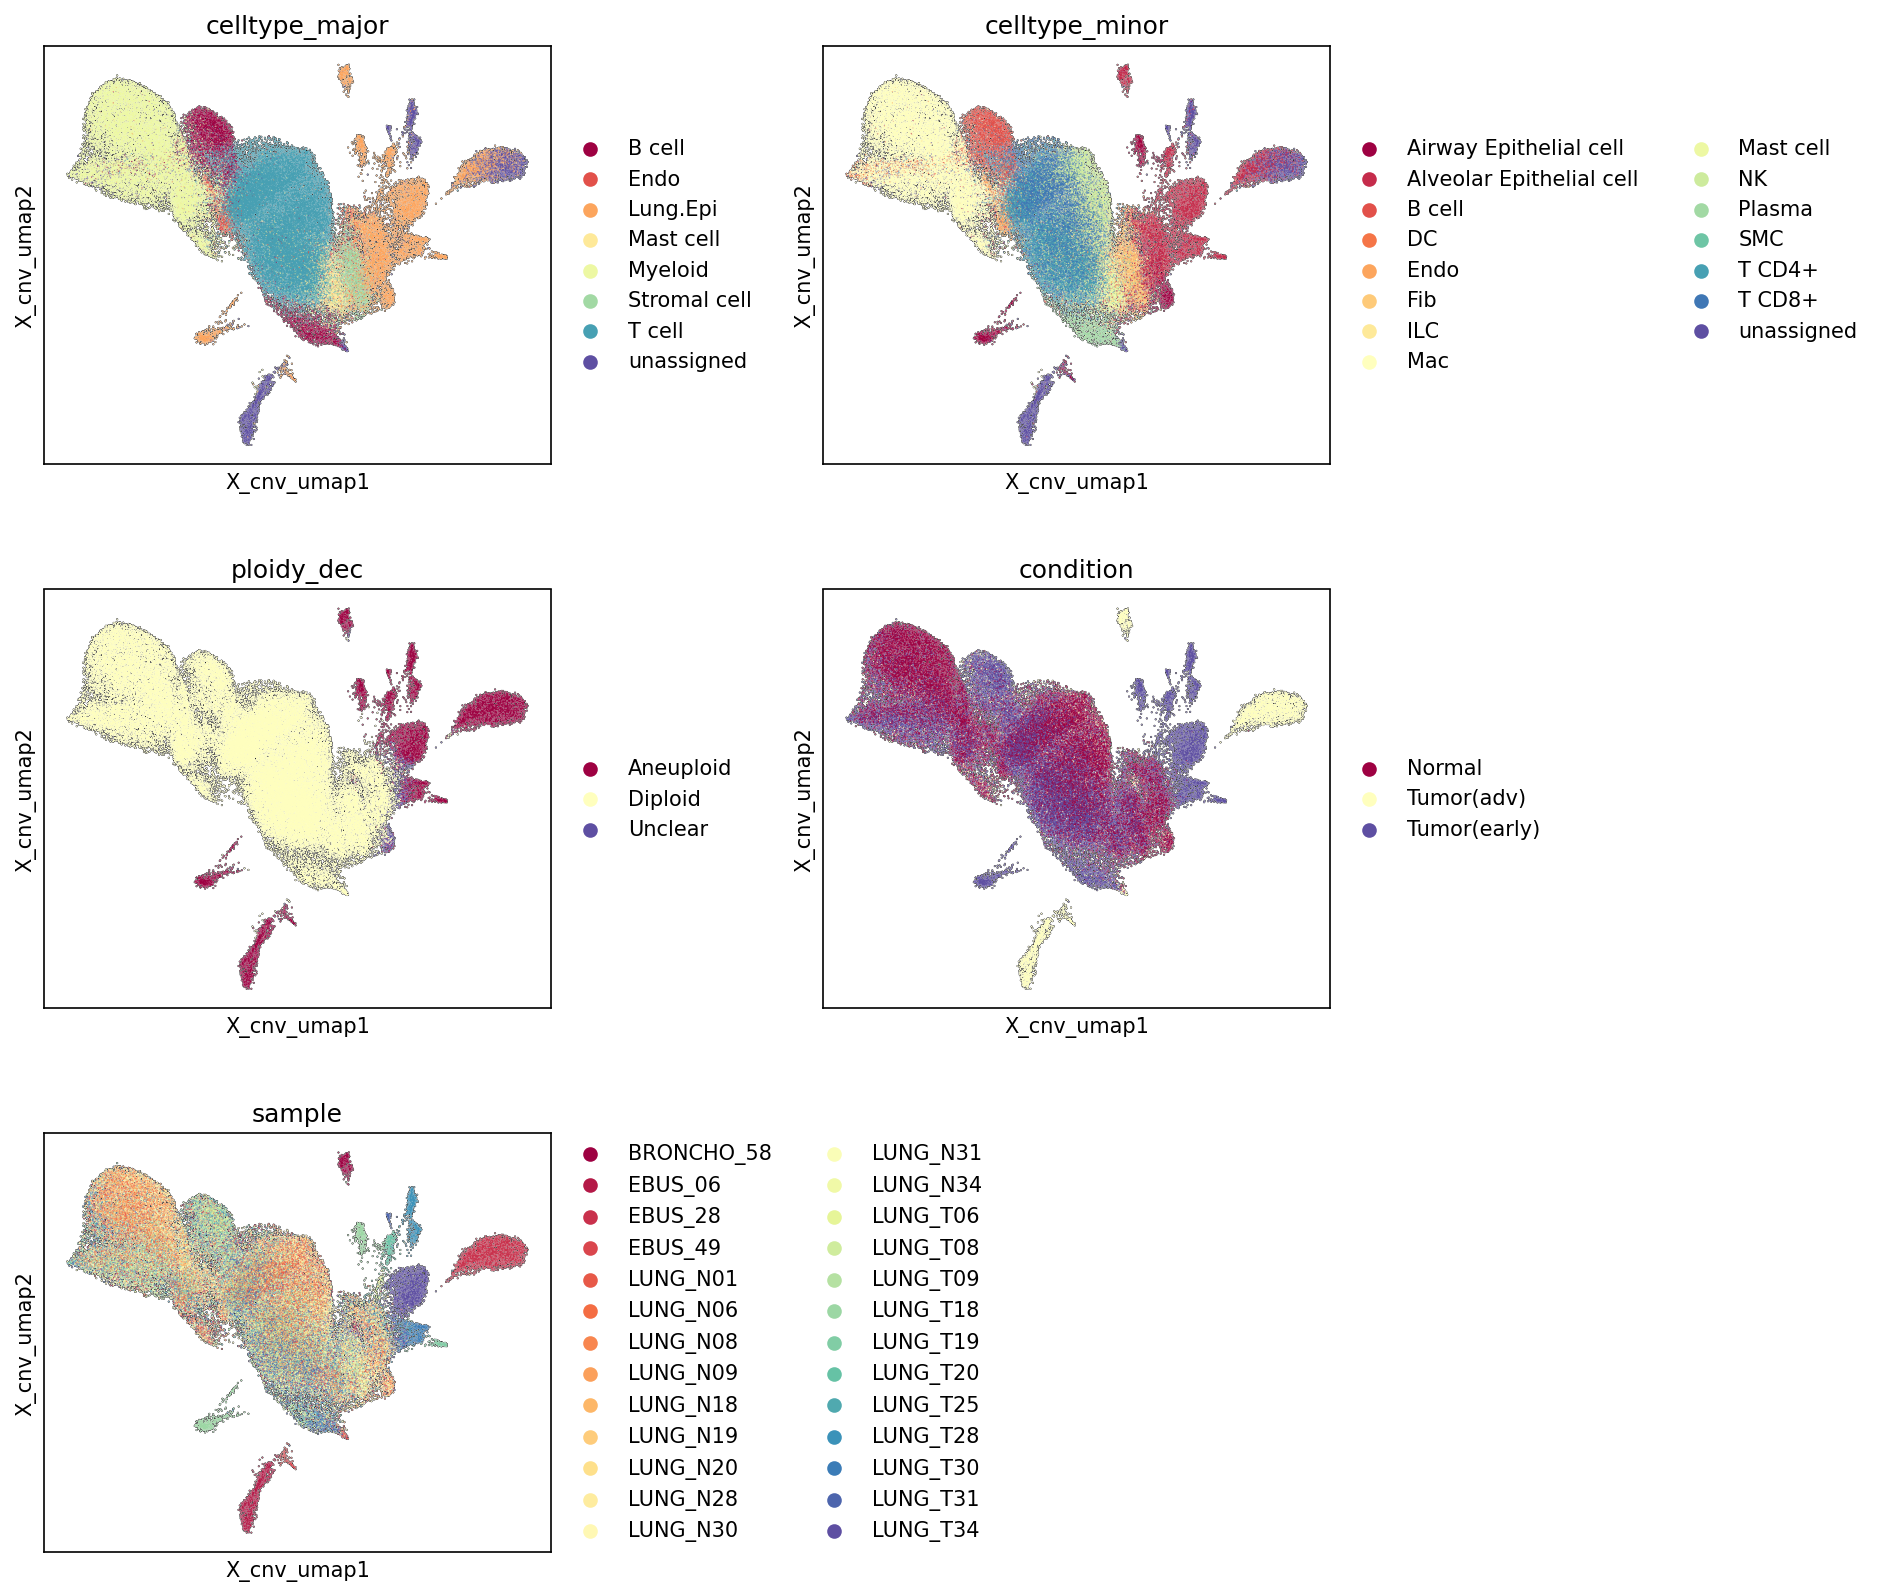
This analysis presents a series of UMAP (Uniform Manifold Approximation and Projection) plots derived from single-cell RNA-seq data, specifically leveraging estimated Copy Number Variation (CNV) patterns (obsm['X_cnv']) for embedding. These UMAPs visualize the cellular landscape based on CNV similarity, with cells colored by their major cell type, minor cell type, ploidy status, disease condition, and individual sample origin. The primary objective is to investigate how CNV patterns stratify different cell populations and to understand their distribution across various biological and clinical annotations within the lung tissue dataset.
Visual Summary
The UMAP visualizations reveal a clear separation of cells into distinct regions based on their underlying CNV profiles.
- Overall Embedding Structure: The UMAP shows a large, diffuse cluster on the left and several smaller, more defined clusters/projections extending to the right and bottom. This suggests at least two major groups of cells based on their CNV characteristics, with further substructures.
celltype_major:
- The large cluster on the left is predominantly composed of "T cell", "Myeloid cell", "B cell", "Stromal cell", and "Endothelial cell", indicating that these immune and stromal cell types share more similar CNV profiles, likely representing a relatively stable genome.
- A distinct cluster extending to the right and bottom is heavily enriched with "Lung Epithelial cell" (Lung.Epi), the identified tumor origin cell type. This suggests that Lung Epithelial cells, particularly those involved in the disease, exhibit distinct CNV landscapes compared to other major cell types.
- "Mast cell" also appears to form some distinct, smaller clusters.
celltype_minor:
- This plot refines the observations from celltype_major. The large, left-side cluster is broadly populated by various immune cell subtypes (T cell CD8+, T cell CD4+, Macrophage, B cell, Dendritic cell, NK cell, ILC, Plasma cell) and stromal cells (Fibroblast, Endothelial cell, Smooth muscle cell).
- The "Alveolar Epithelial cell" and "Airway Epithelial cell" types largely contribute to the distinct clusters on the right and bottom, further solidifying the observation that epithelial cells, particularly those from the lung, possess unique CNV patterns compared to non-epithelial cells.
ploidy_dec:
- This plot provides a strong correlation with the observed clustering. The large, left-side cluster is almost exclusively "Diploid" (light yellow), encompassing the majority of immune and stromal cells.
- In contrast, the distinct clusters on the right and bottom, previously identified as "Lung Epithelial cell" (Alveolar/Airway Epithelial cell), are overwhelmingly labeled as "Aneuploid" (dark red). This demonstrates a clear separation of cells based on ploidy, with aneuploid cells forming their own CNV-driven clusters.
- A small proportion of "Unclear" ploidy cells are scattered.
condition:
- "Normal" cells (dark red) are almost entirely localized within the large "Diploid" cluster on the left, consistent with healthy immune and stromal populations.
- "Tumor(adv)" (light yellow) and "Tumor(early)" (purple) cells are distributed across the entire UMAP. Critically, these tumor conditions are significantly enriched in the "Aneuploid" clusters on the right and bottom, aligning with the expected genomic instability of cancer cells.
- However, both tumor conditions also contribute cells to the large "Diploid" cluster on the left, which is expected as tumor samples contain a significant infiltrate of normal immune and stromal cells.
sample:
- While there is some mixing, certain samples show a tendency to cluster together, indicating both inter-sample variability in CNV patterns and potential batch effects or patient-specific tumor CNV signatures.
- Samples designated "LUNG_Nxx" (likely normal lung samples, though N31, N34 are present in the tumor-associated aneuploid regions, suggesting these might be adjacent normal or tumor-infiltrated normal samples) primarily populate the diploid region, while "LUNG_Txx" and "EBUS_xx" samples (tumor/early/advanced) show a broader distribution, extending into the aneuploid clusters.
- The sample coloring across the aneuploid clusters reveals a heterogeneous mix, suggesting that different tumors may harbor distinct CNV patterns that still broadly group as "aneuploid."
Biological Interpretation
The UMAPs based on CNV patterns provide a powerful visual segregation of cell populations, primarily distinguishing between likely malignant cells and the non-malignant tumor microenvironment or normal tissue.
- Clear Distinction of Malignant Cells: The most striking observation is the clear separation of "Aneuploid" cells into distinct clusters, predominantly composed of "Lung Epithelial cells" (Alveolar and Airway Epithelial cells). Given that Lung Epithelial cells are the tumor origin celltype in this dataset, this strongly suggests that these aneuploid epithelial cells represent the malignant cancer cell population. Malignant transformation is frequently accompanied by widespread chromosomal instability, leading to CNVs and altered ploidy, which is effectively captured by this CNV-based embedding. PubMed search: copy number variation cancer progression
- Genomic Stability of Tumor Microenvironment and Normal Cells: The vast majority of immune cells (T cells, Myeloid cells, B cells, etc.) and stromal cells (Fibroblasts, Endothelial cells) cluster tightly within the "Diploid" region. This indicates that these cells, whether from normal tissue or infiltrating the tumor, generally maintain a stable, diploid genome, as expected for non-cancerous cells. This observation provides confidence in the CNV estimation and ploidy assignment for segregating tumor cells from the host microenvironment.
- Disease Progression and CNV Profiles: Both "Tumor(early)" and "Tumor(adv)" conditions show enrichment in the aneuploid clusters. This implies that CNVs are present early in tumor development and persist or evolve as the disease progresses to an advanced stage. The overlapping nature of early and advanced tumor cells in the aneuploid space suggests that while CNV burden distinguishes tumor cells from normal, the specific patterns might be complex and heterogeneous across different stages or individual tumors.
- Sample Heterogeneity: The sample plot highlights inter-patient variability in CNV profiles within the aneuploid compartment. While all tumor samples contribute to the aneuploid clusters, the specific distribution patterns can vary, which might reflect distinct tumor subclones or varying degrees of genomic instability across patients. The presence of some "normal" samples (LUNG_N31, LUNG_N34) contributing to aneuploid regions could indicate early neoplastic changes, contamination, or samples taken from adjacent but affected tissue.
Annotation Notes
The strong concordance between celltype_major/celltype_minor annotations, ploidy_dec inference, and condition labels within the CNV-derived UMAP embedding provides robust validation for the quality of these annotations. The distinct clustering of aneuploid, epithelial cells from tumor conditions, separate from diploid immune and stromal cells from normal and tumor conditions, confirms the biological accuracy of the CNV estimates and their utility in distinguishing cell states. The 'Unclear' ploidy cells are a minor population and do not significantly interfere with the overall interpretation.
6. Minor Cell Type Population Analysis Across Lung Conditions
[Analysis Visualization Results]...
Analysis Overview
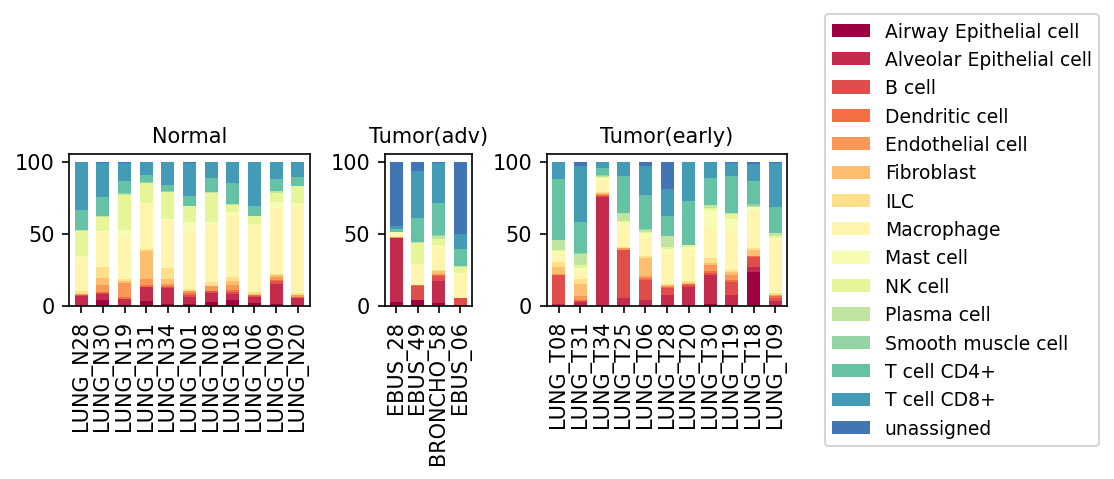
This analysis presents a population bar plot illustrating the relative proportions of minor cell types across individual samples from normal lung tissue, early-stage lung tumors (Tumor(early)), and advanced-stage lung tumors (Tumor(adv)). The purpose is to identify shifts in cellular composition associated with lung tumorigenesis and progression.
Visual Summary
The stacked bar plots display the percentage of each minor cell type within each sample, grouped by condition.
- Normal Lung Tissue (Normal): Samples from normal lung tissue exhibit a relatively consistent cellular composition. Macrophages (yellow) and T cells (CD4+ in medium teal, CD8+ in dark teal) constitute a significant portion of the cellular landscape. Alveolar Epithelial cells (red) and Airway Epithelial cells (maroon) are present in smaller, yet consistent, proportions. Other immune and stromal cell types are also observed in minor fractions.
- Early-Stage Lung Tumors (Tumor(early)): This group shows notable heterogeneity across samples. A prominent feature in several samples (e.g., LUNG_T34, LUNG_T25, LUNG_T06, LUNG_T18) is a substantial increase in the relative proportion of Alveolar Epithelial cells (red). Concurrently, the relative proportions of immune cells like T cells and Macrophages appear to vary widely between samples, with some samples showing higher immune infiltration and others dominated by epithelial cells.
- Advanced-Stage Lung Tumors (Tumor(adv)): Similar to early-stage tumors, these samples demonstrate a significant increase in Alveolar Epithelial cells (red) in several cases (e.g., EBUS_28, EBUS_58, BRONCHO_06), often dominating the cellular composition. Macrophages (yellow) remain a considerable component, while T cell populations (CD4+, CD8+) are present but their relative contribution may be lower in samples with high epithelial cell burden. Some samples in this group also show a noticeable proportion of "unassigned" cells (dark blue).
Biological Interpretation
The observed shifts in minor cell type populations provide critical insights into the lung tumor microenvironment (TME) dynamics.
- Tumor Cell Dominance: The most striking observation is the significant increase in Alveolar Epithelial cells in both early and advanced tumor conditions. Given that "Lung Epithelial cell" is identified as the "Tumor origin celltype" and lung adenocarcinoma frequently arises from alveolar type 2 (AT2) epithelial cells, this elevation strongly suggests that these cells represent the proliferating malignant cell population. This is a fundamental characteristic of solid tumors, where tumor cells expand clonally.
Immune Landscape Alterations
- Macrophages: Macrophages are consistently abundant across all conditions, including tumors. In the TME, macrophages often differentiate into tumor-associated macrophages (TAMs), which can promote tumor growth, angiogenesis, and immune suppression, particularly M2-polarized macrophages [1, 2].
- T Cells: While T cells (CD4+ and CD8+) are substantial components of normal lung tissue, their *relative* proportions in tumors vary considerably between samples. In some tumor samples, the dominance of epithelial cells might dilute the relative proportion of T cells. The presence of T cells in tumors indicates immune infiltration, which is a key determinant of anti-tumor immunity. However, their functionality (e.g., exhaustion) cannot be inferred from population plots alone [3].
- Heterogeneity of Immune Infiltration: The variability in immune cell proportions among tumor samples, especially in early-stage tumors, underscores the heterogeneity of immune responses in different patients. Some tumors appear more "immune-infiltrated" while others are more "epithelial-dominated," reflecting diverse immune microenvironments.
- Other Immune Cells: The presence of other immune cells like B cells, Plasma cells, Dendritic cells, and NK cells indicates a complex immune milieu, where various components interact to shape the overall immune response. Elevated Plasma cells in some tumor samples could point towards a humoral immune response within the TME.
- Tumor Heterogeneity and Progression: The pronounced sample-to-sample variability within both early and advanced tumor conditions highlights the significant inter-patient heterogeneity of lung cancer. While both early and advanced tumors show an increase in tumor epithelial cells, the specific immune context and other stromal components can differ, potentially influencing disease progression and treatment response.
- Unassigned Cell Population: The noticeable "unassigned" cell population in some advanced tumor samples warrants further investigation. This could represent novel or rare cell states, cells with ambiguous transcriptomic profiles, or technical artifacts.
Clinical or Translational Implications
- Biomarker Potential: The clear increase in the proportion of Alveolar Epithelial cells in tumor samples relative to normal tissue could serve as a diagnostic indicator of tumor presence, especially in biopsy samples where cellularity is being assessed.
- Immunotherapy Stratification: The observed heterogeneity in immune cell infiltration, particularly T cells and Macrophages, has significant implications for immunotherapy. Patients with higher proportions of T cells (potentially "hot" tumors) might be more responsive to immune checkpoint inhibitors, while those with lower infiltration (potentially "cold" tumors) might require combination therapies to modulate the TME and enhance anti-tumor immunity [3].
- Targeting the Tumor Microenvironment: Understanding the precise cellular composition of the TME, including the prevalence of tumor cells versus supportive stromal and immune cells, is crucial for developing targeted therapies. For instance, strategies aimed at re-educating TAMs or enhancing T cell function could be considered based on the specific cellular landscape.
---
References:
- Tumor-associated macrophages: Olingy CE, Dinh HQ, Clements VK, et al. The Oncotarget of M2 Macrophages: From Cancer to Novel Therapies. *Front Immunol*. 2019;10:1107. PubMed Search Link
- Role of macrophages in TME: Mantovani A, Marchesi F, Malesci A, et al. Tumor-associated macrophages as a double-edged sword in cancer progression. *Nat Rev Clin Oncol*. 2017;14(12):731-744. PubMed Search Link
- Immune cells in TME and immunotherapy: Galon J, Bruni D. Approaches to treat immune hot, altered and cold tumors with immunotherapy. *Nat Rev Drug Discov*. 2020;19(11):765-781. PubMed Search Link
7. T Cell Subtype Population Dynamics Across Lung Tissue Conditions
[Analysis Visualization Results]...
Analysis Overview
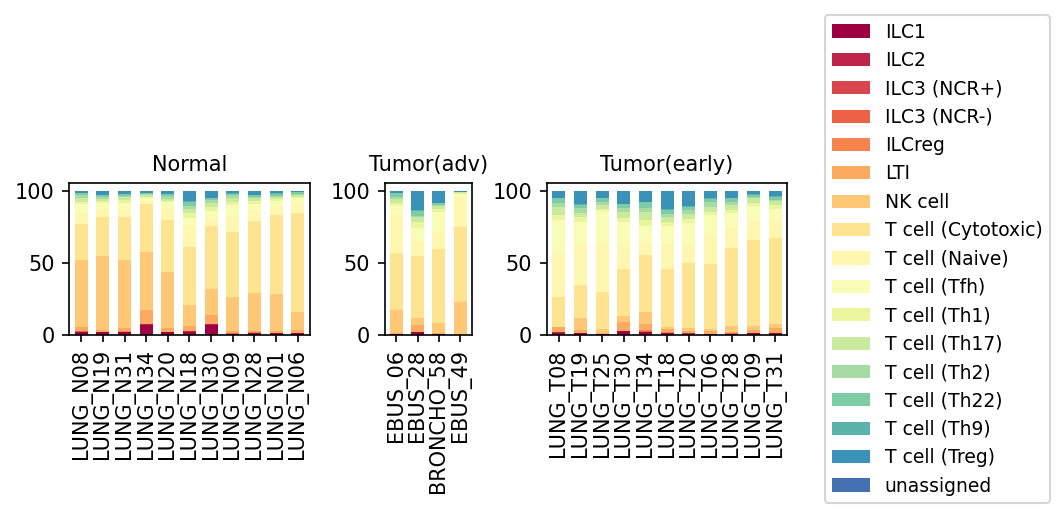
This analysis presents a population bar plot illustrating the proportional distribution of various T cell subsets, including NK cells and Innate Lymphoid Cells (ILCs), across individual samples from Normal, early-stage Tumor (Tumor(early)), and advanced-stage Tumor (Tumor(adv)) lung tissues. The plot focuses on the celltype_major 'T cell' and further subdivides it into celltype_subset populations. This visualization helps to identify shifts in the immune landscape during lung tumor progression.
Visual Summary
The stacked bar plot shows the relative abundance of T cell subsets per sample, grouped by condition (Normal, Tumor(adv), Tumor(early)).
- Normal Condition: In normal lung tissue, the T cell compartment is primarily composed of T cell (Naive), T cell (Cytotoxic), and NK cell populations. T cell (Treg) cells are also present at noticeable proportions. Various T helper (Th) subsets (Th1, Th2, Th9, Th17, Th22), Tfh cells, and different ILC types (ILC1, ILC2, ILC3 (NCR+), ILC3 (NCR-), ILCreg, LTI) contribute smaller but consistent fractions.
- Tumor(adv) Condition: Compared to normal tissue, there is a general decrease in the relative proportions of T cell (Naive) and T cell (Cytotoxic) cells in advanced tumor samples. NK cell proportions also appear reduced. Conversely, the relative proportion of T cell (Treg) cells seems to be maintained or slightly increased in some advanced tumor samples (e.g., EBUS_28), potentially contributing to immune suppression. A notable increase in the 'unassigned' category is observed in several advanced tumor samples (e.g., EBUS_28, EBUS_49).
- Tumor(early) Condition: Early-stage tumor samples show a similar trend to advanced tumors, with reduced proportions of T cell (Naive) and T cell (Cytotoxic) cells compared to normal tissue. NK cell populations also appear to be diminished. T cell (Treg) cells are consistently present, and in some early tumor samples, their relative proportion might be higher than in normal tissue. The 'unassigned' population is also present but shows variability across early tumor samples.
- Overall Trends: Both early and advanced tumor conditions exhibit a shift in the T cell subset composition away from the normal lung. There is a consistent reduction in effector anti-tumor populations (Cytotoxic T cells, NK cells) and a relative preservation or slight increase in immunosuppressive T cell (Treg) populations within the T cell compartment.
Biological Interpretation
The observed shifts in T cell subset populations provide critical insights into the immune microenvironment in lung cancer progression.
- Reduced Anti-Tumor Immunity: The decrease in T cell (Cytotoxic) and NK cell populations in both early and advanced tumor conditions suggests a compromised anti-tumor immune response. Cytotoxic T lymphocytes (CTLs) and NK cells are crucial mediators of tumor cell killing [PubMed search: cytotoxic T cells cancer immunity], and their reduced presence indicates potential immune evasion by cancer cells.
- Potential Immunosuppression: The maintained or slightly increased proportion of T cell (Treg) cells in tumor samples is consistent with their known role in suppressing anti-tumor immunity. Tregs inhibit the activity of effector T cells and NK cells, promoting immune tolerance and tumor growth [GeneCards: FOXP3, regulatory T cells cancer]. This suggests that the tumor microenvironment fosters an immunosuppressive state early in tumor development and maintains it as the disease progresses.
- Changes in Naive T Cell Pool: The reduction in T cell (Naive) populations in tumor conditions could indicate their differentiation into effector or memory cells, or their exclusion from the tumor microenvironment. A shift from naive to activated/differentiated states is expected during an immune response, but if effector cells are also low, it might suggest an impaired or misdirected immune activation.
- Role of ILCs and Th Subsets: While ILCs and various Th subsets are present, their proportions are generally smaller, and no dramatic shifts are immediately apparent at this resolution. However, subtle changes in these populations could still play important roles in shaping the overall immune response. For instance, Th1 cells are typically associated with anti-tumor immunity, while Th2 and Th17 can have more complex or even pro-tumorigenic roles depending on the context [PubMed search: Th1 Th2 Th17 cancer].
- Unassigned Population: The noticeable presence of an 'unassigned' population, particularly in advanced tumors, highlights a potential area for further investigation. These cells might represent novel or uncharacterized immune cell states, dysfunctional or exhausted T cells, or technical artifacts. Elucidating their identity could reveal important aspects of tumor immunology.
Clinical or Translational Implications
These findings have several potential clinical and translational implications for lung cancer:
- Immunosuppressive Tumor Microenvironment (TME): The observed immune cell shifts, characterized by decreased cytotoxic T cells and NK cells and potentially stable/increased Tregs, strongly suggest an immunosuppressive TME in both early and advanced lung tumors. This environment makes it challenging for the immune system to eradicate cancer cells.
- Implications for Immunotherapy: For immunotherapies like immune checkpoint blockade (e.g., anti-PD-1/PD-L1), the presence of functional cytotoxic T cells is crucial for efficacy [PubMed search: immune checkpoint blockade lung cancer mechanism]. A reduced proportion of these cells, alongside potentially elevated Tregs, might predict suboptimal responses in some patients or suggest a need for combination therapies to reverse immunosuppression.
- Biomarker Potential: The ratios of T cell subsets (e.g., Cytotoxic T cell/Treg ratio, NK cell/Treg ratio) could serve as prognostic biomarkers for disease progression or indicators of response to specific treatments. Monitoring these ratios in patient biopsies or liquid biopsies might provide valuable information for personalized treatment strategies.
- Therapeutic Targets: Strategies aimed at increasing cytotoxic T cell and NK cell infiltration and activity (e.g., adoptive cell transfer, oncolytic viruses, specific cytokines) or depleting/inhibiting Treg function could be explored as potential therapeutic interventions to overcome tumor-induced immunosuppression in lung cancer.
- Further Research on 'Unassigned' Cells: The 'unassigned' population warrants deeper characterization to understand its functional relevance and potential as a novel therapeutic target or biomarker in lung cancer.
8. T cell Subset Population Analysis Across Lung Conditions
[Analysis Visualization Results]...
Analysis Overview
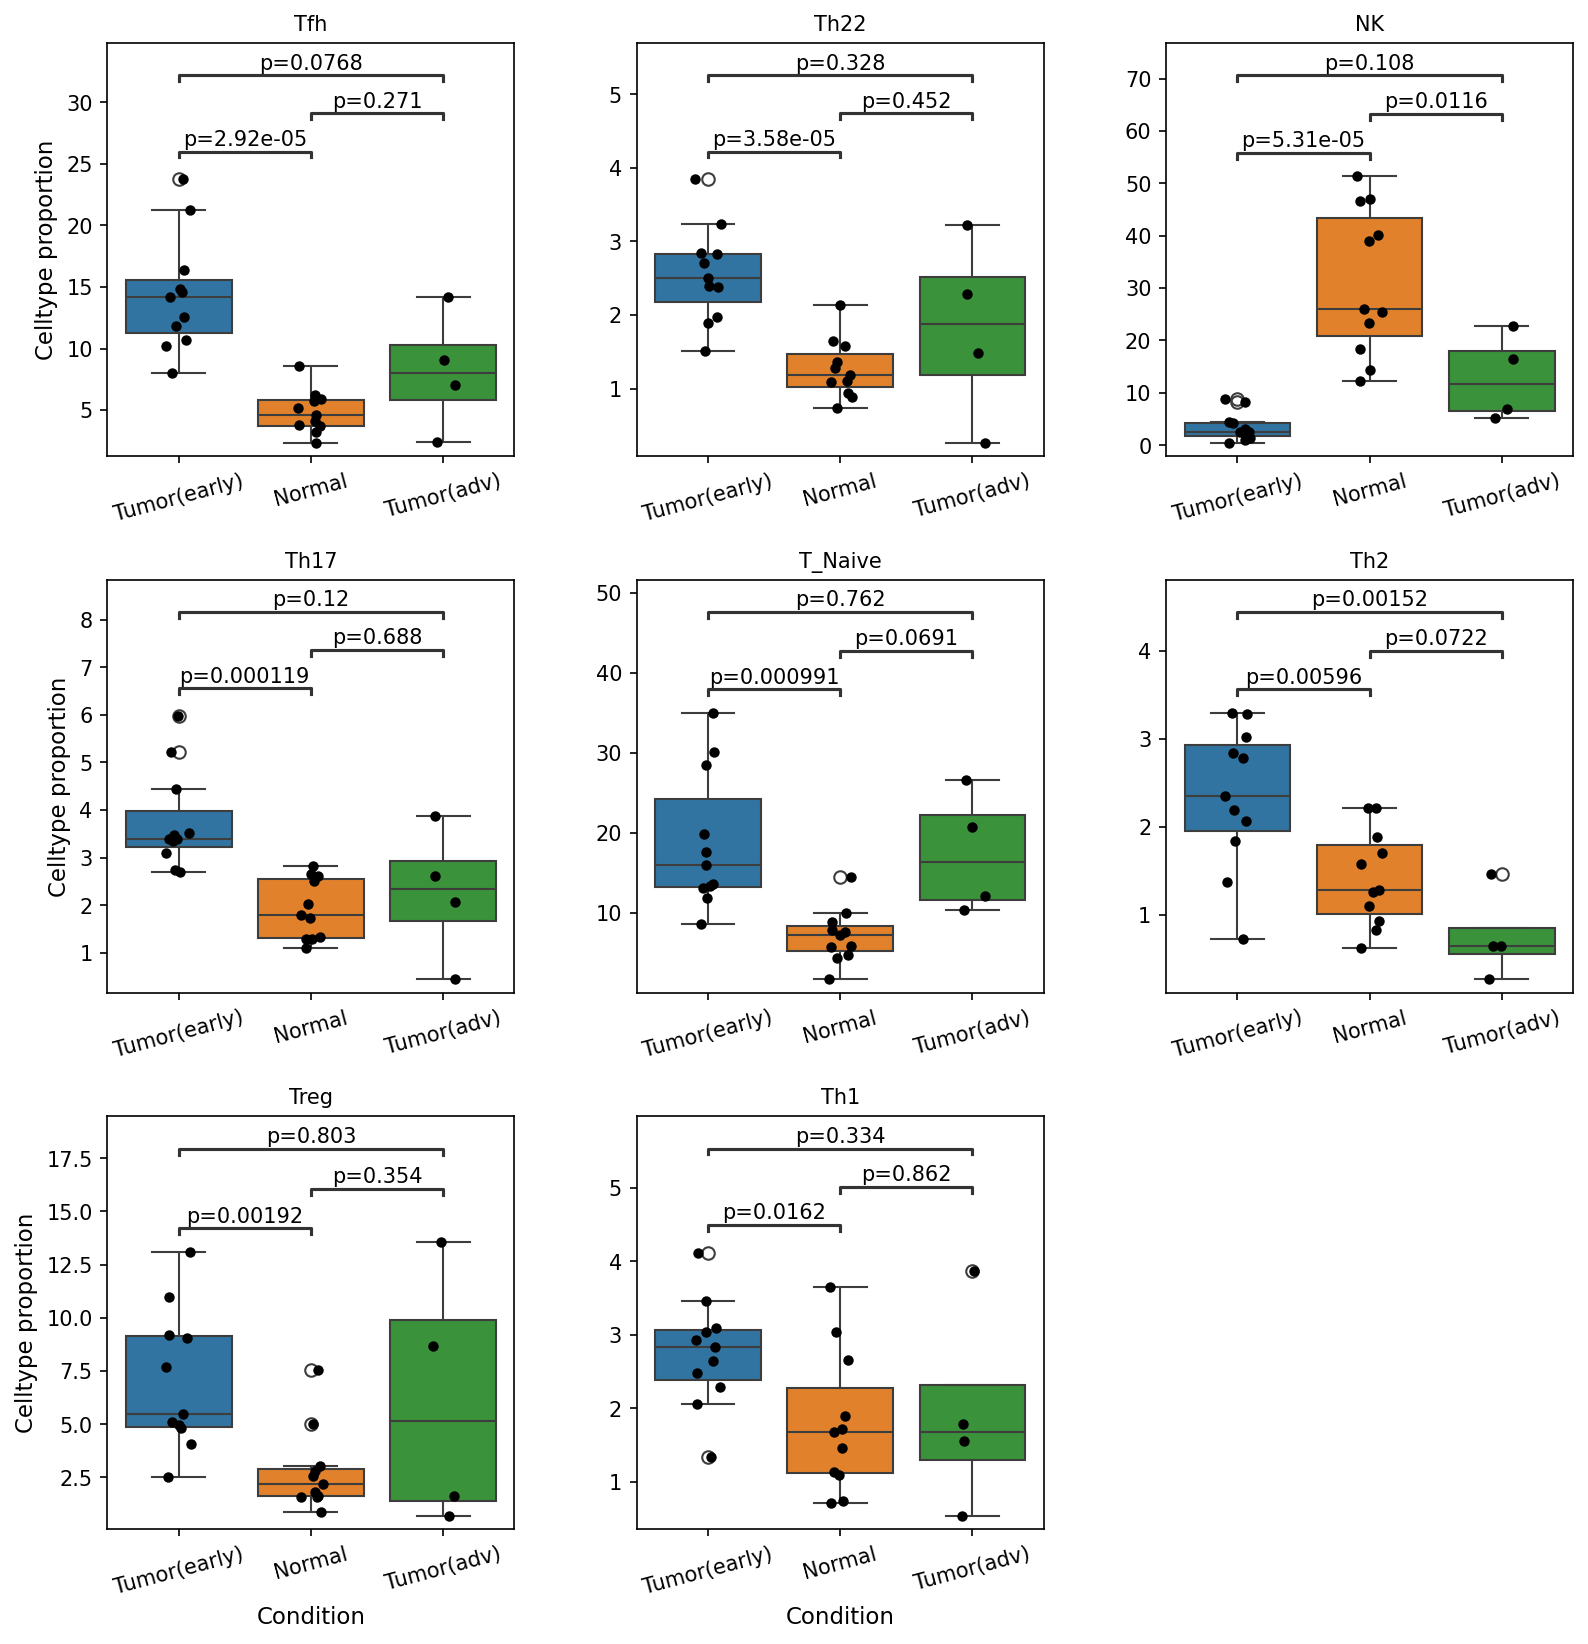
This analysis investigates the proportional changes of various T cell and NK cell subsets across different lung tissue conditions: early-stage tumor (Tumor(early)), normal tissue (Normal), and advanced-stage tumor (Tumor(adv)). The goal is to identify statistically significant shifts in the immune cell composition that may be associated with tumor initiation and progression in the lung, based on single-cell RNA sequencing data.
Visual Summary
The box plots display the proportion of eight distinct immune cell subsets within the total T cell population across the three conditions. Statistically significant differences (p < 0.1) are highlighted by p-values connecting specific group comparisons.
- Tfh (T follicular helper) cells: Significantly elevated in both early (p=2.92e-05) and advanced (p=0.0768) tumor stages compared to normal tissue.
- Th22 (T helper 22) cells: Show a significant increase in early tumor (p=3.58e-05) compared to normal, but not in advanced tumor.
- NK (Natural Killer) cells: Exhibit a pronounced and significant decrease in both early (p=5.31e-05) and advanced (p=0.0116) tumor stages compared to normal tissue. The proportion appears lowest in advanced tumors.
- Th17 (T helper 17) cells: Significantly higher in early tumor (p=0.000119) compared to normal tissue.
- T_Naive (Naive T) cells: Are significantly more abundant in both early (p=0.000991) and advanced (p=0.0691) tumor stages compared to normal tissue.
- Th2 (T helper 2) cells: Show a significant increase in early tumor (p=0.00596) compared to normal. However, their proportion significantly decreases from early to advanced tumor stages (p=0.00152), becoming significantly lower in advanced tumor compared to normal (p=0.0722).
- Treg (Regulatory T) cells: Significantly increased in early tumor (p=0.00192) compared to normal tissue.
- Th1 (T helper 1) cells: Are significantly elevated in early tumor (p=0.0162) compared to normal, but this difference is not significant for advanced tumor vs. normal.
Biological Interpretation
The observed shifts in immune cell proportions reveal dynamic changes in the lung tumor microenvironment (TME) as cancer develops and progresses.
- Early Tumor Immune Dysregulation: Several T helper subsets (Tfh, Th22, Th17, Th2) and immunosuppressive Treg cells are significantly elevated in early-stage tumors compared to normal lung tissue. This suggests an initial, perhaps dysregulated, immune response to the nascent tumor.
- Tfh cells contribute to humoral immunity and B cell responses [PubMed Search]. Their increase may indicate an active but potentially ineffective or misdirected humoral response.
- Th17 cells can play context-dependent roles in cancer, sometimes promoting inflammation and angiogenesis (pro-tumorigenic) [PubMed Search] and sometimes anti-tumor immunity. Their early elevation points to an altered inflammatory landscape.
- Th22 cells and Th2 cells are often associated with tissue repair, allergic responses, and can contribute to pro-tumorigenic environments in some cancers by promoting tumor growth or immune evasion. The initial increase in Th22 suggests a role in tissue remodeling or inflammation.
- The significant increase in Treg cells in early tumors is a common hallmark of cancer-induced immune evasion, as these cells suppress effector T cell responses, allowing tumor cells to escape immune surveillance [PubMed Search].
- The elevation of T_Naive cells could suggest an influx of newly recruited T cells into the early TME or a less differentiated T cell compartment, which may not be effectively activated against the tumor.
- The early elevation of Th1 cells, key mediators of anti-tumor immunity through IFN-$\gamma$ production, could represent an initial attempt by the immune system to control tumor growth. However, this response appears insufficient or suppressed, as Th1 proportions are not significantly different in advanced tumors compared to normal.
- Weakened Anti-Tumor Immunity:
- The most striking finding is the significant reduction in NK cells in both early and advanced tumor stages compared to normal. NK cells are crucial for innate anti-tumor immunity, directly killing cancer cells and producing cytokines [PubMed Search]. Their progressive decline, particularly in advanced tumors, strongly indicates a critical mechanism of immune evasion and a compromised anti-tumor immune response.
- Progression-Associated Shifts:
- As the tumor progresses from early to advanced stages, there is a significant decrease in Th2 cell proportion. This shift could indicate a change in the dominant immune suppressive pathways or a re-polarization of the immune response within the TME.
- While many T helper subsets are elevated in early tumors, some (e.g., Th22, Th17, Th1, Treg) do not show significantly sustained elevation in advanced tumors compared to normal. This might reflect complex, stage-dependent immune remodeling or exhaustion of specific T cell responses.
Clinical or Translational Implications
These findings have several potential clinical implications for lung cancer:
- Prognostic Biomarkers: The proportion of NK cells could serve as a prognostic biomarker, with lower levels indicating a more aggressive tumor phenotype and poorer patient outcomes.
- Therapeutic Targets: Strategies to restore or enhance NK cell activity in the lung TME could be beneficial for improving anti-tumor immunity, especially given their significant reduction across tumor stages.
- Immune Modulatory Therapies: The observed shifts in T helper and regulatory T cell populations suggest opportunities for immunomodulation. For instance, therapies targeting Treg cells to alleviate immunosuppression or re-balancing Th1/Th2/Th17 responses could be explored, particularly in early-stage disease to prevent progression.
- Stratification for Immunotherapy: Understanding the differential immune cell landscape between early and advanced tumors might help in stratifying patients for specific immunotherapeutic approaches, tailoring treatments to the dominant immune evasion mechanisms at different disease stages.
9. Macrophage Subset Population Analysis Across Lung Cancer Conditions
[Analysis Visualization Results]...
Analysis Overview
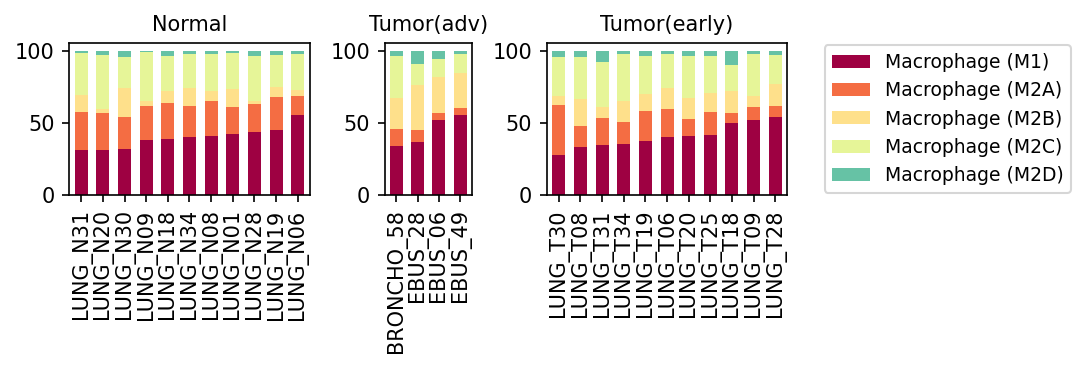
This analysis presents a population bar plot showing the proportional distribution of different macrophage subsets (M1, M2A, M2B, M2C, M2D) within the total macrophage compartment across individual samples from Normal, early-stage Tumor (Tumor(early)), and advanced-stage Tumor (Tumor(adv)) lung tissues. The aim is to identify shifts in macrophage polarization that may be associated with tumor development and progression.
Visual Summary
The visualization displays stacked bar plots for each sample, grouped by condition: Normal, Tumor(adv), and Tumor(early). Each bar represents 100% of macrophages in a given sample, with different colors indicating the proportions of M1, M2A, M2B, M2C, and M2D subsets.
- Normal Samples: In normal lung tissue samples, M1 macrophages (dark red) constitute a substantial proportion, typically ranging from ~30% to over 40% of the total macrophages. M2A macrophages (orange) are also well-represented, often comprising 20-30%. M2B (light orange/yellow) is present in smaller but noticeable proportions (~10-20%), while M2C (light green) and M2D (teal) subsets are consistently minor, usually below 5% each. The overall profile suggests a balanced or M1-leaning macrophage phenotype in healthy lung tissue.
- Tumor (advanced) Samples: In advanced tumor samples, a clear shift in macrophage composition is observable. While M1 macrophages are still present, their proportion appears generally reduced in several samples compared to normal tissue. Concurrently, there is a noticeable increase in the relative proportions of M2A and M2B macrophages. M2B, in particular, seems to occupy a larger proportion of the total macrophage population in many advanced tumor samples (e.g., reaching ~30-40% in EBUS_28). M2C and M2D subsets remain minor but show consistent presence across samples.
- Tumor (early) Samples: Early-stage tumor samples show a macrophage subset distribution that is somewhat intermediate or similar to advanced tumors in certain aspects. M1 macrophages are still a significant component (often 30-40%), but similar to advanced tumors, there is a prominent presence of M2A and M2B subsets. M2B proportions appear generally elevated compared to normal tissues, indicating an early shift towards M2 polarization even in the nascent stages of tumor development. M2C and M2D proportions are consistently low across all tumor samples.
Biological Interpretation
Macrophages are highly plastic immune cells that can polarize into various functional states, broadly categorized as M1 (pro-inflammatory, anti-tumorigenic) and M2 (anti-inflammatory, pro-tumorigenic) phenotypes. The observed shifts in macrophage subsets provide critical insights into the tumor microenvironment (TME) dynamics in lung cancer.
- Shift from M1 to M2 Dominance in Tumors: The most prominent finding is the general shift from a relatively M1-dominant profile in normal lung tissue towards an increased prevalence of M2-like macrophages (specifically M2A and M2B) in both early and advanced tumor conditions. This observation is consistent with the well-established role of M2 macrophages, often referred to as Tumor-Associated Macrophages (TAMs), in promoting tumor growth, angiogenesis, metastasis, and immune evasion PMID: 29202562.
- Role of M1 Macrophages: M1 macrophages are characterized by their ability to kill tumor cells and present antigens, driven by cytokines like IFN-γ and TNF-α. Their relative reduction in tumor samples suggests a compromised anti-tumor immune response within the TME.
- Increased M2A and M2B Macrophages:
- M2A macrophages are typically associated with Th2 responses, tissue repair, and allergic reactions. Their elevated presence in the TME could contribute to extracellular matrix remodeling and immune suppression, facilitating tumor progression PMID: 32371990.
- M2B macrophages are activated by immune complexes and TLR agonists and can produce both pro- and anti-inflammatory cytokines. While less distinctly defined than other M2 subtypes in the tumor context, their increase suggests a complex immunomodulatory role within the TME, potentially contributing to immune evasion or chronic inflammation that favors tumor growth.
- Implications for Tumor Progression: The consistent increase in M2A and M2B macrophages in both early and advanced tumor stages underscores their early involvement in shaping a pro-tumorigenic microenvironment. This suggests that the tumor actively educates and polarizes macrophages to support its growth, even from early stages. The relatively stable low proportions of M2C and M2D, while important in other contexts, suggest M2A and M2B might be the primary M2-like contributors in this specific lung cancer dataset.
Clinical or Translational Implications
The observed macrophage polarization patterns have significant clinical and translational implications for lung cancer treatment.
- Therapeutic Targeting of Macrophage Polarization: The predominance of M2-like macrophages in lung tumors suggests that therapeutic strategies aimed at repolarizing TAMs from an M2 (pro-tumor) to an M1 (anti-tumor) phenotype could be beneficial. This could involve using specific small molecules, antibodies, or immunomodulatory agents PubMed Search: "macrophage repolarization cancer therapy".
- Biomarker Potential: The relative proportions of M1 versus M2 macrophage subsets could serve as prognostic biomarkers, predicting disease aggressiveness or response to therapy. Patients with a higher M2/M1 ratio might have a poorer prognosis or be less responsive to certain immunotherapies.
- Combination Therapies: Understanding the precise macrophage subset landscape could guide the development of combination therapies. For instance, combining agents that inhibit M2 polarization or function with existing immunotherapotherapies (e.g., checkpoint inhibitors) might enhance anti-tumor immunity and improve patient outcomes PMID: 32371990. Targeting specific M2 subtypes (e.g., M2A or M2B) could lead to more precise interventions.
10. Macrophage Subset Population Shifts Across Lung Cancer Progression
[Analysis Visualization Results]...
Analysis Overview
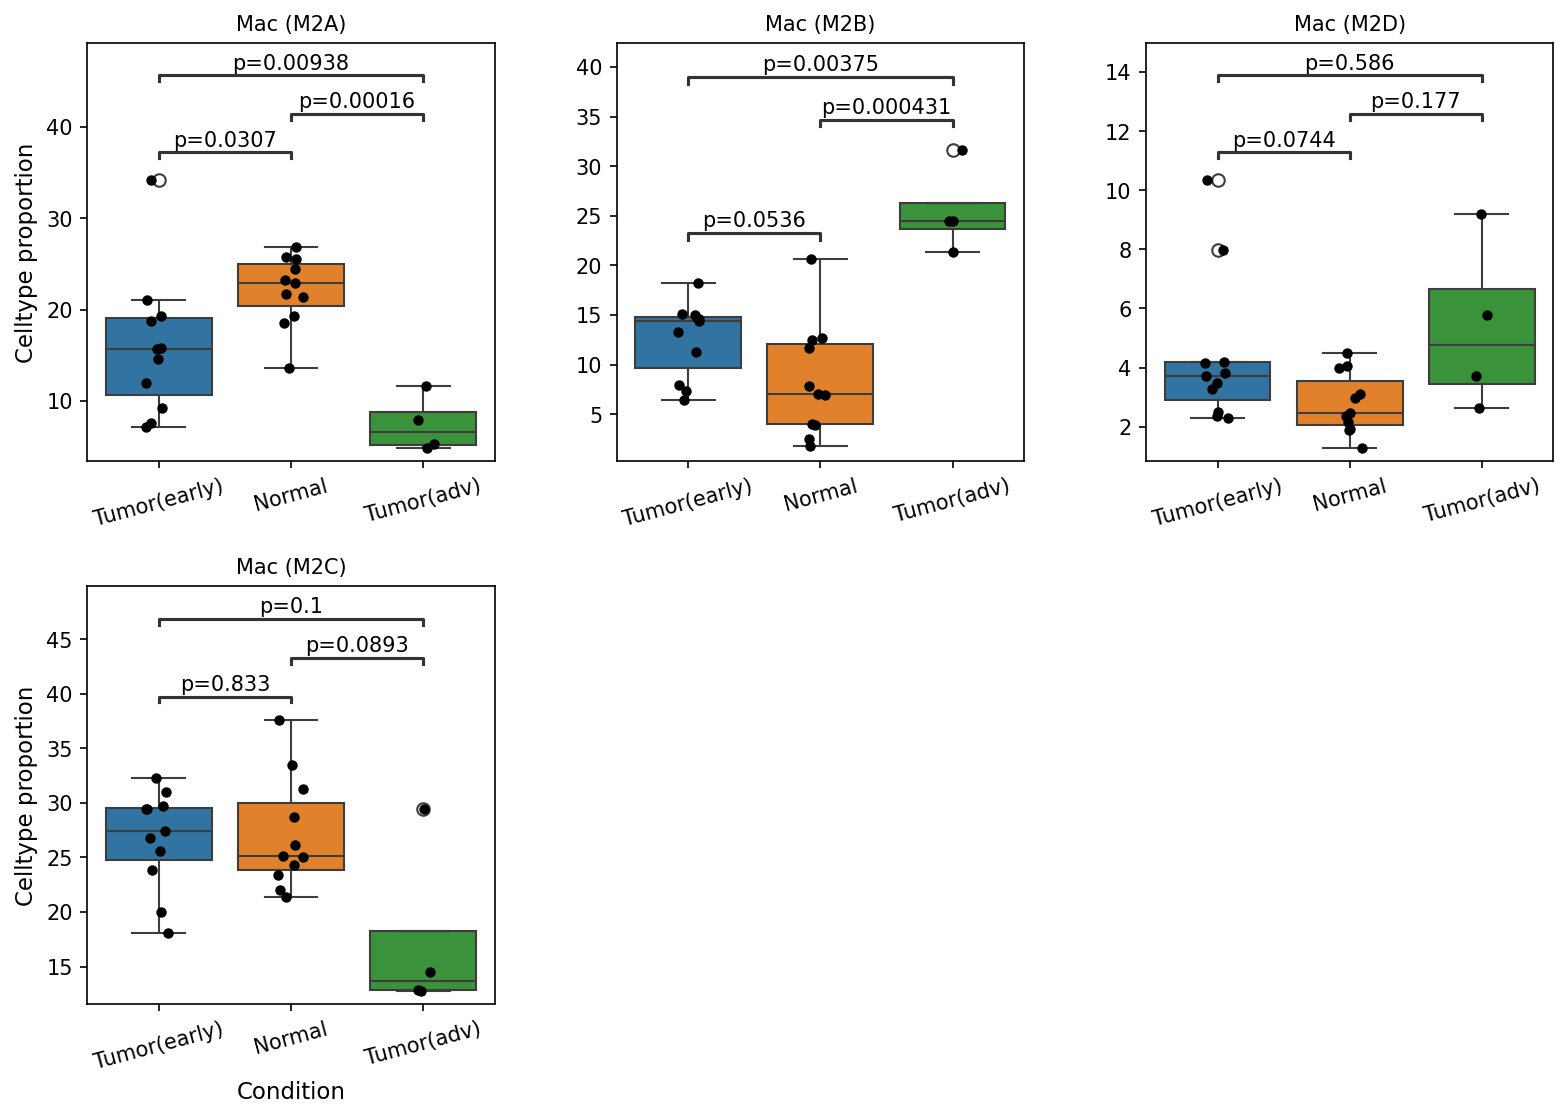
This analysis investigates the proportions of various macrophage subsets (Mac M2A, M2B, M2C, M2D) across different lung tissue conditions: early-stage tumor (Tumor(early)), normal tissue (Normal), and advanced-stage tumor (Tumor(adv)). The box plots highlight statistically significant differences in the proportions of these macrophage populations, providing insights into their dynamic roles during lung cancer progression.
Visual Summary
The box plots reveal distinct patterns of macrophage subset proportions across the three conditions:
Mac (M2A):
- The proportion of Mac (M2A) cells is highest in Normal lung tissue.
- There is a statistically significant decrease from Normal to Tumor(early) (p=0.00938) and a further significant decrease from Tumor(early) to Tumor(adv) (p=0.00016).
- Comparing Normal and Tumor(adv) directly shows a highly significant decrease (p=0.0307).
- This indicates a progressive reduction of Mac (M2A) macrophages with tumor progression.
Mac (M2B):
- The proportion of Mac (M2B) cells is lowest in Normal lung tissue.
- There is a statistically significant increase from Normal to Tumor(early) (p=0.0536).
- A highly significant increase is observed from Tumor(early) to Tumor(adv) (p=0.000431).
- Comparing Normal and Tumor(adv) directly shows a highly significant increase (p=0.00375).
- This suggests a consistent and significant enrichment of Mac (M2B) macrophages as lung cancer progresses.
Mac (M2D):
- The proportions of Mac (M2D) cells show no statistically significant differences across the conditions at the p < 0.1 cutoff, with p-values of 0.0744 (Tumor(early) vs Normal), 0.586 (Tumor(early) vs Tumor(adv)), and 0.177 (Normal vs Tumor(adv)). The trend appears to be slightly higher in Tumor(adv) but without strong statistical support.
Mac (M2C):
- The proportions of Mac (M2C) cells are similar between Tumor(early) and Normal conditions (p=0.833).
- However, there is a tendency for lower proportions in Tumor(adv) compared to Tumor(early) (p=0.1) and Normal (p=0.0893), suggesting a potential reduction in this subset in advanced disease. These p-values are at the boundary of the 0.1 significance cutoff.
Biological Interpretation
Macrophages are critical components of the tumor microenvironment (TME) and are broadly categorized into M1 (anti-tumorigenic) and M2 (pro-tumorigenic) phenotypes. The subsets analyzed here (M2A, M2B, M2C, M2D) represent distinct M2-like polarization states, each with specific functions in inflammation, immune regulation, and tissue remodeling.
- Shift towards Pro-Tumorigenic M2B Macrophages: The most striking finding is the significant and progressive increase of Mac (M2B) populations from normal tissue through early-stage to advanced-stage lung tumors. Mac (M2B) macrophages are known to be induced by immune complexes and Toll-like receptor (TLR) agonists. They typically contribute to pro-inflammatory responses, angiogenesis, and immune suppression within the TME, thereby promoting tumor growth and metastasis [1]. Their enrichment in advanced tumors strongly implicates them in driving disease progression.
- Decreased M2A and M2C Macrophages in Advanced Disease: Conversely, Mac (M2A) proportions show a significant decrease with tumor progression, becoming lowest in advanced tumors. M2A macrophages are generally associated with wound healing and tissue repair, often considered a "classically activated" M2 subtype involved in resolving inflammation. Their reduction might suggest a shift away from these reparative functions, potentially favoring more overtly pro-tumorigenic M2 subsets. Mac (M2C) macrophages, typically induced by IL-10 or TGF-β, are known for their strong immune suppressive properties and roles in tissue remodeling. Their observed reduction, especially in advanced tumors, could signify a shift in the immune suppressive landscape or a preferential dominance of other M2 types in later stages of cancer [2].
- Dynamic Reprogramming of Macrophages in Lung Cancer: The overall pattern suggests a dynamic reprogramming of macrophage populations in the lung TME. As lung cancer progresses from early to advanced stages, there is a clear shift from relatively higher proportions of M2A (and possibly M2C) towards a dominant presence of M2B macrophages. This re-polarization of macrophages profoundly influences the TME, creating an environment conducive to tumor growth, immune evasion, and metastasis.
Clinical or Translational Implications
The observed shifts in macrophage subset proportions hold significant clinical implications for lung cancer:
- Biomarkers for Disease Progression and Prognosis: The increasing proportion of Mac (M2B) and decreasing proportions of Mac (M2A) and Mac (M2C) could serve as novel biomarkers to assess lung cancer progression, predict disease stage, or even forecast patient prognosis. High Mac (M2B) levels might correlate with more aggressive disease and poorer outcomes.
- Therapeutic Targets: Targeting specific macrophage subsets offers a promising avenue for therapeutic intervention. Strategies aimed at inhibiting the recruitment or function of Mac (M2B) macrophages, or re-polarizing them towards anti-tumorigenic M1-like phenotypes or even M2A/M2C phenotypes that are less conducive to tumor growth, could be effective in halting or slowing lung cancer progression [3].
- Immunotherapy Enhancement: Understanding these macrophage dynamics is crucial for optimizing immunotherapy strategies. For instance, combination therapies that deplete or re-educate pro-tumorigenic macrophages (like M2B) alongside immune checkpoint blockade could potentially overcome resistance and enhance therapeutic responses in lung cancer patients.
---
References:
- M2B Macrophages and Tumor Microenvironment:
- M2C Macrophages in Cancer:
- Macrophage Polarization Therapy in Cancer:
11. Ploidy Status of Lung Epithelial Cells Across Normal, Early, and Advanced Lung Cancer Conditions
[Analysis Visualization Results]...
Analysis Overview
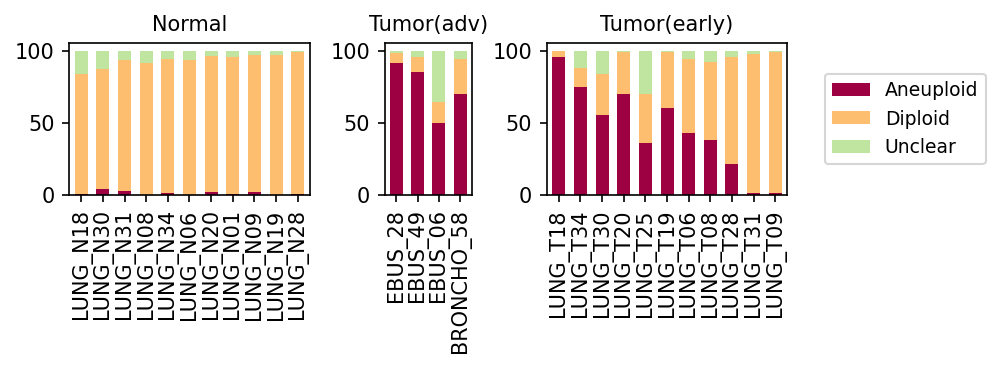
This analysis investigates the ploidy status (Aneuploid, Diploid, Unclear) of Lung Epithelial cells, identified as the tumor-origin cell type, across different conditions: Normal, Tumor(early), and Tumor(adv). The results are presented as stacked bar plots, showing the percentage of each ploidy category for individual samples within each condition.
Visual Summary
The bar plots display the distribution of ploidy populations within Lung Epithelial cells for each sample, grouped by condition.
- Normal Condition: In all normal lung samples (e.g., LUNG_N18, LUNG_N30, etc.), Lung Epithelial cells are predominantly Diploid (orange), indicating a normal chromosomal content. The proportion of Aneuploid (burgundy) cells is very low, often negligible, across all normal samples. "Unclear" proportions (light green) are also minimal.
- Tumor(adv) Condition: Samples from advanced tumors (EBUB_28, EBUB_49, EBUB_06, BRONCHO_58) show a dramatic shift. The majority of Lung Epithelial cells are Aneuploid (burgundy), often exceeding 70-80% in samples like EBUB_28, EBUB_49, and BRONCHO_58. While EBUB_06 has a lower proportion of Aneuploid cells (around 50%), Aneuploidy is still a dominant feature compared to normal tissue.
- Tumor(early) Condition: The early tumor samples present a more heterogeneous picture.
- Some early tumor samples (e.g., LUNG_T18, LUNG_T34, LUNG_T30, LUNG_T20, LUNG_T19) exhibit a high proportion of Aneuploid cells, comparable to advanced tumors.
- Other early tumor samples (e.g., LUNG_T25, LUNG_T06, LUNG_T08, LUNG_T28, LUNG_T31, LUNG_T09) show varying, but generally lower, levels of Aneuploidy, with Diploid cells still forming a substantial portion or even a majority.
- The "Unclear" category remains relatively small across all conditions and samples.
Biological Interpretation
The observed ploidy patterns in Lung Epithelial cells provide strong biological insights into lung cancer progression:
- Aneuploidy as a Hallmark of Cancer: The stark contrast between normal and tumor samples underscores aneuploidy as a fundamental characteristic and driver of cancer. Normal Lung Epithelial cells maintain diploidy, reflecting genomic stability. In contrast, tumor-derived Lung Epithelial cells, particularly in advanced stages, exhibit high levels of aneuploidy, a hallmark of genomic instability and chromosomal aberrations common in malignancies [1].
- Progression of Genomic Instability: The trend from nearly pure diploidy in normal tissue to increasing and often dominant aneuploidy in early and advanced tumors suggests a progressive accumulation of chromosomal abnormalities during lung cancer development. This accumulation can drive tumor evolution by conferring selective advantages to cancer cells.
- Heterogeneity in Early Tumors: The variability in aneuploidy levels among early tumor samples suggests that early-stage lung cancers may encompass a spectrum of genomic instability. Some early tumors may have already acquired significant aneuploidy, indicating more aggressive features, while others may be in an earlier phase of genomic disruption. This heterogeneity could reflect different molecular subtypes, diverse evolutionary paths, or varying proportions of truly malignant cells within the "Lung Epithelial cell" annotation across early tumor samples.
- Tumor-Origin Cell Type: By specifically analyzing Lung Epithelial cells, which are the presumed cells of origin for lung cancer, these findings directly reflect the genomic changes occurring within the malignant cell population, distinguishing them from surrounding stromal or immune cells.
Clinical or Translational Implications
- Prognostic Value: The degree of aneuploidy in Lung Epithelial cells could potentially serve as a prognostic biomarker. Samples with a higher proportion of aneuploid cells, even in early stages, might indicate a more aggressive disease course or a higher risk of recurrence [2].
- Stratification and Treatment Decisions: Identifying the ploidy status could aid in patient stratification. Patients with highly aneuploid tumors might benefit from therapies specifically targeting vulnerabilities associated with chromosomal instability.
- Monitoring Tumor Evolution: Longitudinal assessment of ploidy in tumor-origin cells could offer insights into tumor evolution and treatment response, potentially revealing the emergence of resistant aneuploid clones during therapy [3].
---
References:
[1] PubMed search for "hallmarks of cancer aneuploidy": https://pubmed.ncbi.nlm.nih.gov/?term=hallmarks+of+cancer+aneuploidy
[2] PubMed search for "lung cancer aneuploidy prognosis": https://pubmed.ncbi.nlm.nih.gov/?term=lung+cancer+aneuploidy+prognosis
[3] PubMed search for "aneuploidy cancer therapy": https://pubmed.ncbi.nlm.nih.gov/?term=aneuploidy+cancer+therapy
12. Cell-Cell Interaction Patterns in Lung Cancer Microenvironment
[Analysis Visualization Results]...
Analysis Overview
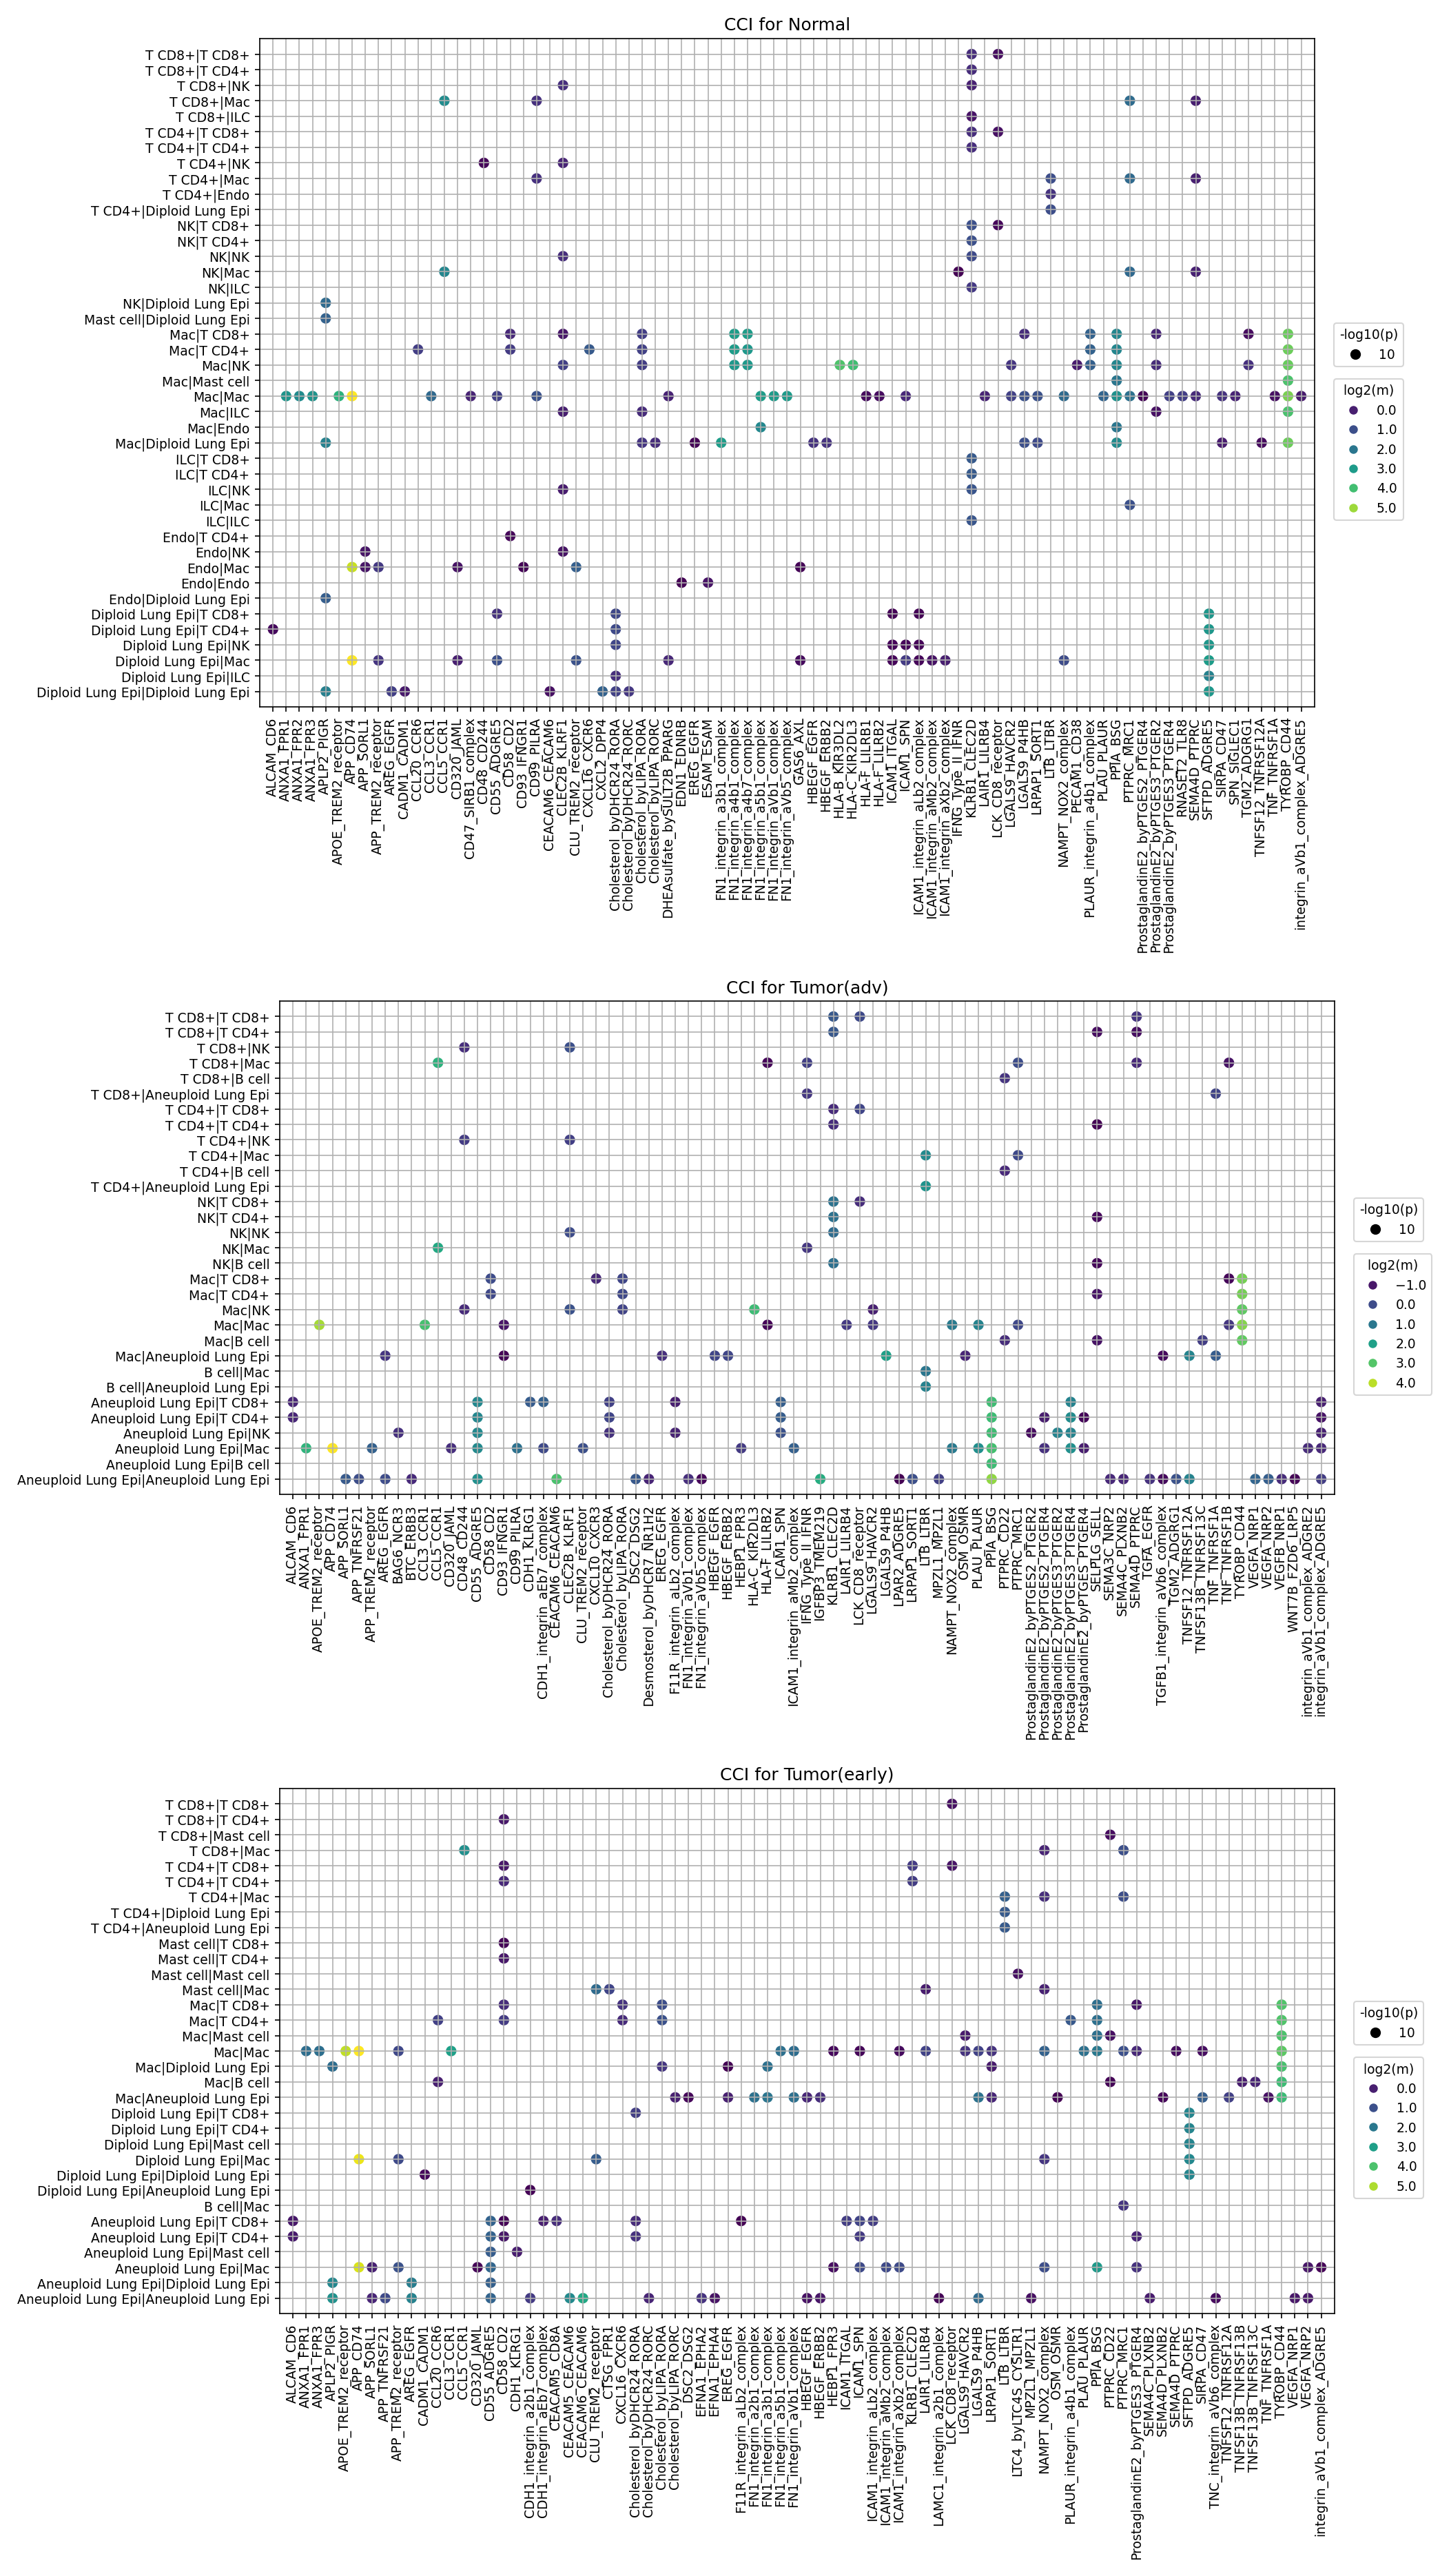
This analysis investigates cell-cell interaction (CCI) patterns involving various cell types, including Lung Epithelial cells, Fibroblasts, Macrophages, T cells, B cells, Dendritic cells, Endothelial cells, ILCs, Mast cells, NK cells, Plasma cells, and Smooth muscle cells, across Normal, Tumor (early), and Tumor (advanced) lung tissue conditions. The goal is to identify prominent ligand-receptor interactions that distinguish the tumor microenvironment from normal tissue and to prioritize potential therapeutic targets. The analysis specifically highlights interactions involving both Diploid and Aneuploid Lung Epithelial cells, with aneuploidy serving as a key marker for cancerous cells within the tumor context.
Visual Summary
The dot plots display the most significant (p-value < 0.05, mean expression > 0.01) cell-cell interaction pairs. The x-axis represents specific ligand-receptor pairs, and the y-axis represents interacting cell type pairs. The color intensity of each dot corresponds to the log2(mean) expression of the interaction, with brighter colors (yellow/green) indicating higher interaction strength. The size of the outer circle around each dot indicates the significance of the interaction (-log10(p)), with larger circles representing more significant interactions.
Key Visual Observations:
- Condition-Specific Patterns: A clear shift in interaction patterns is observed between the Normal condition and the Tumor (early/advanced) conditions. The tumor conditions exhibit a higher density of significant interactions, especially those involving Aneuploid Lung Epithelial cells.
- Aneuploid Lung Epithelial Cell Involvement: Aneuploid Lung Epithelial cells, presumed to be malignant, show extensive interactions with various immune cells (Macrophages, T cells, NK cells) and stromal cells (Fibroblasts, Endothelial cells) in both early and advanced tumor settings. These interactions are largely absent in the Normal condition, which predominantly features Diploid Lung Epithelial cells.
- Dominant Interaction Hubs: Macrophages, T cells, and Aneuploid Lung Epithelial cells appear as central players in the tumor microenvironment, engaging in a multitude of interactions.
- Prominent Ligand-Receptor Systems: Several ligand-receptor pairs are consistently highlighted across tumor conditions with high mean expression and significance, including APOE-TREM2, CD47-SIRB1B.complex, CXCL12-CXCR4, SPP1-integrin complexes (e.g., SPP1_integrin_av_b1.complex), TGFB1-TGFBR1_TGFBR2, and VEGFA-VEGFR systems.
- Similarities between Tumor Stages: The overall landscape of significant cell-cell interactions appears qualitatively similar between the early and advanced tumor stages, suggesting that many pro-tumorigenic communication networks are established early in tumor development.
Biological Interpretation
The observed cell-cell interaction patterns provide critical insights into the biological mechanisms driving lung tumor progression and immune evasion.
- Aneuploid Lung Epithelial Cell Centrality: The extensive interactions of Aneuploid Lung Epithelial cells with their microenvironment underscore their active role in recruiting and reprogramming stromal and immune cells. This is a hallmark of cancer, where tumor cells do not act in isolation but actively shape their surroundings to promote growth, survival, and metastasis.
- Immune Evasion and Suppression:
- CD47-SIRB1B.complex: This "don't eat me" signal is highly active between Aneuploid Lung Epithelial cells and phagocytes (Macrophages, T cells, NK cells). CD47 expression on cancer cells allows them to evade phagocytic clearance by interacting with SIRPA/B on immune cells, a well-established mechanism of immune escape in various cancers. GeneCards: CD47
- TGFB1-TGFBR1_TGFBR2: Interactions involving TGFB1, particularly between Macrophages and Aneuploid Lung Epithelial cells, point to a highly immunosuppressive microenvironment. TGFB1 is a potent cytokine that suppresses anti-tumor immune responses, promotes epithelial-mesenchymal transition (EMT), and contributes to fibrosis. GeneCards: TGFB1
- CXCL12-CXCR4: This axis is frequently implicated in immune cell trafficking, tumor growth, and metastasis. Its strong presence in tumor conditions, involving Aneuploid Lung Epithelial cells, Macrophages, and T cells, suggests a role in recruiting immunosuppressive cells (e.g., regulatory T cells, myeloid-derived suppressor cells) or promoting tumor cell survival and invasion. GeneCards: CXCL12
- Pro-tumorigenic Macrophage Polarization: Macrophages are highly interactive in the tumor microenvironment. Interactions like APOE-TREM2 (especially between Macrophages and Aneuploid Lung Epithelial cells) and SPP1-integrin (involving Macrophages) indicate a shift towards a pro-tumorigenic phenotype (e.g., M2-like tumor-associated macrophages, TAMs). TREM2 activation can lead to immunosuppression, while SPP1 (Osteopontin) promotes inflammation, angiogenesis, and metastasis. PubMed search: APOE TREM2 cancer GeneCards: SPP1
- Angiogenesis and Stromal Remodeling:
- VEGFA-VEGFR1/2: Interactions, particularly involving Endothelial cells, Aneuploid Lung Epithelial cells, and Macrophages, highlight active angiogenesis, which is essential for tumor blood supply and growth. GeneCards: VEGFA
- Fibroblast Interactions: Fibroblasts interact with Aneuploid Lung Epithelial cells via pathways like CXCL12-CXCR4, suggesting their role in extracellular matrix remodeling and creating a supportive niche for tumor growth and invasion.
- WNT Signaling: WNT7B-FZD4 interactions, predominantly among Aneuploid Lung Epithelial cells and with Macrophages, suggest active WNT signaling. This pathway is crucial for cell proliferation, differentiation, and development, and its aberrant activation is frequently observed in various cancers, promoting tumor cell survival and growth.
Clinical or Translational Implications
The identified cell-cell interaction patterns offer significant opportunities for therapeutic target prioritization and experimental validation in lung cancer.
- Therapeutic Target Prioritization:
- Immune Checkpoint Blockade: The prominent CD47-SIRB1B interactions strongly suggest CD47 as a valuable target for "don't eat me" blockade strategies in lung cancer, aiming to unleash macrophage-mediated phagocytosis of tumor cells.
- Chemokine Axis Inhibition: Targeting the CXCL12-CXCR4 axis could prevent the recruitment of immunosuppressive cells, inhibit angiogenesis, and reduce tumor cell migration, thereby sensitizing tumors to other therapies.
- TGF-β Pathway Inhibition: Given the strong immunosuppressive role of TGF-β, its inhibitors could enhance anti-tumor immunity and reverse pro-fibrotic changes in the tumor microenvironment.
- TAM-targeting Strategies: The APOE-TREM2 and SPP1-integrin axes represent potential targets to reprogram pro-tumorigenic macrophages (TAMs) towards an anti-tumor phenotype or deplete them, thereby enhancing anti-cancer immune responses.
- Anti-angiogenic Therapy: The VEGFA-VEGFR interactions reinforce the rationale for using anti-angiogenic agents, which could be combined with other therapies to improve outcomes.
- Experimental Validation:
- In vitro studies: The identified ligand-receptor pairs can be experimentally validated using co-culture systems of Aneuploid Lung Epithelial cells with primary immune cells (macrophages, T cells) or stromal cells (fibroblasts, endothelial cells). Blocking specific interactions using antibodies or small molecules could elucidate their functional impact on tumor cell proliferation, migration, and immune cell effector functions.
- In vivo models: Testing the efficacy of targeting these pathways in preclinical mouse models of lung cancer could provide strong evidence for their therapeutic potential, both as monotherapies and in combination with existing treatments like chemotherapy or immunotherapy.
- Biomarker Discovery: Quantifying the expression levels of these ligand and receptor pairs in patient biopsies, especially those differentiating early from advanced stages or responders from non-responders to therapy, could serve as prognostic or predictive biomarkers.
- Spatial Analysis: Further validation using spatial transcriptomics or multiplexed imaging techniques could confirm the spatial proximity and interaction of these specific cell types within the lung tumor microenvironment.
13. Immune Checkpoint and Cell Cycle Pathway Cell-Cell Interactions Across Lung Cancer Progression
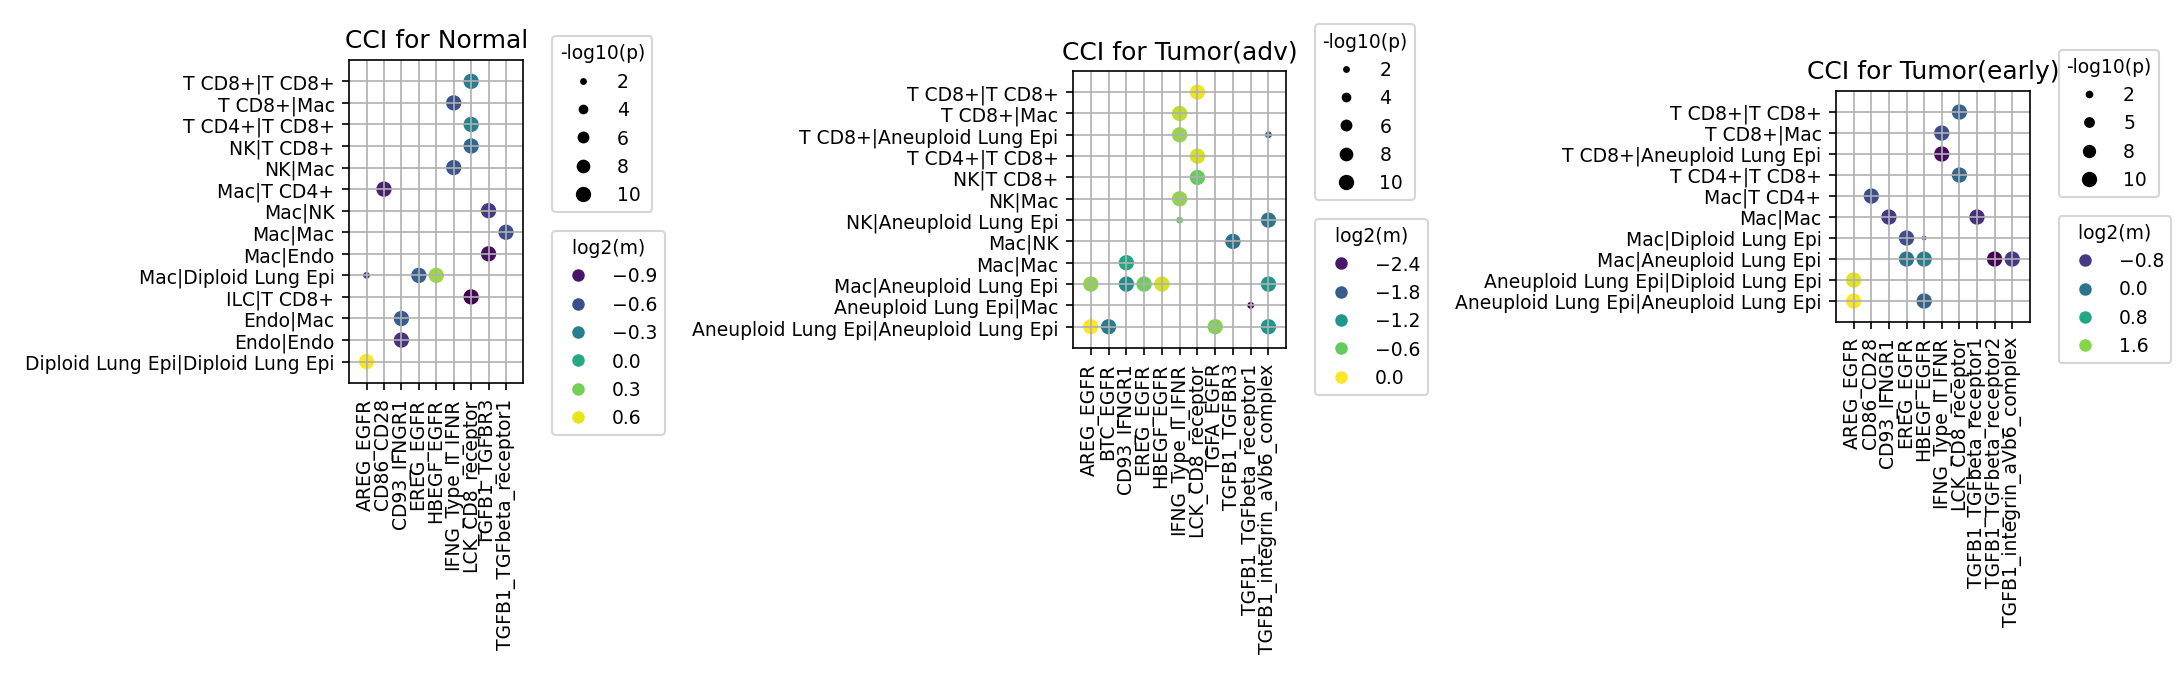
[Analysis Visualization Results]...
Analysis Overview
This analysis investigates cell-cell interactions (CCI) mediated by a selected set of genes associated with immune checkpoint and cell cycle pathways across different lung tissue conditions: Normal, Tumor (early), and Tumor (advanced). The plot_cci_dots tool was used to visualize significant ligand-receptor interactions between various cell types, with dot size representing the statistical significance (-log10(p-value)) and dot color indicating the mean expression level (log2(mean)) of the interacting gene pair. The analysis specifically focuses on how these interactions change with disease progression and the involvement of aneuploid versus diploid cell populations.
Visual Summary
The three dot plots illustrate cell-cell interactions for a curated list of immune checkpoint and cell cycle-related genes across Normal, Tumor (early), and Tumor (advanced) conditions.
Normal Condition:
- Key interactions include homotypic signaling within T cells (T CD8+|T CD8+) and macrophages (Mac|Mac) via the IFNG_Type II IFN receptor and LCK_CD8_receptor.
- Diploid Lung Epithelial cells show strong autocrine AREG_EGFR signaling.
- Interactions involving Endothelial cells and Macrophages are also observed for some EGFR ligands and IFNG.
Tumor (early) Condition:
- Aneuploid Lung Epithelial cells emerge, showing very strong autocrine AREG_EGFR signaling and interactions with Diploid Lung Epithelial cells.
- EGFR ligand interactions (AREG, HBEGF, EREG, BTC) become more prominent, especially involving Aneuploid Lung Epithelial cells and Macrophages.
- T-cell related interactions (IFNG_Type II IFN receptor, LCK_CD8_receptor) persist in various T-cell and T-cell-tumor interactions.
- Early signs of TGFB1 pathway activation (TGFB1_TGFBR1, TGFB1_TGFBR2, TGFB1_TGFBR3) appear, particularly involving Macrophages and Aneuploid Lung Epithelial cells.
Tumor (advanced) Condition:
- Interactions involving Aneuploid Lung Epithelial cells become dominant, with a widespread increase in both significance and mean expression for multiple EGFR ligand-receptor pairs (AREG_EGFR, BTC_EGFR, EREG_EGFR, HBEGF_EGFR) in homotypic interactions and with Macrophages.
- TGFB1-related interactions (TGFB1_TGFBR1, TGFB1_TGFBR2, TGFB1_TGFBR3, TGFB1_integrin_avb6_complex) are markedly enhanced, particularly between Macrophages and Aneuploid Lung Epithelial cells, and within Aneuploid Lung Epithelial cells. The TGFB1_integrin_avb6_complex interaction is notably strong.
- T-cell interactions (IFNG_Type II IFN receptor, LCK_CD8_receptor) remain present but are overshadowed by the strong tumor-driven and tumor-stromal interactions.
- The CD86-CD28 co-stimulatory interaction remains relatively weak across all conditions.
Biological Interpretation
The analysis of cell-cell interactions for immune checkpoint and cell cycle-associated genes reveals dynamic changes in intercellular communication patterns during lung cancer progression, heavily influenced by the emergence of aneuploid tumor cells.
- EGFR Signaling Dominance and Progression: In normal lung epithelial cells, baseline autocrine EGFR signaling (AREG_EGFR) is observed. As the tumor develops, particularly with the appearance of aneuploid lung epithelial cells, EGFR signaling intensifies dramatically. This is evidenced by increased strength and significance of multiple EGFR ligand-receptor pairs (AREG_EGFR, BTC_EGFR, EREG_EGFR, HBEGF_EGFR) in early and advanced tumors. This pattern suggests that aberrant activation of the EGFR pathway, driven by both autocrine and paracrine mechanisms (e.g., from macrophages to tumor cells), is a central feature of lung cancer progression, promoting tumor growth and survival. GeneCards: EGFR
- Emergence of Immunosuppressive TGF-beta Signaling: TGF-beta signaling becomes increasingly prominent and significant in the tumor microenvironment, especially in advanced stages. The interactions involving TGFB1 with its receptors (TGFBR1, TGFBR2, TGFBR3) and the TGFB1_integrin_avb6_complex are strongly upregulated between aneuploid lung epithelial cells and macrophages, and within the tumor cells themselves. TGF-beta is a known potent immunosuppressive cytokine that promotes tumor growth, metastasis, and fibrosis, while inhibiting anti-tumor immune responses. The integrin_avb6 complex is crucial for activating latent TGF-beta, suggesting an active mechanism for unleashing its pro-tumor effects. PubMed Search: TGFB1 in Lung Cancer
- Dynamic Immune Cell Interactions: Interactions involving T cells (T CD8+, T CD4+, NK cells) with other immune cells and tumor cells are consistently present. The IFNG_Type II IFN receptor and LCK_CD8_receptor pathways highlight ongoing immune activity and T-cell function. However, the relatively weak CD86-CD28 co-stimulatory interaction across all conditions might suggest suboptimal T-cell activation, potentially contributing to immune evasion in the tumor microenvironment. While several immune checkpoint genes like PDCD1 (PD-1) and CD274 (PD-L1) were included in the target list, their specific ligand-receptor interactions were not among the most prominent (top 80) in these plots, which could indicate that other immune checkpoint pathways or interactions are more dominant or that their expression levels/interactions are below the specified cutoffs for visualization.
- Role of Ploidy Status: The distinction between "Diploid Lung Epi" and "Aneuploid Lung Epi" clearly demonstrates that aneuploid cells drive many of the observed pathological interactions in tumor conditions. This highlights the importance of genomic instability and altered ploidy in shaping the tumor microenvironment and cellular communication networks.
Clinical or Translational Implications
The findings from this cell-cell interaction analysis offer several crucial clinical and translational insights for lung cancer:
- Reaffirming EGFR as a Key Therapeutic Target: The sustained and intensified EGFR signaling in aneuploid tumor cells, particularly in advanced disease, strongly supports the continued use and development of EGFR inhibitors. The specific ligands identified (AREG, BTC, EREG, HBEGF) could also serve as biomarkers to stratify patients who might benefit most from EGFR-targeted therapies or to monitor treatment response.
- Targeting the TGF-beta Pathway for Immunotherapy and Anti-fibrosis: The robust upregulation of TGF-beta signaling, especially involving the TGFB1_integrin_avb6_complex, presents a compelling rationale for targeting this pathway in advanced lung cancer. TGF-beta inhibitors or agents blocking integrin αvβ6 could reduce immunosuppression, inhibit tumor progression, and alleviate tumor-associated fibrosis, potentially improving responses to existing therapies, including immune checkpoint inhibitors. PubMed Search: TGF-beta inhibitors lung cancer
- Addressing Co-stimulation Deficiencies in Immunotherapy: The consistently weak CD86-CD28 interaction suggests a potential deficit in T-cell co-stimulation. Strategies aimed at enhancing co-stimulatory pathways (e.g., agonistic antibodies for CD28 or other co-stimulatory molecules) could be explored in combination with other immunotherapies to boost anti-tumor T-cell responses in lung cancer patients.
- Combined Therapeutic Approaches: The co-occurrence of strong pro-oncogenic EGFR signaling and immunosuppressive TGF-beta signaling in advanced tumors suggests that combination therapies targeting both pathways could be more effective than single-agent approaches. For instance, combining EGFR inhibitors with TGF-beta pathway blockers or immune checkpoint inhibitors might synergistically improve patient outcomes.
- Biomarker Discovery and Patient Stratification: The specific ligand-receptor pairs identified, such as AREG-EGFR or TGFB1-integrin_avb6_complex, could serve as predictive biomarkers for response to targeted therapies or prognostic indicators of disease aggressiveness, aiding in personalized medicine strategies. Further experimental validation would be crucial to confirm their utility.
14. Condition-Specific Cell-Cell Interaction Patterns in Lung Cancer
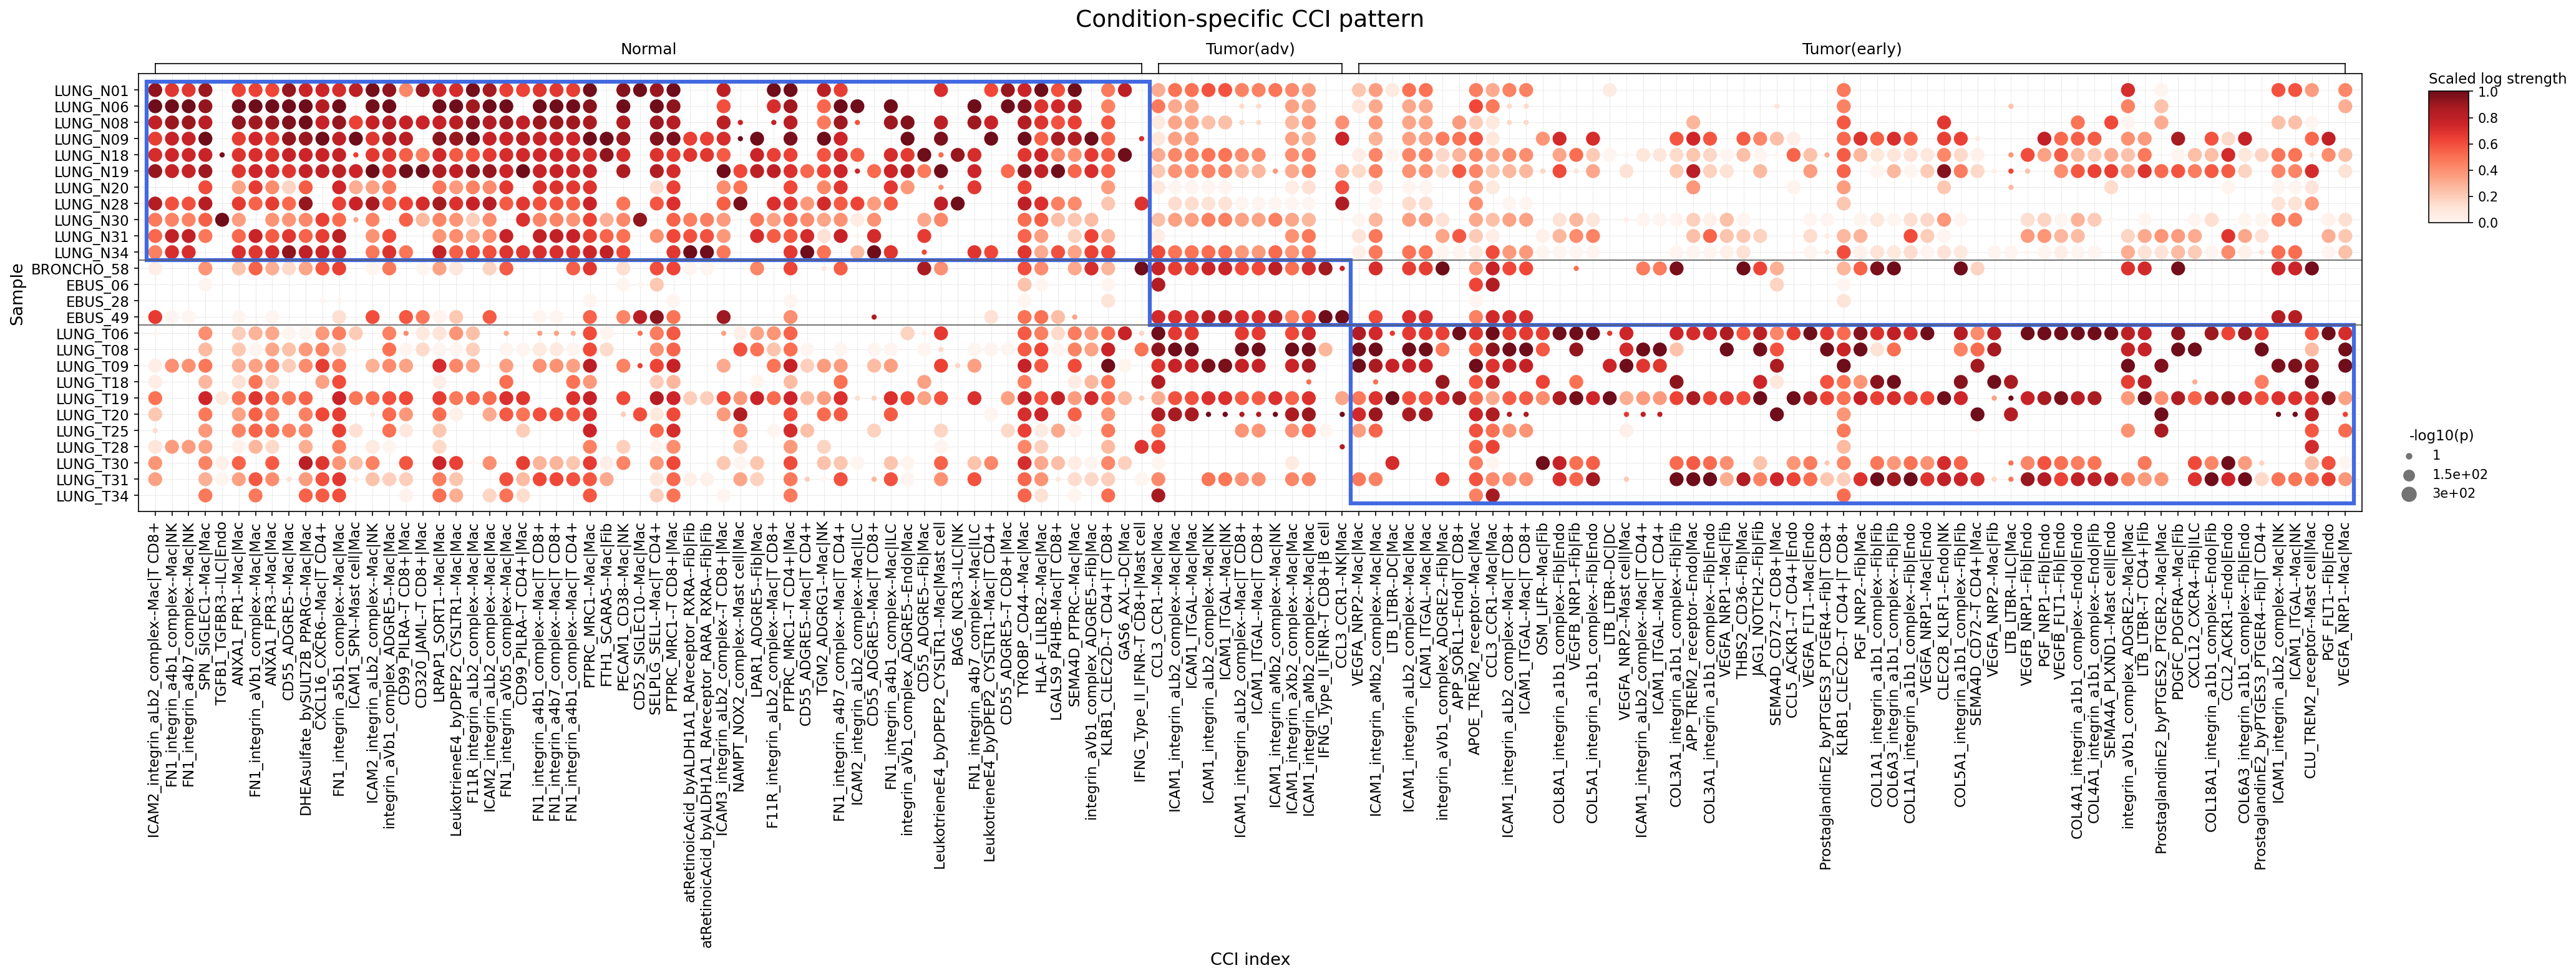
[Analysis Visualization Results]...
Analysis Overview
This analysis identifies cell-cell interactions (CCIs) involving major immune and stromal cell types that exhibit significant differences across Normal, Tumor (early), and Tumor (advanced) conditions in lung tissue. The CellPhoneDB method was used to infer ligand-receptor interactions, and the results are visualized as a dot plot, where dot color indicates scaled interaction strength and dot size represents statistical significance (-log10(p-value)). This provides insight into how the cellular communication landscape changes during lung tumor progression.
Visual Summary
The dot plot effectively highlights condition-specific patterns of cell-cell interactions.
- Normal Condition Dominance (Left Panel): The Normal samples (top rows, left section) show a high prevalence of strong and significant interactions (dark red, large dots) involving various integrin complexes, ICAMs, and ANXA1-FPR1. These interactions primarily occur between Macrophages, T cells (CD8+, CD4+), and NK cells. This suggests a robust immune surveillance and homeostatic adhesion/migration profile in healthy lung tissue.
- Tumor-Associated Remodeling (Right Panels): Both Tumor (early) and Tumor (advanced) conditions (right sections) exhibit a distinct shift in CCI patterns. Many of the immune cell-centric interactions prominent in Normal tissue are markedly reduced in strength and significance. Instead, a new set of interactions emerges and intensifies, particularly involving Fibroblasts and Endothelial cells.
- Emergence of Stromal/Angiogenic CCIs in Tumor: In the tumor samples, interactions related to extracellular matrix (ECM) remodeling (e.g., various COL-integrin complexes) and angiogenesis (e.g., VEGFA-NRP1, PGF-NRP2) become more prominent. These interactions frequently involve Fibroblast-Fibroblast, Fibroblast-Endothelial cell, and Macrophage-Endothelial cell pairs.
- Progression-related Differences: While both tumor stages show altered CCI profiles compared to normal, the advanced tumor samples (Tumor (adv)) tend to show a further intensification of certain pro-tumorigenic stromal and angiogenic interactions, and a general attenuation of immune-related interactions, implying a more profoundly remodeled and immunosuppressive tumor microenvironment.
Biological Interpretation
The observed shifts in cell-cell interactions reflect fundamental changes in the lung microenvironment during tumorigenesis and progression.
- Immune Homeostasis in Normal Lung:
- Adhesion and Immune Activation: In normal lung, strong interactions like ICAM2_integrin_aLb2_complex--Mac|T CD8+, FN1_integrin_a4b1_complex--Mac|NK/T CD8+/T CD4+, and ICAM1_integrin_aLb2_complex--Mac|Mac are prominent. Integrins are crucial for cell adhesion to the ECM and other cells, facilitating immune cell migration and antigen presentation GeneCards: Integrin. ICAMs (Intercellular Adhesion Molecules) are vital for leukocyte adhesion, extravasation, and T-cell activation GeneCards: ICAM1. These interactions are essential for maintaining immune surveillance and tissue integrity.
- Macrophage Regulation: The strong ANXA1_FPR1--Mac|Mac interaction suggests active autocrine or paracrine regulation of macrophages. Annexin A1 (ANXA1) is known for its anti-inflammatory and immunomodulatory roles, often acting via Formyl Peptide Receptors (FPRs) on macrophages to dampen inflammation and promote resolution PubMed search: ANXA1 FPR1 macrophage anti-inflammatory.
- Tumor Microenvironment Remodeling:
- ECM Remodeling and Fibrosis: In both early and advanced tumor conditions, there is a significant upregulation of interactions involving collagen (COL) proteins (e.g., COL1A1_integrin_a1b1_complex--Fib|Fib, COL3A1_integrin_a1b1_complex--Fib|Endo, COL5A1_integrin_a1b1_complex--Fib|Fib) with integrins on Fibroblasts and Endothelial cells. This signifies extensive remodeling of the extracellular matrix, a hallmark of tumor-associated fibrosis. This stiffened and altered ECM plays a critical role in promoting tumor cell proliferation, migration, invasion, and drug resistance PubMed search: tumor microenvironment ECM remodeling.
- Angiogenesis Promotion: Interactions such as VEGFA_NRP1--Fib|Mac, VEGFA_NRP1--Fib|Endo, VEGFA_NRP1--Endo|Endo, and PGF_NRP2--Fib|Mac/Endo are highly activated in tumor conditions. Vascular Endothelial Growth Factor A (VEGFA) and Placental Growth Factor (PGF) are potent pro-angiogenic factors that bind to VEGF receptors and co-receptors like Neuropilin 1 (NRP1) and Neuropilin 2 (NRP2) GeneCards: VEGFA, GeneCards: PGF. Their increased activity drives the formation of new blood vessels, crucial for tumor growth and metastasis.
- Immune Evasion and Stromal Support: The CXCL12_CXCR4--Fib|Mac interaction is also observed. The CXCL12-CXCR4 axis is well-known for its roles in immune cell trafficking, tumor cell migration, and fostering an immunosuppressive tumor microenvironment by recruiting regulatory immune cells and stromal cells GeneCards: CXCL12. The PDGFC_PDGFRA--Mac|Fib interaction also highlights cross-talk between macrophages and fibroblasts, contributing to tumor growth and fibrosis GeneCards: PDGFC.
Clinical or Translational Implications
The differential cell-cell interaction patterns identified have significant clinical and translational implications for lung cancer:
- Biomarkers of Progression: The shift from immune-centric to stromal/angiogenic CCIs could serve as a diagnostic or prognostic biomarker panel, distinguishing healthy tissue from early and advanced lung tumors. Specific ligand-receptor pairs, like those involving COL-integrins or VEGF-NRPs, could be measured to assess tumor progression or response to therapy.
- Therapeutic Targets:
- Targeting Angiogenesis: The prominent role of VEGFA/PGF-NRP1/NRP2 signaling in tumor conditions reinforces the rationale for anti-angiogenic therapies (e.g., bevacizumab targeting VEGFA) in lung cancer. Targeting NRP1 or NRP2 directly could be alternative strategies to disrupt tumor blood supply.
- Modulating ECM Remodeling: Inhibiting key COL-integrin interactions or enzymes involved in ECM remodeling (e.g., matrix metalloproteinases, though not directly shown here) could disrupt tumor growth, invasion, and metastasis, potentially enhancing the efficacy of other treatments.
- Disrupting Immunosuppression: The increased CXCL12-CXCR4 signaling suggests that targeting this axis could reduce tumor-promoting stromal cell recruitment and potentially reverse immunosuppression, thereby improving the effectiveness of immunotherapy PubMed search: CXCL12 CXCR4 tumor therapy.
- Understanding Immune Evasion: The observed decrease in immune cell adhesion and activation pathways in tumor conditions suggests mechanisms of immune evasion. Strategies to restore these critical immune interactions could enhance anti-tumor immunity.
- Combination Therapies: Given the complex interplay of these pathways, combination therapies that simultaneously target angiogenesis, ECM remodeling, and immunosuppressive signaling may offer more effective treatment strategies than single-agent approaches.
15. Lung Epithelial Cell Condition-Specific Surfaceome Markers
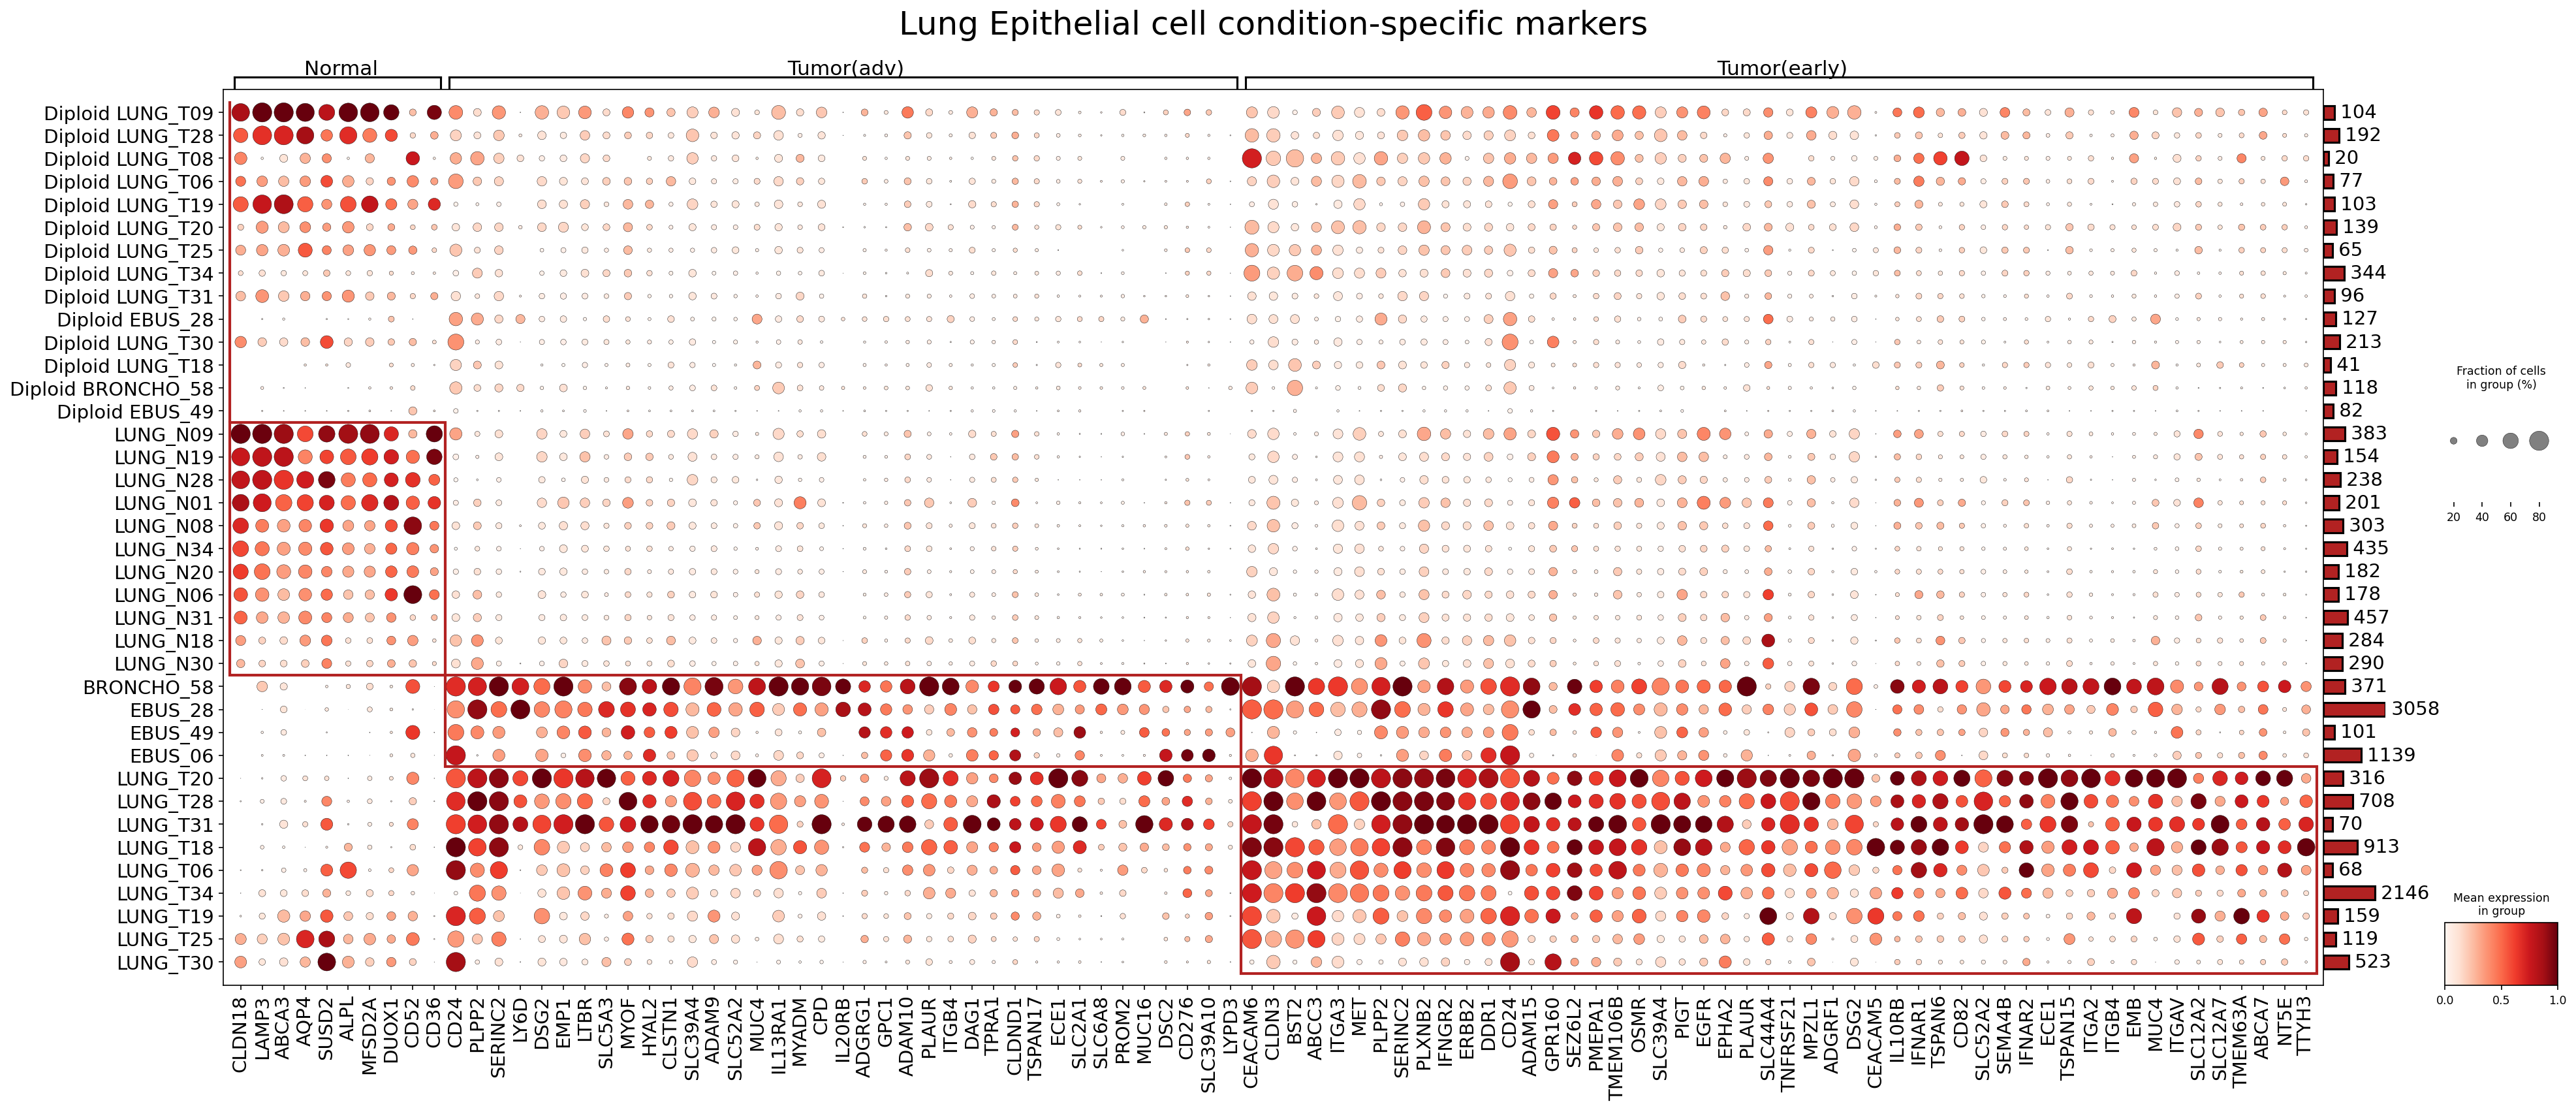
[Analysis Visualization Results]...
Analysis Overview
This analysis identifies condition-specific surfaceome markers in Lung Epithelial cells from single-cell RNA-seq data. The dot plot visualizes the expression of up to 50 top surfaceome markers per condition (Normal, Tumor(adv), Tumor(early)) across various individual samples. Dot size represents the fraction of cells expressing a given gene within a sample, while dot color intensity indicates the mean expression level. This approach allows for the discovery of surface markers that distinguish different disease states and could serve as diagnostic or therapeutic targets.
Visual Summary
The dot plot effectively stratifies Lung Epithelial cells based on their surfaceome marker expression across Normal, Tumor(adv) (advanced), and Tumor(early) conditions.
- Normal Condition Signature: A distinct cluster of genes (e.g., CLDN18, LAMP3, ABCA3, AQP4) shows consistently high expression and prevalence in normal lung tissue samples (LUNG_N series) and also in "Diploid LUNG_T" samples, which are likely non-malignant epithelial cells obtained from tumor patients but maintaining a diploid state. These markers appear significantly downregulated or absent in both early and advanced tumor samples.
- Tumor-Associated Signature: A large set of surface markers exhibits markedly increased expression and fraction of positive cells in both Tumor(early) and Tumor(adv) conditions compared to Normal. Key examples include well-known oncogenic receptors like EGFR, ERBB2 (HER2), and MET, along with cell adhesion molecules (e.g., CEACAM5, CEACAM6, ITGA2, ITGAV) and immune modulators (e.g., CD276/B7-H3).
- Overlap between Tumor Stages: Many of the upregulated surface markers are shared between Tumor(early) and Tumor(adv) conditions, suggesting that a core malignant epithelial surfaceome signature is established early in lung tumor development and largely maintained through advanced stages. While subtle quantitative differences might exist, a clear qualitative distinction between early and advanced tumor markers is less apparent in this specific panel compared to the stark differences between normal and tumor states.
- Sample Heterogeneity: Within each condition, there is some variability in marker expression across individual samples, particularly evident in the tumor groups where some samples show higher or lower expression of certain markers. This highlights inter-patient heterogeneity.
Biological Interpretation
The identified surfaceome markers provide critical insights into the biological changes occurring in lung epithelial cells during oncogenesis.
- Normal Lung Epithelial Cell Identity: Markers like CLDN18 (a tight junction protein), LAMP3 (lysosome-associated membrane protein 3, also associated with exosomes), and ABCA3 (ATP-binding cassette transporter, crucial for surfactant metabolism in alveolar type II cells) are highly expressed in normal lung epithelial cells. Their downregulation in tumor cells suggests a loss of normal epithelial differentiation and barrier function during malignant transformation. The robust expression of these markers in "Diploid LUNG_T" samples further supports their role in non-malignant lung epithelial cells within the tumor microenvironment. GeneCards: CLDN18, GeneCards: ABCA3
- Oncogenic Pathway Activation: The significant upregulation of receptor tyrosine kinases such as EGFR, ERBB2 (HER2), and MET in both early and advanced tumor cells is highly consistent with their established roles as drivers of lung cancer proliferation, survival, and metastasis. These receptors are frequently mutated or overexpressed in non-small cell lung cancer (NSCLC) and are major therapeutic targets. GeneCards: EGFR, GeneCards: ERBB2, GeneCards: MET
- Altered Cell-Cell/ECM Interactions and Immune Evasion: The upregulation of cell adhesion molecules like CEACAM5, CEACAM6, and various integrins (e.g., ITGA2, ITGA3, ITGB4, ITGAV) in tumor cells points to dysregulated cell-cell and cell-extracellular matrix interactions, which are critical for tumor invasion and metastasis. Additionally, CD276 (B7-H3), an immune checkpoint ligand that promotes immune evasion, is also prominently expressed in tumor epithelial cells, indicating a mechanism by which tumor cells escape immune surveillance. GeneCards: CEACAM5, GeneCards: CD276
- Mucin Expression Changes: While MUC16 is expressed in some normal samples, MUC4 shows a more consistent upregulation in tumor conditions. Mucins can contribute to tumor cell protection, anti-apoptosis, and metastasis. GeneCards: MUC4
- Early Onset of Malignant Phenotype: The striking similarity in the surfaceome marker profile between Tumor(early) and Tumor(adv) suggests that many of the critical molecular alterations driving lung cancer are already present at early stages of the disease, allowing for early detection and intervention based on these markers.
Clinical or Translational Implications
The identified condition-specific surfaceome markers in Lung Epithelial cells hold significant clinical and translational potential.
Diagnostic and Prognostic Biomarkers:
- Markers highly specific to tumor cells (e.g., high expression of EGFR, ERBB2, MET, CD276, CEACAM5/6, MUC4) and low expression of normal markers (e.g., CLDN18, ABCA3) could be developed into diagnostic panels for lung cancer. These surface markers are amenable to detection via immunohistochemistry on tissue biopsies or by flow cytometry on liquid biopsy samples (e.g., circulating tumor cells), offering non-invasive or minimally invasive diagnostic approaches.
- The consistent expression of these oncogenic markers even in early-stage tumors highlights their potential for early detection strategies, which is critical for improving patient outcomes.
Therapeutic Targets:
- The prominent expression of surface receptors like EGFR, ERBB2 (HER2), and MET reinforces their established roles as druggable targets in lung cancer. These findings provide further evidence at the single-cell level for the utility of existing targeted therapies (e.g., EGFR TKIs, HER2-targeted antibodies) and could guide the development of new antibody-drug conjugates (ADCs) or bispecific antibodies.
- CD276 (B7-H3), a widespread immune checkpoint, is an attractive target for immunotherapy, with several agents currently in clinical trials for various cancers including lung cancer. PubMed Search: B7-H3 lung cancer immunotherapy
- Other surface proteins like CEACAM5/6 and MUC4, which are also upregulated in tumor cells, are being explored as targets for antibody-based therapies due to their accessibility on the cell surface and association with cancer progression.
- Differentiation from Normal/Benign Cells: The clear distinction between the surfaceome of normal/diploid epithelial cells and tumor cells allows for the development of highly specific agents that target cancer cells while sparing healthy lung tissue, potentially reducing off-target toxicities. This is particularly relevant given the presence of "Diploid LUNG_T" cells that resemble normal cells, emphasizing the specificity of the tumor signature.
16. Macrophage Condition-Specific Surfaceome Markers in Lung Tissue
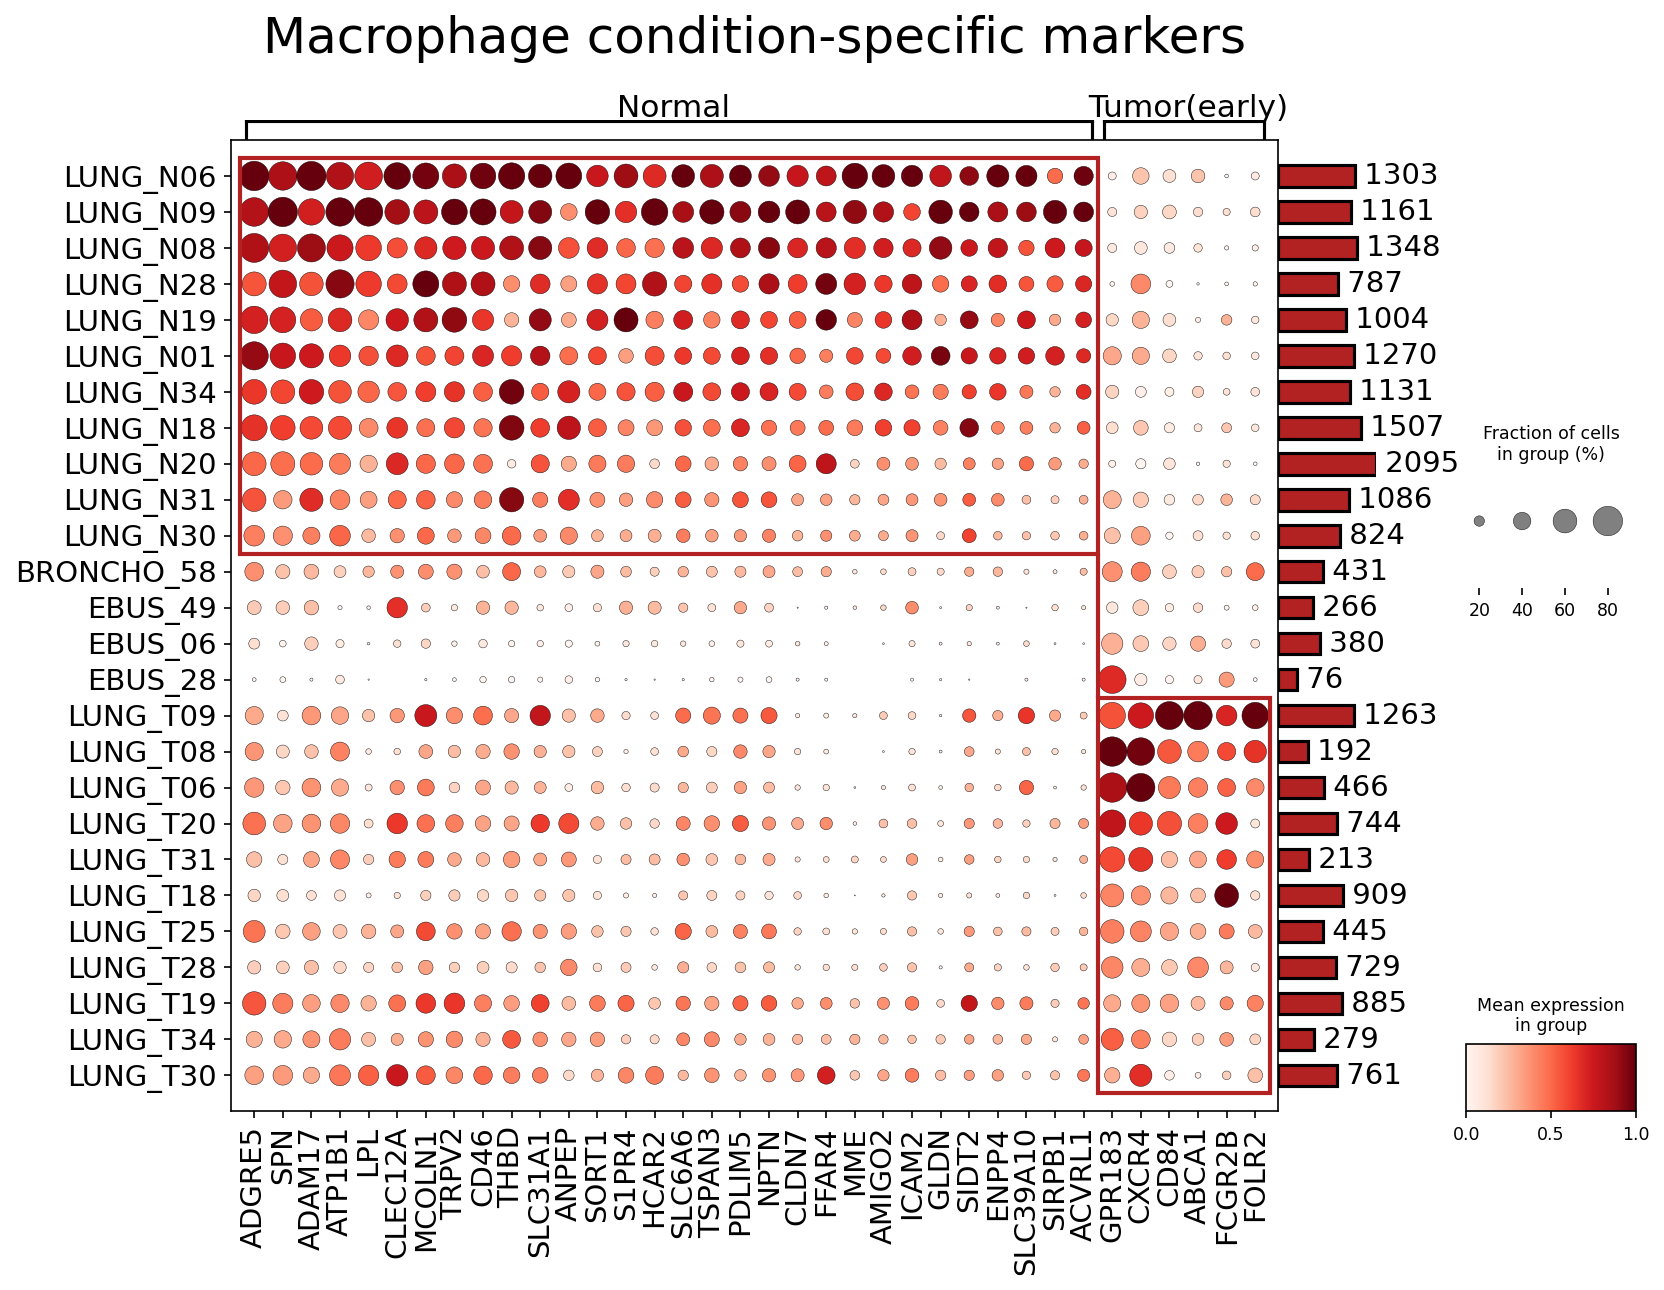
[Analysis Visualization Results]...
Analysis Overview
This analysis identifies condition-specific surface markers for Macrophages found in Lung tissue, comparing Normal samples to early-stage Tumor samples. The dot plot visualizes the expression of these markers across individual patient samples, highlighting differential gene expression patterns that distinguish macrophages in these two distinct microenvironments. Only surfaceome markers were considered, with up to 30 markers selected per condition.
Visual Summary
The dot plot effectively visualizes the expression patterns of macrophage surface markers across various patient samples categorized into 'Normal' and 'Tumor(early)' conditions.
- Clear Condition-Specific Segregation: The markers are distinctly grouped into those highly expressed in 'Normal' samples (left side of the plot) and those highly expressed in 'Tumor(early)' samples (right side of the plot). This indicates a clear shift in macrophage surface marker profiles between healthy lung tissue and early-stage lung tumors.
- Normal Macrophage Signature: A prominent cluster of genes, including *ADGRE5*, *SPN*, *ADAM17*, *ATP1B1*, *LPL*, *CLEC12A*, *MCOLN1*, *TRPV2*, *CD46*, *THBD*, *SLC31A1*, *ANPEP*, *SORT1*, *S1PR4*, *HCAR2*, *SLC6A6*, *TSPAN3*, *PDLIM5*, *NPTN*, *CLDN7*, *FFAR4*, *MME*, *AMIGO2*, *ICAM2*, *GLDN*, *SIDT2*, *ENPP4*, and *SLC39A10*, shows high mean expression (darker red color) and high fraction of cells expressing the gene (larger dot size) specifically in the 'Normal' lung samples. This pattern is consistent across most normal samples (LUNG_N06 to LUNG_N30).
- Tumor(early) Macrophage Signature: Conversely, a distinct set of markers, including *SIRPB1*, *ACVRL1*, *GPR183*, *CXCR4*, *CD84*, *ABCA1*, *FCGR2B*, and *FOLR2*, demonstrates high expression predominantly in 'Tumor(early)' samples (LUNG_T09 to LUNG_T30). These markers are largely absent or expressed at very low levels in 'Normal' samples.
- Sample Variability: While the overall patterns are clear, some heterogeneity is observed within each condition. For instance, certain normal samples (e.g., BRONCHO_58, EBUS_49) show lower overall expression of the 'Normal' markers compared to lung biopsy samples. Similarly, some 'Tumor(early)' samples exhibit varying degrees of marker expression.
- Cell Count Information: The bar plot on the right indicates the number of macrophage cells contributed by each sample to the analysis, providing context for the robustness of the observed expression patterns per sample.
Biological Interpretation
The observed condition-specific surface markers highlight a significant phenotypic remodeling of macrophages in the early tumor microenvironment compared to normal lung tissue.
- Normal Lung Macrophage Identity: The markers enriched in normal lung macrophages likely reflect their homeostatic functions, such as efferocytosis, pathogen clearance, and tissue repair.
- ADGRE5 (CD97): A cell adhesion G-protein coupled receptor involved in cell-cell interactions and immune cell trafficking. GeneCards: ADGRE5
- SPN (CD43): A transmembrane sialoglycoprotein involved in cell adhesion and anti-adhesive functions, impacting immune cell migration and activation. GeneCards: SPN
- CLEC12A: A C-type lectin receptor expressed on myeloid cells, typically inhibitory, involved in regulating immune responses.
- S1PR4: A sphingosine-1-phosphate receptor that can influence immune cell migration and function. GeneCards: S1PR4
- ANPEP (CD13): Aminopeptidase N, involved in peptide metabolism and often serves as a marker for myeloid cells.
- Early Tumor-Associated Macrophage (TAM) Signature: The markers upregulated in early tumor macrophages are indicative of their pro-tumorigenic roles, including angiogenesis, immune suppression, and tumor cell growth. These macrophages likely represent an altered functional state, often referred to as Tumor-Associated Macrophages (TAMs).
- SIRPB1 (CD172b): A paired receptor with SIRPA (CD172a), involved in regulating phagocytosis and immune cell interactions. Its role in tumors can be complex, but SIRPα-CD47 axis is a well-known immune checkpoint. GeneCards: SIRPB1
- ACVRL1 (ALK1): A receptor for bone morphogenetic proteins (BMPs), crucial for angiogenesis. Its upregulation in TAMs could promote tumor vascularization. GeneCards: ACVRL1
- GPR183 (EBI2): A chemokine receptor involved in immune cell trafficking. In the context of cancer, it can influence immune cell recruitment to the tumor microenvironment. GeneCards: GPR183
- CXCR4: A chemokine receptor highly expressed in various cancer cells and TAMs, mediating migration and metastasis. The CXCL12-CXCR4 axis is a critical pathway for tumor progression and immune cell recruitment. GeneCards: CXCR4
- CD84: A member of the SLAM family of receptors, involved in immune cell activation and adhesion. Its role in TAMs suggests involvement in immune regulation within the TME. GeneCards: CD84
- ABCA1: An ATP-binding cassette transporter involved in cholesterol efflux. Its expression in TAMs might be linked to lipid metabolism alterations in the TME. GeneCards: ABCA1
- FCGR2B (CD32b): An inhibitory Fc gamma receptor, which can suppress immune responses and could contribute to the immunosuppressive phenotype of TAMs. GeneCards: FCGR2B
- FOLR2: Folate receptor beta, a known marker for M2-like macrophages and TAMs, involved in folate uptake and potentially contributing to tumor growth. GeneCards: FOLR2
Clinical or Translational Implications
The identification of condition-specific macrophage surface markers holds significant clinical and translational potential, particularly in the context of early lung cancer.
- Early Diagnostic and Prognostic Biomarkers: The specific upregulation of markers like *CXCR4*, *FOLR2*, *ACVRL1*, and *FCGR2B* in early tumor macrophages could serve as potential diagnostic or prognostic markers for lung cancer. Detecting these markers on circulating monocytes or tissue macrophages could aid in early detection or risk stratification.
- Therapeutic Targets: Given that these are surfaceome markers, they are highly accessible for targeted therapies.
- Immune Checkpoint Inhibition: Targeting macrophage surface receptors like SIRPB1 (potentially via the SIRPα-CD47 axis) could re-educate TAMs from a pro-tumor to an anti-tumor phenotype, enhancing anti-cancer immunity. PubMed search: CD47 SIRPalpha cancer immunotherapy
- Anti-angiogenic Strategies: Targeting ACVRL1 on TAMs could potentially inhibit tumor angiogenesis, thereby limiting nutrient supply to the growing tumor.
- Macrophage Depletion/Reprogramming: Markers like FOLR2, frequently associated with immunosuppressive TAMs, could be explored for antibody-drug conjugates or other targeted delivery systems to deplete or reprogram these cells, shifting the TME towards an anti-tumor state. PubMed search: FOLR2 targeting TAMs
- Migration Inhibition: Blocking CXCR4 on TAMs could prevent their recruitment to the tumor site, thereby hindering tumor growth and metastasis.
- Experimental Validation: These identified markers provide strong candidates for further experimental validation using techniques such as flow cytometry, immunohistochemistry (IHC) on tissue biopsies, or spatial transcriptomics to confirm their expression patterns and functional roles in patient samples and preclinical models. This could lead to the development of novel imaging agents to visualize TAMs in vivo.
17. Fibroblast Condition-Specific Surfaceome Markers in Normal and Early-Stage Lung Tumors
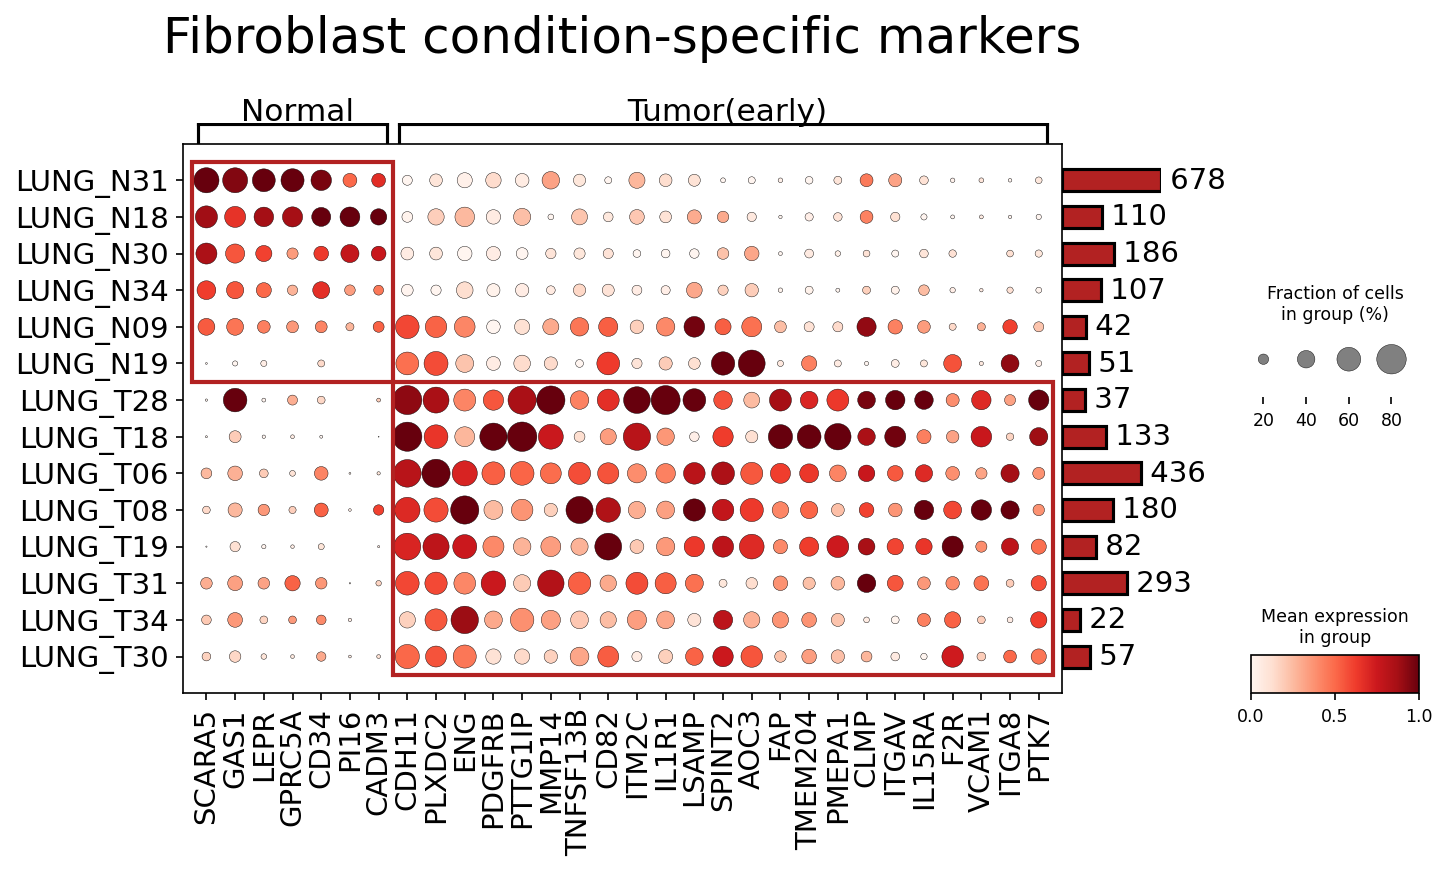
[Analysis Visualization Results]...
Analysis Overview
This analysis identifies and visualizes surfaceome markers that are specifically enriched in Fibroblast cells from either normal lung tissue or early-stage lung tumors. The dot plot displays the mean expression level (color intensity) and the fraction of cells expressing each marker (dot size) across individual lung samples, grouped by 'Normal' and 'Tumor(early)' conditions. The goal is to highlight molecular differences in fibroblasts that characterize their state in healthy lung versus the early tumor microenvironment.
Visual Summary
The dot plot clearly segregates Fibroblast surfaceome markers into two distinct groups based on their expression patterns across conditions:
- Normal-specific Markers (left panel, highlighted by top red box): A set of markers including SCARA5, GAS1, LEPR, GPRC5A, CD16, CADM3, PI16, and CD34 show high mean expression and are prevalent in a large fraction of Fibroblast cells from normal lung samples (LUNG_N31, N18, N30, N34, N09). These markers are largely absent or expressed at very low levels in Fibroblast cells from early tumor samples.
- Tumor(early)-specific Markers (right panel, highlighted by bottom red box): Conversely, a comprehensive panel of markers, notably PLXDC2, ENG, PDGFRB, PTTG1IP, MMP14, TNFSF13B, CD82, ITM2C, IL1R1, LSAMP, SPINT2, AOC3, FAP, TMEM204, PMEPA1, CLMP, ITGAV, IL15RA, F2R, VCAM1, ITGA8, and PTK7, exhibit strong and widespread expression in Fibroblast cells from all early tumor samples (LUNG_T28, T18, T06, T08, T19, T31, T34, T30). These markers are largely absent or minimally expressed in normal lung Fibroblasts.
- Consistency across samples: Within each condition, the expression patterns of these condition-specific markers are remarkably consistent across individual samples, although some variability in expression intensity and fraction of positive cells is observed. For instance, FAP, MMP14, and PDGFRB show consistently high expression and prevalence in almost all tumor samples.
- Cell count per sample: The bar chart on the right indicates the number of Fibroblast cells obtained from each sample, ranging from 22 to 678 cells, ensuring that marker detection is based on sufficient cell numbers.
Biological Interpretation
The distinct sets of surfaceome markers underscore a profound phenotypic shift in lung fibroblasts when transitioning from a normal homeostatic state to an early tumor-associated state. This aligns with the concept of cancer-associated fibroblasts (CAFs) being highly reprogrammed cells that actively contribute to the tumor microenvironment.
- Normal Fibroblast Phenotype: Markers like SCARA5 (involved in cell adhesion and growth), GAS1 (a growth suppressor), and LEPR (Leptin receptor, signaling involved in metabolism) suggest a fibroblast state primarily focused on tissue maintenance, quiescence, and metabolic regulation in the healthy lung. CD34, a marker for some progenitor populations and specific fibroblast subsets, could indicate a less differentiated or reparative role for normal lung fibroblasts.
- Tumor-Associated Fibroblast (CAF) Phenotype in Early Tumors: The upregulation of specific surface proteins in early tumor fibroblasts points to their active participation in tumor progression:
- FAP (Fibroblast Activation Protein): A canonical and highly specific marker for activated fibroblasts across various cancers. Its strong presence indicates robust CAF activation, which is critical for extracellular matrix (ECM) remodeling and creating a pro-tumorigenic niche. GeneCards: FAP
- MMP14 (Matrix Metallopeptidase 14): Also known as MT1-MMP, this is a key enzyme involved in degrading ECM components, facilitating tumor cell invasion and metastasis. Its upregulation highlights the role of early CAFs in actively remodeling the tumor stroma. GeneCards: MMP14
- PDGFRB (Platelet-Derived Growth Factor Receptor Beta): Signaling via PDGFRB drives fibroblast proliferation, migration, and differentiation, contributing to stromal desmoplasia and tumor growth. GeneCards: PDGFRB
- ENG (Endoglin / CD105): A co-receptor for TGF-beta, primarily known for its role in angiogenesis. Its expression by CAFs suggests their involvement in supporting the formation of new blood vessels crucial for tumor growth. GeneCards: ENG
- ITGAV (Integrin Alpha V) and ITGA8 (Integrin Alpha 8): Integrins mediate cell-ECM and cell-cell interactions. Their upregulation indicates altered adhesion and migration properties of CAFs, enabling their dynamic interactions within the tumor microenvironment. GeneCards: ITGAV
- VCAM1 (Vascular Cell Adhesion Molecule 1) and IL1R1 (Interleukin 1 Receptor Type 1): Suggest involvement in immune cell recruitment and responsiveness to inflammatory signals, indicative of the complex interplay between CAFs and the immune system in early tumors.
- Other markers like PLXDC2, PTTG1IP, AOC3, TMEM204, and PTK7 have also been implicated in various aspects of cancer biology, including angiogenesis, cell proliferation, and signaling, further solidifying the pro-tumorigenic role of these early CAFs.
Clinical or Translational Implications
The identification of highly distinct surfaceome marker panels for normal versus early tumor-associated fibroblasts holds significant clinical and translational potential:
- Early Diagnostic and Prognostic Biomarkers: The identified tumor-specific surface markers, particularly FAP, MMP14, PDGFRB, and ENG, could serve as excellent biomarkers for detecting early-stage lung tumors. Their surface localization makes them accessible for detection using techniques like immunohistochemistry on biopsies, flow cytometry, or potentially non-invasive liquid biopsy approaches targeting fibroblast-derived exosomes or circulating tumor cells. Such markers could aid in differentiating early lesions from benign conditions and potentially predict disease aggressiveness.
- Therapeutic Targets: The consistent and robust expression of these surface proteins on tumor-associated fibroblasts, but not on normal fibroblasts, makes them highly attractive therapeutic targets. Strategies such as antibody-drug conjugates (ADCs), CAR-T cell therapies, or small molecule inhibitors specifically designed to target FAP, PDGFRB, or MMP14 could selectively eliminate or reprogram CAFs, thereby disrupting their pro-tumorigenic support without affecting healthy tissues. Targeting CAFs represents a promising avenue for anti-cancer therapy, especially for solid tumors where the stroma plays a critical role. PubMed search: FAP cancer therapy
- Understanding Tumor Microenvironment Dynamics: Characterizing these early CAF markers provides crucial insights into the initial stages of tumor-stromal interaction. This understanding is vital for developing therapies that not only target cancer cells but also effectively modulate the supportive tumor microenvironment, potentially preventing progression or recurrence.
- Experimental Validation: These identified markers are strong candidates for further experimental validation in preclinical models and clinical cohorts to confirm their utility as diagnostic, prognostic, or therapeutic tools in lung cancer.
18. CD4+ T Cell Condition-Specific Surfaceome Markers in Lung Cancer
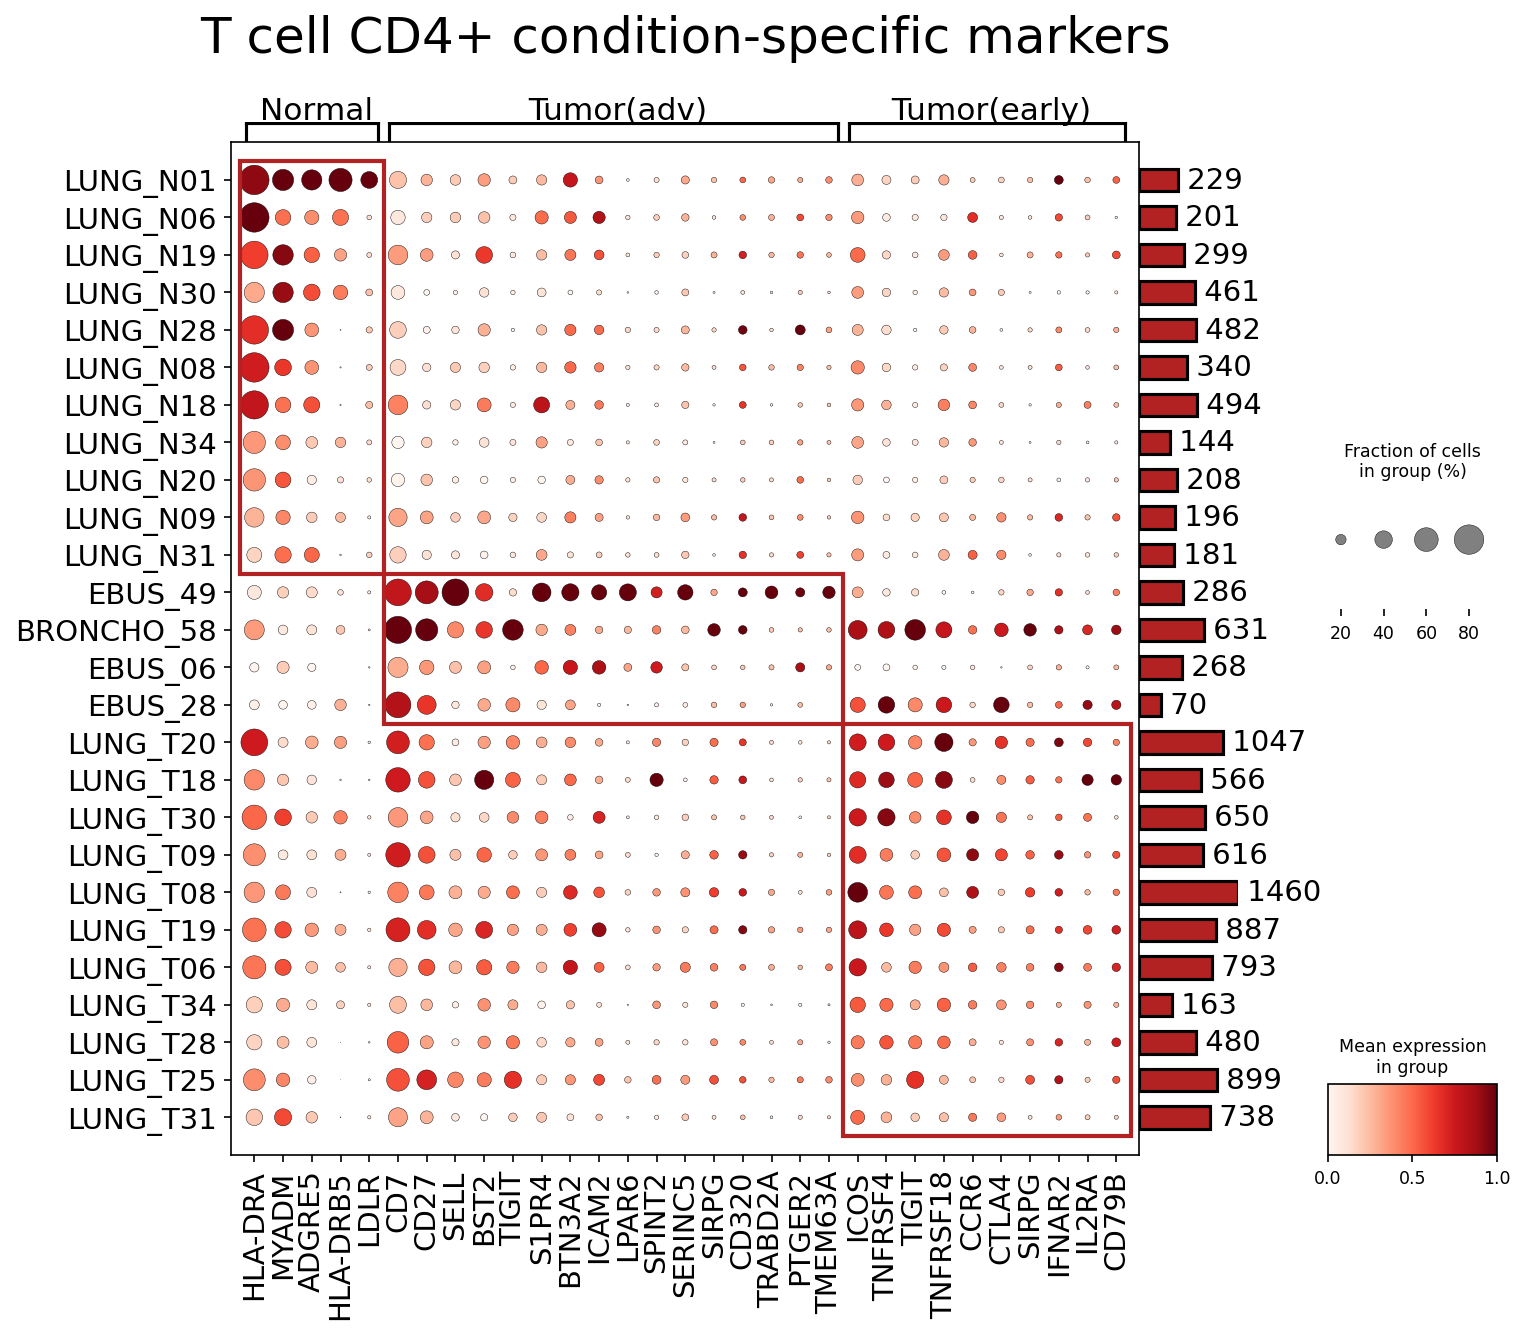
[Analysis Visualization Results]...
Analysis Overview
This analysis identifies and visualizes condition-specific surfaceome markers for CD4+ T cells across Normal, advanced tumor (Tumor(adv)), and early tumor (Tumor(early)) conditions in lung tissue. The dot plot displays the mean expression level (color intensity) and the fraction of cells expressing each marker (dot size) for each sample, grouped by condition. The focus is on surfaceome markers, making these candidates highly relevant for cell phenotyping, therapeutic targeting, and cell-cell interaction studies.
Visual Summary
The dot plot clearly delineates distinct patterns of CD4+ T cell surfaceome marker expression across the three conditions:
- Normal Condition Markers: A prominent cluster of markers (highlighted by the left red box) is highly expressed and prevalent in CD4+ T cells from Normal lung samples. Key markers include HLA-DRA, MYADM, ADGRE5, HLA-DRB5, LDLR, CD7, and SELL. These markers show significantly reduced or absent expression in both advanced and early tumor samples.
- Tumor-Associated Markers (Advanced and Early): Both tumor conditions (Tumor(adv) and Tumor(early)) show a marked shift in their CD4+ T cell surfaceome profile compared to Normal samples.
- Tumor(adv) Specific Markers: A distinct set of markers (highlighted by the middle red box) such as BST2, BTN3A2, S1PR4, ICAM2, LPAR6, SPINT2, SERINC5, TRABD2A, PTGER2, TMEM63A, ICOS, TNFRSF18, and particularly high expression of immune checkpoints TIGIT, CTLA4, and IL2RA are observed. These markers are highly expressed across a large fraction of CD4+ T cells in advanced tumor samples, with some expression also noted in early tumor samples for TIGIT, CTLA4, and IL2RA.
- Tumor(early) Specific Markers: While sharing some markers with Tumor(adv) (e.g., TIGIT, CTLA4, CCR6, SIRPG), a notable marker, TNFRSF4 (OX40), appears more pronounced and broadly expressed in early tumor samples. Other markers like CD27 and IFNAR2 also show differential patterns.
- Overlapping and Differentiating Markers: Genes like TIGIT, CTLA4, CCR6, and SIRPG are expressed in both advanced and early tumor conditions, suggesting shared immunological alterations in the tumor microenvironment. However, ICOS, TNFRSF18, and PTGER2 appear more strongly associated with advanced disease, while TNFRSF4 seems to be a more prominent feature of early tumor CD4+ T cells.
Biological Interpretation
The observed condition-specific surfaceome profiles of CD4+ T cells reveal distinct functional states across healthy and cancerous lung environments:
- Normal Lung CD4+ T Cells (Homeostatic/Surveillance): The robust expression of HLA-DRA and HLA-DRB5 (MHC Class II molecules) suggests that normal lung CD4+ T cells may exhibit antigen-presenting capabilities under specific conditions or represent a subset that has recently encountered antigens. SELL (L-selectin) expression indicates a propensity for lymphocyte homing to secondary lymphoid organs, characteristic of naive or central memory T cells involved in immune surveillance. CD7 is a pan-T cell marker, consistent with their identity. GeneCards: HLA-DRA, GeneCards: SELL
- Tumor-Associated CD4+ T Cells (Activated, Exhausted, or Immunosuppressive Phenotypes):
- Immune Checkpoint and Co-stimulatory Markers: The widespread upregulation of inhibitory immune checkpoints like TIGIT and CTLA4 in both early and advanced tumor CD4+ T cells strongly indicates an exhausted or anergic phenotype, or a regulatory T cell (Treg) signature. Concurrently, the expression of co-stimulatory molecules like ICOS and TNFRSF18 (GITR) (particularly in advanced tumors) and TNFRSF4 (OX40) (prominent in early tumors) points to ongoing T cell activation, which might be counteracted by inhibitory signals in the immunosuppressive tumor microenvironment. The balance between these activating and inhibitory signals dictates the overall anti-tumor efficacy. PubMed search: TIGIT CTLA4 ICOS cancer, GeneCards: TNFRSF4
- Migration and Immunomodulatory Molecules: Expression of S1PR4 and CCR6 suggests active trafficking of CD4+ T cells within or towards the tumor microenvironment, potentially in response to specific chemokines. PTGER2 (receptor for PGE2) is implicated in immunosuppression within tumors, as PGE2 can suppress T cell function. The presence of IL2RA (CD25) can indicate activated T cells or regulatory T cells (Tregs), which are critical for maintaining immune tolerance and often enriched in tumors. GeneCards: S1PR4, GeneCards: PTGER2
- Tumor Stage-Specific Dynamics: The more prominent expression of TNFRSF4 in early tumors could signify a more robust initial anti-tumor immune response compared to advanced stages, where exhaustion markers like TIGIT and CTLA4 become more dominant alongside markers like ICOS and TNFRSF18. This suggests a potential evolution of the CD4+ T cell phenotype as the tumor progresses.
Clinical or Translational Implications
These condition-specific surfaceome markers hold significant potential for clinical applications:
- Biomarkers for Disease Staging and Prognosis: The distinct surface marker profiles could serve as a valuable panel to differentiate between healthy lung tissue, early-stage, and advanced lung cancer. For instance, high expression of TNFRSF4 in CD4+ T cells might indicate an earlier immune activation state with potentially better prognosis, while a dominant TIGIT/CTLA4/ICOS signature could mark advanced disease or T cell exhaustion. These could be assessed by flow cytometry or multiplex immunohistochemistry on biopsy samples.
Therapeutic Targets for Immunotherapy:
- Immune Checkpoint Blockade: The prominent expression of TIGIT and CTLA4 in tumor-associated CD4+ T cells reinforces their established roles as targets for immune checkpoint blockade therapies in lung cancer. PubMed search: TIGIT CTLA4 immunotherapy lung cancer
- Co-stimulatory Agonism: Markers like ICOS, TNFRSF18 (GITR), and TNFRSF4 (OX40) are excellent candidates for agonistic antibody therapies aimed at enhancing anti-tumor CD4+ T cell responses, especially in early disease where TNFRSF4 is highly expressed. PubMed search: ICOS GITR OX40 agonist cancer therapy
- Novel Target Identification: Molecules like S1PR4 (involved in cell trafficking) or PTGER2 (linked to immunosuppression) represent novel surface targets whose modulation could alter CD4+ T cell recruitment or function within the tumor microenvironment, potentially improving existing immunotherapies or forming the basis for new treatment strategies.
- Patient Stratification and Treatment Monitoring: Identifying specific CD4+ T cell subsets based on these surface markers could enable better patient stratification for targeted immunotherapies. Monitoring changes in these marker profiles in peripheral blood or tumor biopsies could also provide insights into treatment response or disease progression.
19. Dysregulation of Cell Cycle Pathway Genes in Lung Epithelial Cells Across Tumor Progression
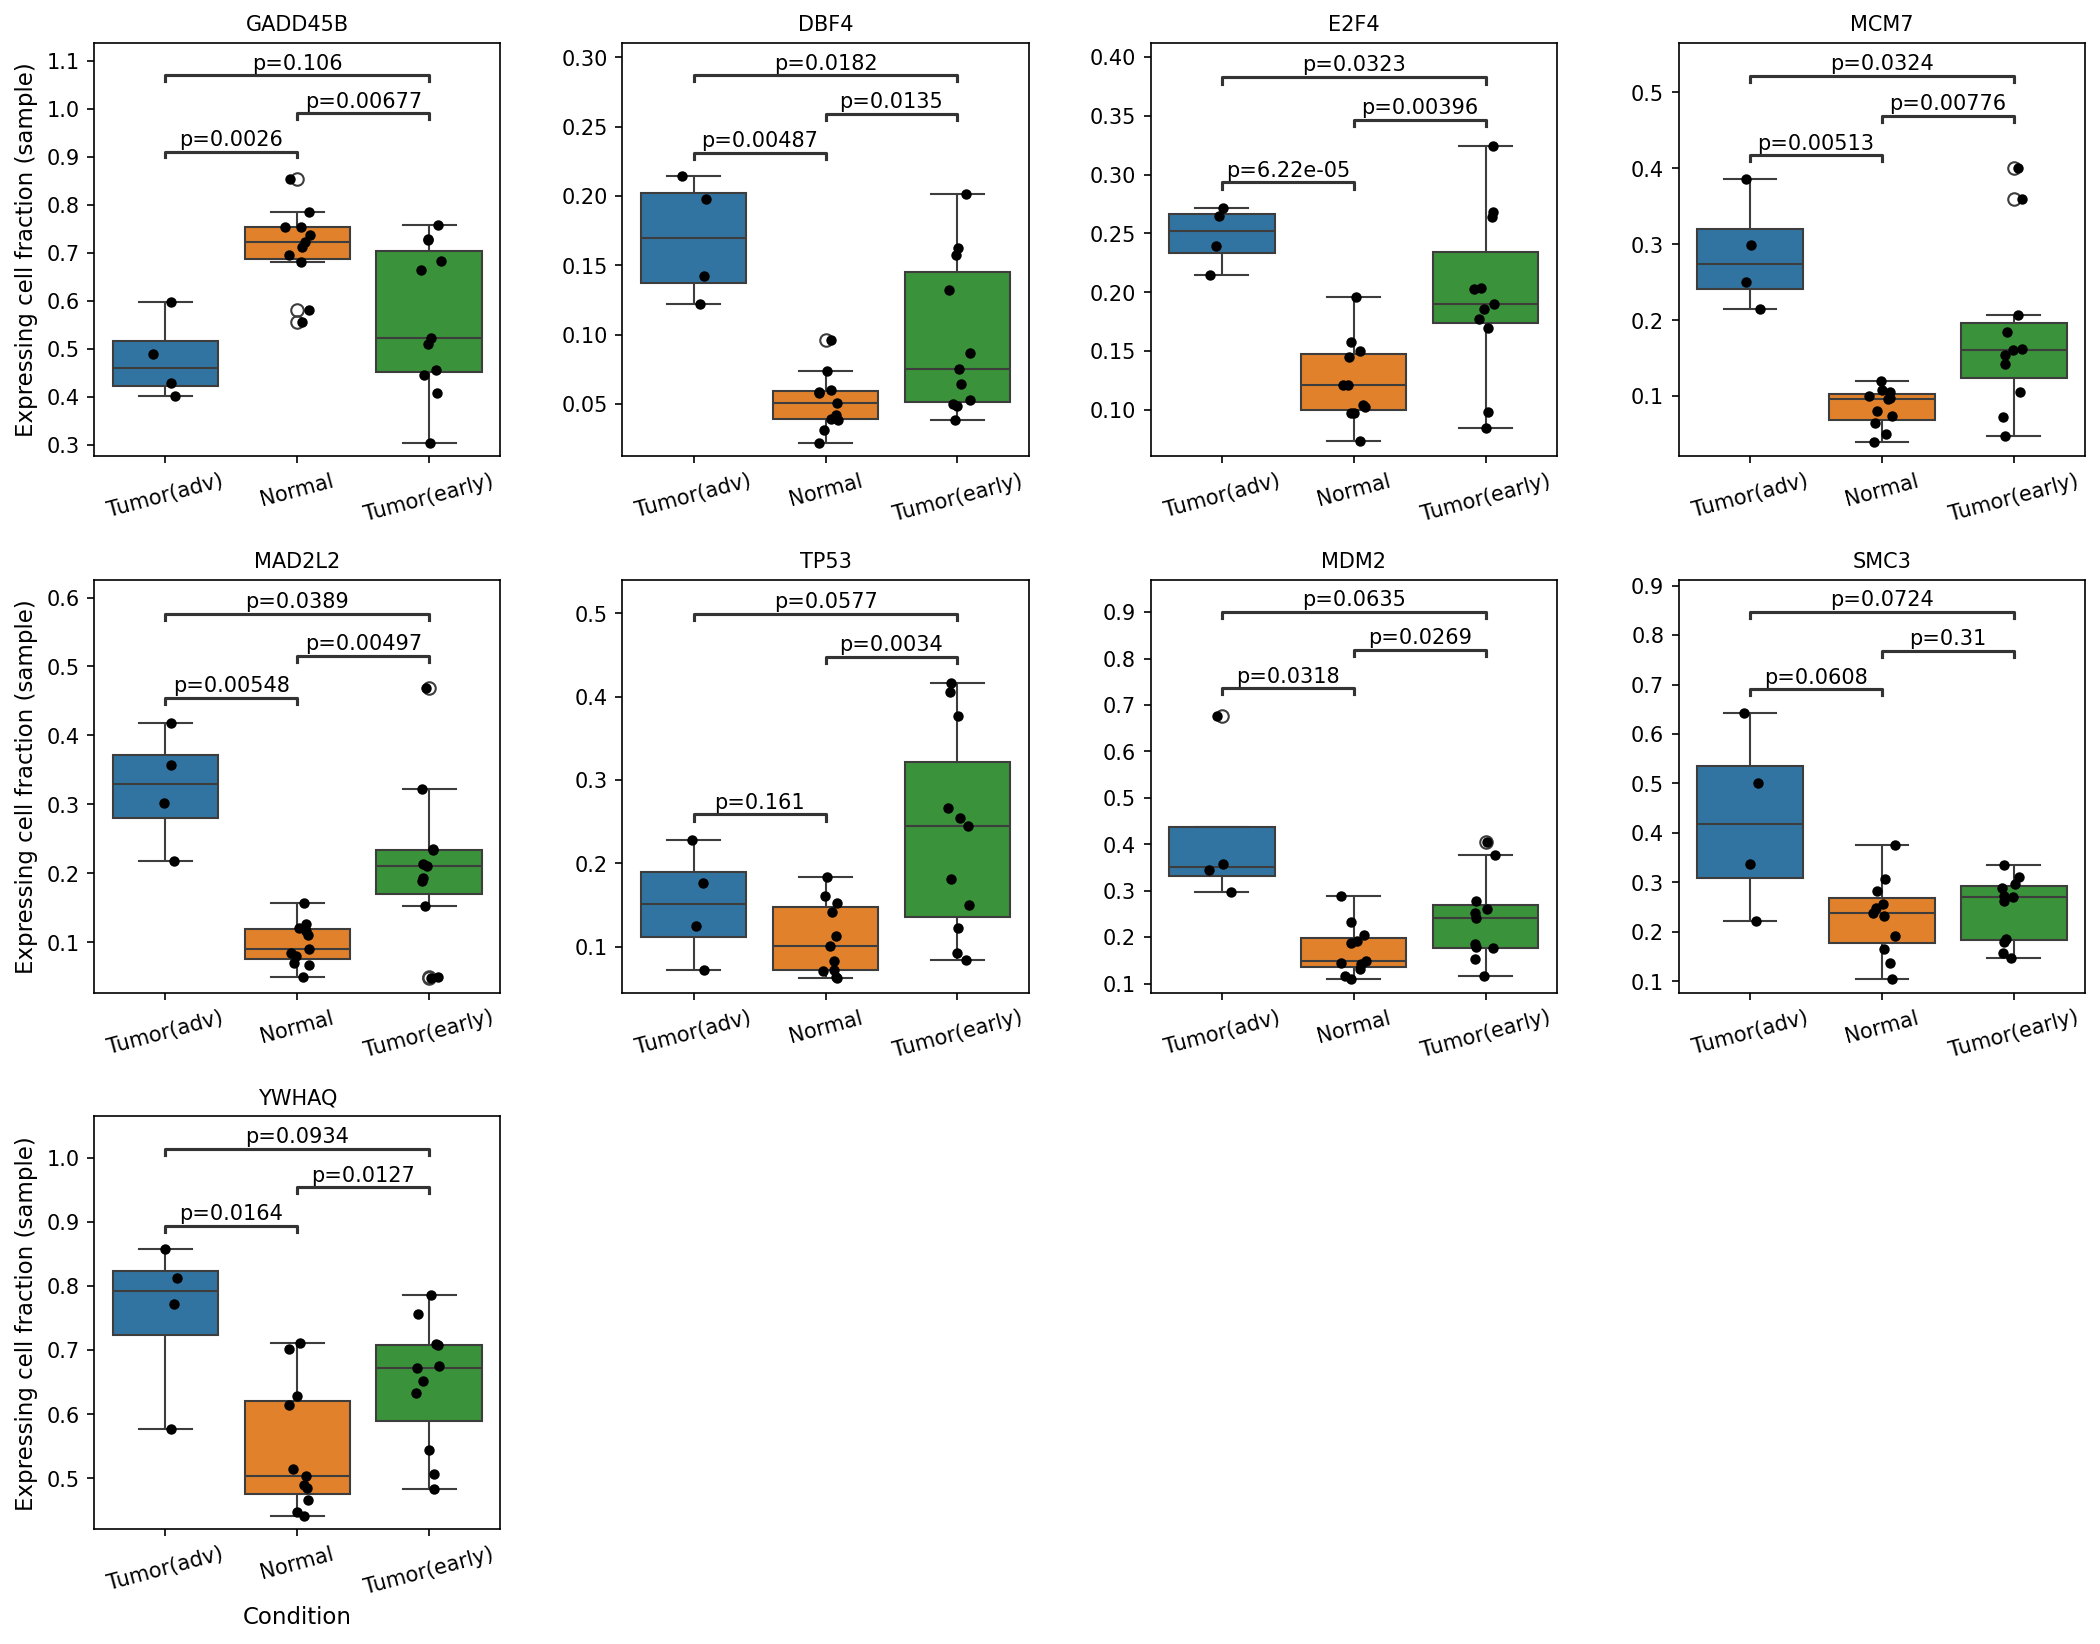
[Analysis Visualization Results]...
Analysis Overview
This analysis investigates the expression patterns of a comprehensive panel of cell cycle pathway genes within Lung Epithelial cells, comparing normal tissue, early-stage tumors (Tumor(early)), and advanced-stage tumors (Tumor(adv)). The goal is to identify genes with statistically significant expression differences that may indicate cell cycle dysregulation associated with lung cancer initiation and progression. The expression is represented as the "expressing cell fraction (sample)," indicating the proportion of cells within each sample that express the gene.
Visual Summary
The box plots display the distribution of expressing cell fractions for several key cell cycle genes across the three conditions. Key observations include:
- Upregulation in Tumor Conditions: Genes such as DBF4, E2F4, MCM7, MAD2L2, and YWHAQ show a significantly higher fraction of expressing cells in tumor conditions (both Tumor(adv) and/or Tumor(early)) compared to Normal Lung Epithelial cells.
- E2F4 and MCM7 are significantly upregulated in both Tumor(adv) (p=6.22e-05 and p=0.00513, respectively) and Tumor(early) (p=0.00396 and p=0.00776, respectively) compared to Normal.
- DBF4 and MAD2L2 are significantly upregulated in Tumor(adv) compared to Normal (p=0.00487 and p=0.00548, respectively) and also show higher expression in Tumor(early) compared to Normal (p=0.0135 and p=0.00497, respectively).
- YWHAQ is significantly higher in both Tumor(adv) (p=0.0164) and Tumor(early) (p=0.0127) compared to Normal.
- MDM2 shows significantly higher expression in Tumor(adv) (p=0.0318) and Tumor(early) (p=0.0269) compared to Normal.
Differential Expression Between Tumor Stages
- DBF4, E2F4, MCM7, and MAD2L2 exhibit significantly higher expression in Tumor(adv) compared to Tumor(early) (p=0.0182, p=0.0323, p=0.0324, and p=0.0389, respectively), suggesting a further intensification of cell cycle activity as the tumor progresses.
- TP53 shows a significantly higher expressing cell fraction in Tumor(early) compared to Normal (p=0.0034), although its expression in Tumor(adv) is not significantly different from Normal (p=0.161).
- Downregulation in Tumor(adv): GADD45B, a cell cycle inhibitor, shows a significantly *lower* fraction of expressing cells in Tumor(adv) compared to Normal (p=0.0026). Its expression in Tumor(early) is also lower than Normal, but not statistically significant (p=0.00677 compared to normal).
- No Significant Changes: SMC3 does not show statistically significant differences across the conditions.
Biological Interpretation
The observed expression changes in these cell cycle genes in Lung Epithelial cells provide strong evidence of disrupted cell cycle regulation in lung cancer. Lung Epithelial cells are identified as the tumor origin cell type, making these findings highly relevant to the oncogenic process.
- Increased Proliferative Capacity in Tumors: The consistent upregulation of genes like DBF4, E2F4, MCM7, and MAD2L2 in tumor conditions points to an enhanced proliferative state.
- DBF4 (Dbf4 Homolog, Activator Of S Phase Kinase) is a key activator of CDC7 kinase, essential for DNA replication initiation during the S phase [1]. Its upregulation suggests accelerated entry and progression through S phase.
- E2F4 (E2F Transcription Factor 4) is a member of the E2F family, involved in regulating genes required for cell cycle progression and DNA synthesis [2]. Its elevation further supports a pro-proliferative environment.
- MCM7 (Minichromosome Maintenance Complex Component 7) is part of the MCM complex, which functions as the eukaryotic DNA helicase essential for DNA replication initiation and elongation [3]. High MCM7 expression is a well-known marker of proliferation and is often associated with cancer [4].
- MAD2L2 (MAD2 Mitotic Arrest Deficient-like 2) plays a role in the spindle assembly checkpoint, ensuring proper chromosome segregation [5]. Its upregulation could reflect increased mitotic activity and potentially errors in checkpoint control in highly proliferating tumor cells.
- YWHAQ (Tyrosine 3-Monooxygenase/Tryptophan 5-Monooxygenase Activation Protein Theta) is a 14-3-3 protein involved in various cellular processes including cell cycle control, often promoting cell survival and proliferation in cancer [6].
- Loss of Cell Cycle Checkpoint Control: The downregulation of GADD45B in advanced tumors is particularly concerning. GADD45B (Growth Arrest And DNA Damage Inducible Beta) is a stress-response gene involved in DNA repair, cell cycle arrest, and apoptosis [7]. Its decreased expression suggests a compromised ability of advanced tumor cells to undergo cell cycle arrest or apoptosis in response to DNA damage, thereby facilitating uncontrolled proliferation and accumulation of genetic mutations, which can lead to aneuploidy (consistent with ploidy_dec indicating Aneuploid cells).
- TP53 and MDM2 Dynamics: The higher expression of TP53 in early tumors compared to normal could represent an active stress response in initial stages of transformation, where p53 attempts to induce cell cycle arrest or apoptosis. However, its expression level is not significantly maintained in advanced tumors, possibly indicating selection for cells with inactivating mutations in TP53 or compensatory pathways that bypass p53 function.
- MDM2 (MDM2 Proto-Oncogene, E3 Ubiquitin Protein Ligase) is a major negative regulator of TP53, often overexpressed in cancers, leading to p53 degradation and inactivation [8]. The upregulation of MDM2 in both tumor stages aligns with its role in promoting tumor growth, potentially by inhibiting any functional p53.
- Progression-Related Dysregulation: The further significant upregulation of DBF4, E2F4, MCM7, and MAD2L2 in advanced tumors compared to early tumors suggests that cell cycle dysregulation becomes more pronounced as the disease progresses, likely contributing to the aggressive growth and metastatic potential characteristic of advanced lung cancer.
Clinical or Translational Implications
These findings highlight several cell cycle genes as potential diagnostic, prognostic, and therapeutic targets in lung cancer.
- Biomarkers for Diagnosis and Prognosis: The consistent upregulation of proliferation markers like MCM7, E2F4, DBF4, and MAD2L2 in tumor cells suggests their potential as biomarkers for detecting lung cancer, monitoring disease progression, or predicting patient outcomes. High expression of these genes could indicate more aggressive disease.
- For example, MCM7 expression is widely used as a proliferation marker in various cancers, including lung cancer, and is associated with poor prognosis [4, 9].
- Therapeutic Targets: The dysregulated cell cycle machinery represents a vulnerability that can be exploited for therapeutic intervention. Targeting key regulatory components like DBF4, E2F4, or the MCM complex could inhibit tumor cell proliferation.
- Inhibitors of CDC7 (activated by DBF4) or E2F transcription factors are under investigation as anticancer agents [10, 11].
- Restoring the function of GADD45B or enhancing its expression could reactivate tumor suppressive mechanisms, such as cell cycle arrest and apoptosis, especially in advanced tumors where its expression is significantly reduced.
- Understanding Tumor Heterogeneity and Evolution: The observed differences between early and advanced tumor stages provide insights into the evolutionary landscape of lung cancer. The shift in expression of genes like TP53 and the increased dysregulation of cell cycle drivers in advanced tumors could inform stage-specific therapeutic strategies. The ploidy inference data (Aneuploid vs. Diploid) in the obs['ploidy_dec'] further supports the notion of significant genomic instability resulting from these cell cycle defects.
---
References:
[1] GeneCards: DBF4. https://www.genecards.org/cgi-bin/carddisp.pl?gene=DBF4
[2] GeneCards: E2F4. https://www.genecards.org/cgi-bin/carddisp.pl?gene=E2F4
[3] GeneCards: MCM7. https://www.genecards.org/cgi-bin/carddisp.pl?gene=MCM7
[4] PubMed Search: "MCM7 cancer prognosis lung". https://pubmed.ncbi.nlm.nih.gov/?term=MCM7+cancer+prognosis+lung
[5] GeneCards: MAD2L2. https://www.genecards.org/cgi-bin/carddisp.pl?gene=MAD2L2
[6] PubMed Search: "YWHAQ cancer cell cycle". https://pubmed.ncbi.nlm.nih.gov/?term=YWHAQ+cancer+cell+cycle
[7] GeneCards: GADD45B. https://www.genecards.org/cgi-bin/carddisp.pl?gene=GADD45B
[8] GeneCards: MDM2. https://www.genecards.org/cgi-bin/carddisp.pl?gene=MDM2
[9] PubMed Search: "MCM7 lung cancer biomarker". https://pubmed.ncbi.nlm.nih.gov/?term=MCM7+lung+cancer+biomarker
[10] PubMed Search: "CDC7 inhibitor cancer therapy". https://pubmed.ncbi.nlm.nih.gov/?term=CDC7+inhibitor+cancer+therapy
[11] PubMed Search: "E2F inhibitor cancer therapy". https://pubmed.ncbi.nlm.nih.gov/?term=E2F+inhibitor+cancer+therapy
20. Lung Epithelial Cell Gene Ontology (GSA) Analysis: Condition-Specific Pathway Enrichment
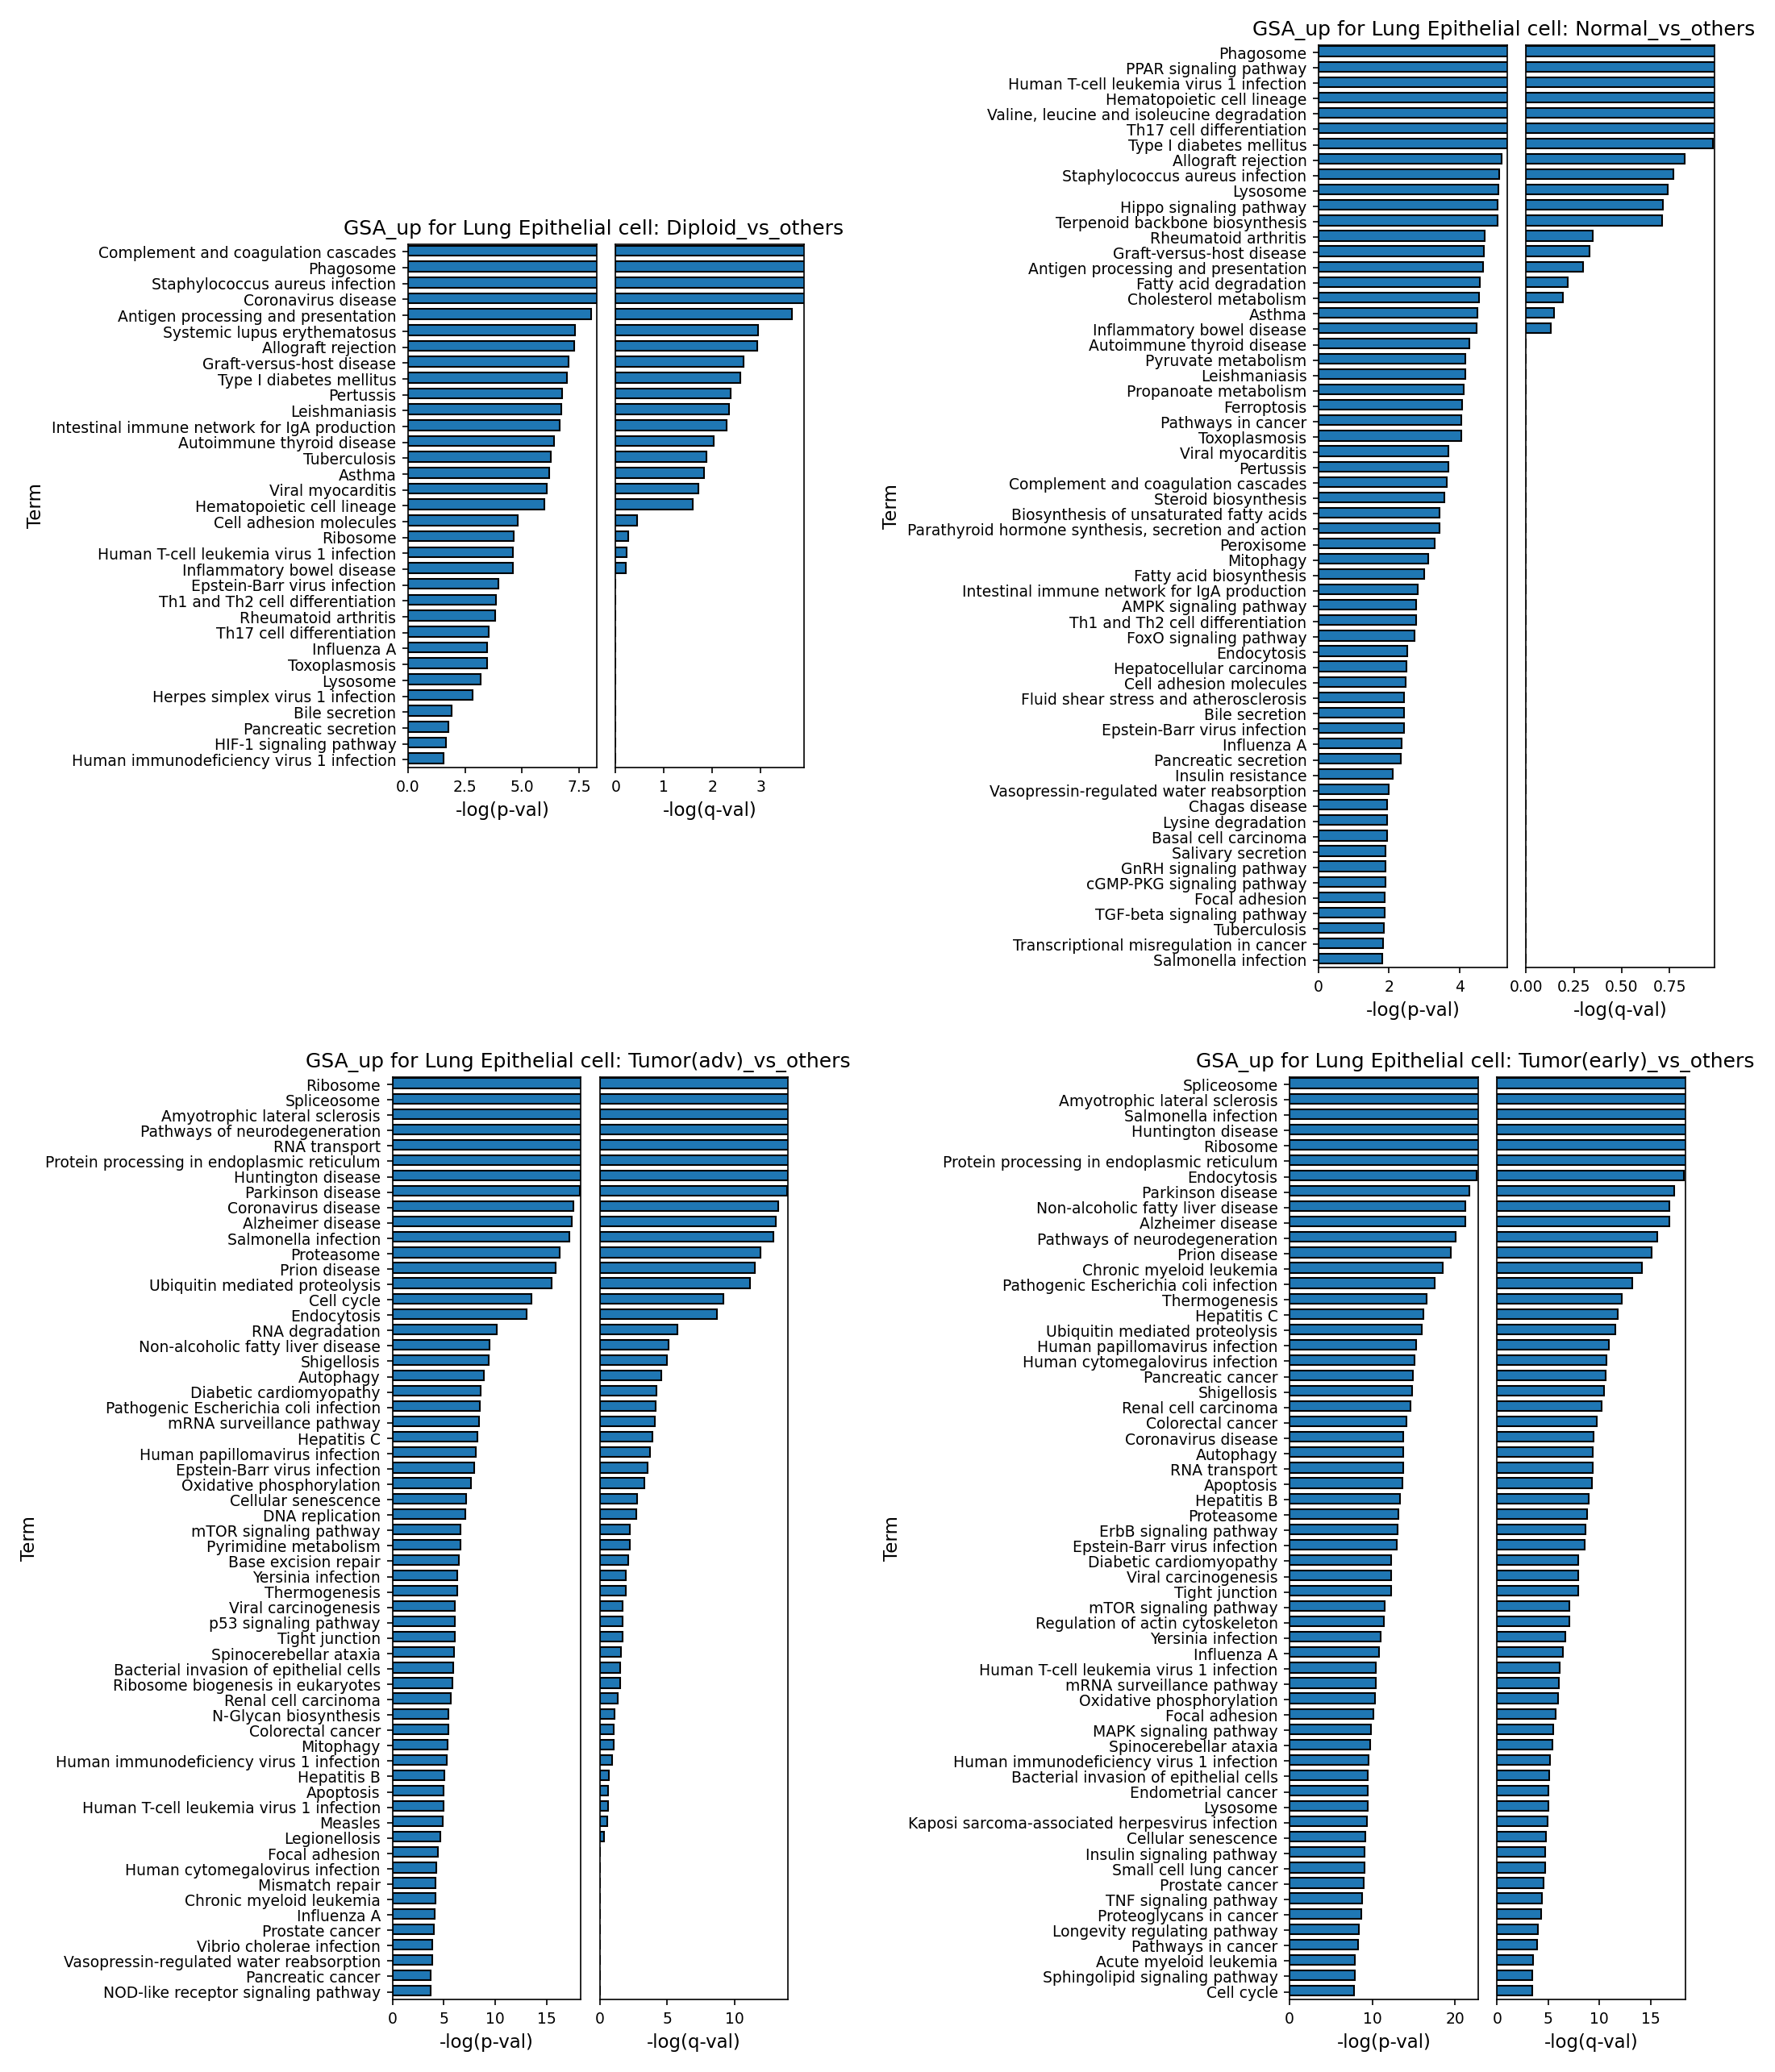
[Analysis Visualization Results]...
Analysis Overview
This analysis utilizes Gene Ontology (GSA) to identify biological processes and pathways significantly enriched in Lung Epithelial cells under different conditions: "Diploid", "Normal", "Tumor(adv)" (advanced tumor), and "Tumor(early)" (early tumor), each compared against "others" (all other conditions combined). The results are presented as bar plots showing the top enriched terms, ranked by their statistical significance (-log(p-val) and -log(q-val)). This helps elucidate the unique functional characteristics and shifts in biological activity of lung epithelial cells across varying physiological and pathological states.
Visual Summary
The provided bar plots illustrate condition-specific enrichment of Gene Ontology terms. Each plot displays terms on the y-axis, ranked by their -log(p-val) on the left panel and -log(q-val) on the right panel. Longer bars indicate higher statistical significance.
- GSA_up for Lung Epithelial cell: Diploid_vs_others: Shows enrichment predominantly in immune-related pathways, including complement and coagulation cascades, phagosome formation, antigen processing, and responses to bacterial and viral infections (e.g., *Staphylococcus aureus*, *Coronavirus*).
- GSA_up for Lung Epithelial cell: Normal_vs_others: Exhibits a similar immune-centric profile to diploid cells, with prominent terms like phagosome, *Human T-cell leukemia virus 1 infection*, and antigen processing. Notably, metabolic pathways such as PPAR signaling and valine/leucine/isoleucine degradation also appear.
- GSA_up for Lung Epithelial cell: Tumor(adv)_vs_others: Reveals a significant shift towards pathways involved in RNA processing (spliceosome, RNA transport), protein processing (ER, proteasome, ubiquitin-mediated proteolysis), and cell cycle regulation. Several terms related to neurodegeneration (e.g., *Amyotrophic lateral sclerosis*, *Huntington disease*, *Parkinson disease*) are highly enriched, suggesting cellular stress and protein homeostasis dysregulation.
- GSA_up for Lung Epithelial cell: Tumor(early)_vs_others: Presents a similar pattern to advanced tumors, with strong enrichment in spliceosome, ribosome, protein processing, and neurodegeneration-related pathways. Metabolic shifts like non-alcoholic fatty liver disease and thermogenesis are also noted.
Biological Interpretation
The GSA results highlight distinct functional states of Lung Epithelial cells across different conditions:
- Normal and Diploid Lung Epithelial Cells: Immune Surveillance and Metabolic Homeostasis
In both normal and diploid lung epithelial cells, there is a strong enrichment for pathways involved in innate immunity, such as the complement system, phagosome formation, and antigen processing and presentation. This reflects the crucial role of lung epithelial cells as a first line of defense against pathogens and environmental insults PubMed Search: Lung epithelial immune function. The presence of the PPAR signaling pathway in normal cells indicates active lipid metabolism and inflammation regulation, essential for maintaining tissue homeostasis GeneCards: PPARG. The immune-related terms suggest a constant state of preparedness and active interaction with the immune microenvironment.
- Tumor (Early and Advanced) Lung Epithelial Cells: Deregulated Proliferation, Protein Homeostasis, and Cellular Stress
A dramatic shift in pathway enrichment is observed in both early and advanced tumor lung epithelial cells. Key features include:
- Accelerated RNA and Protein Metabolism: Pathways like "Spliceosome", "Ribosome", "RNA transport", and "Protein processing in endoplasmic reticulum" are highly enriched. This signifies an upregulation of fundamental cellular machinery required for rapid cell growth, proliferation, and synthesis of new proteins, characteristic of actively dividing cancer cells PubMed Search: Protein synthesis cancer.
- Dysregulated Protein Degradation: "Ubiquitin mediated proteolysis" and "Proteasome" pathways are highly active. While essential for normal cell function, their dysregulation in cancer can promote oncogenic signaling by clearing tumor suppressors or stabilizing oncoproteins GeneCards: PSMB5.
- Cell Cycle Progression: "Cell cycle" is explicitly enriched in advanced tumor cells, directly reflecting uncontrolled proliferation, a hallmark of cancer.
- Cellular Stress and Protein Homeostasis Perturbation: The recurrent enrichment of "Pathways of neurodegeneration" and specific neurodegenerative diseases (e.g., *Amyotrophic lateral sclerosis*, *Huntington disease*, *Parkinson disease*, *Alzheimer disease*) in both early and advanced tumor states is noteworthy. While lung epithelial cells do not develop neurological diseases, these pathways often implicate mechanisms of protein misfolding, aggregation, and impaired proteostasis (protein quality control). Cancer cells, due to their high metabolic rates and altered protein synthesis, often experience significant endoplasmic reticulum stress and depend on robust stress response pathways. The activation of these neurodegeneration-related pathways likely reflects a generalized cellular stress response and a compromised protein quality control system that cancer cells must adapt to or exploit for survival PubMed Search: ER stress cancer.
- Metabolic Reprogramming: "Non-alcoholic fatty liver disease" and "Thermogenesis" in early tumors suggest early shifts in lipid and energy metabolism, which are critical for supporting tumor growth.
- Infection Responses: The presence of various infection-related terms (e.g., *Salmonella infection*, *Pathogenic Escherichia coli infection*, *Hepatitis B*, *Human papillomavirus infection*, *Epstein-Barr virus infection*) might reflect either an altered immune surveillance in the tumor microenvironment or a generalized stress response to microbial stimuli.
- Progression Insights: The observed functional shifts are largely consistent between early and advanced tumor stages, indicating that the fundamental reprogramming of protein synthesis, degradation, and cellular stress responses are established early in tumorigenesis and persist or intensify as the disease progresses. Advanced tumors show a more pronounced cell cycle activity, reflecting uncontrolled growth.
Clinical or Translational Implications
The distinctive pathway enrichments in tumor versus normal lung epithelial cells offer several clinical and translational insights:
- Therapeutic Targets: The consistent upregulation of RNA processing (spliceosome) and protein degradation (proteasome, ubiquitin-mediated proteolysis) pathways in both early and advanced tumors suggests these are crucial for tumor cell survival and could be promising therapeutic targets. Inhibitors targeting the proteasome are already approved for certain cancers, and spliceosome modulators are under investigation PubMed Search: Proteasome inhibitors cancer.
- Biomarker Discovery: Genes within these consistently enriched pathways in tumor cells could serve as diagnostic or prognostic biomarkers for lung cancer progression.
- Understanding Tumor Biology: The enrichment of "neurodegeneration" pathways, interpreted as cellular stress and protein quality control dysregulation, highlights a potential vulnerability in cancer cells. Targeting these stress response pathways could selectively induce apoptosis in tumor cells that are already under high proteotoxic stress.
- Metabolic Intervention: The early shifts in lipid metabolism and thermogenesis in early tumors suggest that metabolic interventions could be explored as adjunctive therapies or for early-stage disease management.
21. Gene Set Enrichment Analysis (GSEA) Across Cell Types and Conditions in Lung Tissue
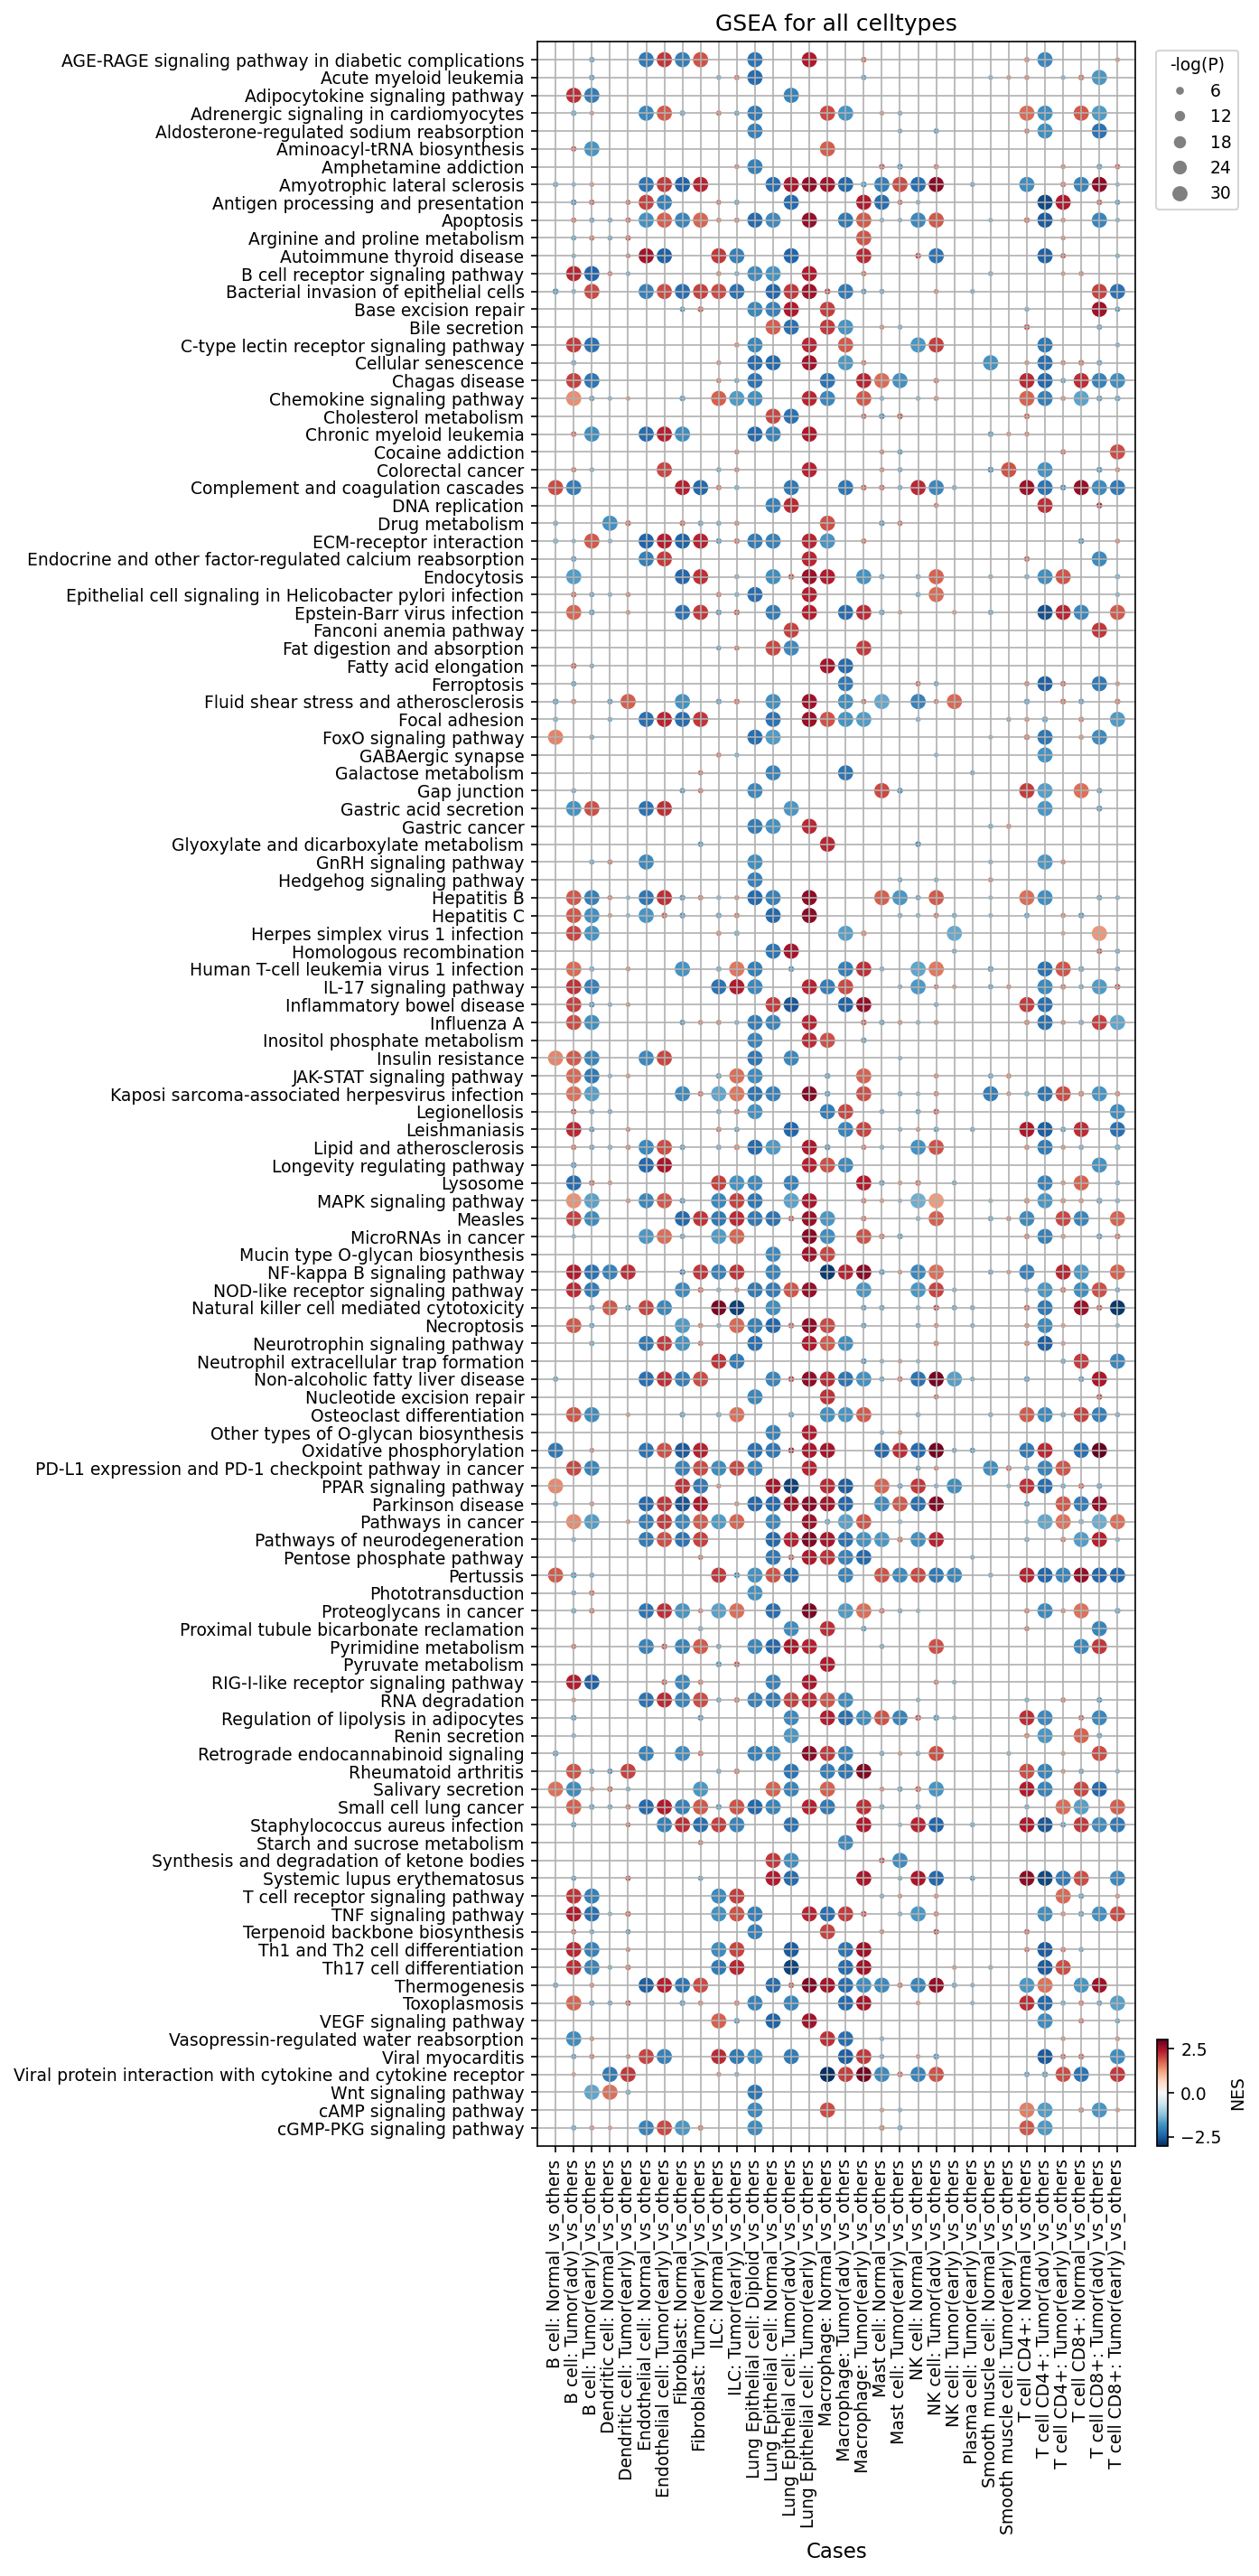
[Analysis Visualization Results]...
Analysis Overview
This analysis presents Gene Set Enrichment Analysis (GSEA) results visualized as a dot plot. The plot displays the enrichment or depletion of 120 selected gene sets (pathways) across various cell type-condition combinations (Cases). Each Case compares a specific cell type within a given condition (e.g., 'Tumor(adv)') against all other cells of the same cell type from other conditions (_vs_others).
The color of each dot indicates the Normalized Enrichment Score (NES), where red signifies upregulation (positive NES) and blue signifies downregulation (negative NES) of the pathway in the test condition relative to the 'others' group. The size of the dot represents the statistical significance, with larger dots corresponding to more significant enrichment/depletion (higher -log(P) value).
Visual Summary
The dot plot reveals a complex landscape of pathway alterations across different cell types and disease conditions (Normal, Tumor(early), Tumor(adv)). Key visual patterns include:
- Differential Pathway Activity: A clear distinction in pathway enrichment patterns is observed between normal and tumor conditions for many cell types. Tumor conditions, particularly 'Tumor(adv)', generally exhibit a higher frequency of significantly enriched or depleted pathways compared to 'Normal' conditions.
- Cell Type Specificity: Pathway alterations are highly cell-type specific. For instance, Lung Epithelial cells (the tumor origin) show distinct patterns compared to immune cells (T cells, Macrophages) or stromal cells (Fibroblasts, Endothelial cells).
- Tumor Progression Trends: While Tumor(early)_vs_others and Tumor(adv)_vs_others often share similar directional changes, the magnitude and significance (dot size/color intensity) frequently increase from early to advanced tumor stages, suggesting progression-dependent biological shifts.
- Ploidy-Associated Differences: Within Lung Epithelial cells, Aneuploid_vs_others and Diploid_vs_others groups display divergent pathway activities, highlighting the impact of genomic instability on cellular processes. Aneuploid cells generally show more pronounced cancer-associated pathway enrichments.
- Dominant Signals: Prominent red dots (upregulation) are frequently observed for pathways related to cancer, inflammation, and extracellular matrix remodeling in tumor conditions, especially within tumor epithelial cells, fibroblasts, and macrophages. Conversely, pathways related to oxidative phosphorylation are often downregulated in tumor epithelial cells.
Biological Interpretation
The GSEA results provide valuable insights into the biological processes driving lung tumorigenesis and shaping the tumor microenvironment:
Lung Epithelial Cell Transformation and Malignancy:
- Lung Epithelial cell: Tumor(adv)_vs_others shows strong upregulation of "Pathways in cancer" [GeneCards: Pathways in cancer], "MicroRNAs in cancer", "Wnt signaling pathway" [PubMed: Wnt signaling cancer], "Hedgehog signaling pathway" [PubMed: Hedgehog signaling cancer], "VEGF signaling pathway" [GeneCards: VEGF], and "PPAR signaling pathway" [PubMed: PPARs in cancer]. These indicate active oncogenic processes, promoting cell proliferation, survival, and differentiation characteristic of cancer.
- A significant downregulation of "Oxidative phosphorylation" [GeneCards: Oxidative phosphorylation] is observed, suggesting a metabolic shift towards aerobic glycolysis (the Warburg effect), a hallmark of cancer metabolism.
- Upregulation of "ECM-receptor interaction" and "Focal adhesion" implies increased cell-matrix communication and potential for invasion and metastasis.
- Aneuploid Lung Epithelial cells consistently show stronger enrichment for many cancer-related pathways compared to Diploid cells, underscoring the role of genomic instability in aggressive tumor phenotypes.
Remodeling of the Tumor Microenvironment:
- Fibroblasts: In tumor conditions, especially Tumor(adv)_vs_others, fibroblasts exhibit striking upregulation of "ECM-receptor interaction" [GeneCards: ECM-receptor interaction], "Focal adhesion", "VEGF signaling pathway", "Wnt signaling pathway", and "Hedgehog signaling pathway". This robustly points to their transformation into Cancer-Associated Fibroblasts (CAFs), which are crucial for ECM remodeling, angiogenesis, and providing pro-tumorigenic signals.
- Endothelial Cells: Endothelial cell: Tumor(adv)_vs_others shows enriched "VEGF signaling pathway" [GeneCards: VEGF], "ECM-receptor interaction", "Focal adhesion", and "Adherens junction", indicating active angiogenesis, vascular remodeling, and integrity changes vital for tumor blood supply and metastasis.
Immune Cell Dysregulation and Activation:
- Macrophages: Macrophage: Tumor(adv)_vs_others presents upregulation of inflammatory pathways such as "Chemokine signaling pathway" [GeneCards: Chemokine signaling], "NF-kappa B signaling pathway" [GeneCards: NF-kappa B signaling], "TNF signaling pathway" [GeneCards: TNF signaling pathway], and "Apoptosis". This suggests an activated macrophage phenotype, potentially pro-tumorigenic (M2-like) or involved in chronic inflammation within the tumor.
- T cells (CD4+ and CD8+): Both T cell CD4+: Tumor(adv)_vs_others and T cell CD8+: Tumor(adv)_vs_others show upregulation of "T cell receptor signaling pathway" [GeneCards: T cell receptor] and T helper cell differentiation pathways (e.g., "Th1 and Th2 cell differentiation", "Th17 cell differentiation"). This indicates active immune responses. However, the presence of signals in "PD-L1 expression and PD-1 checkpoint pathway in cancer" (mixed red/blue dots, but some significant activation) suggests ongoing immune evasion mechanisms or T cell exhaustion in the advanced tumor microenvironment.
- Dendritic Cells: Dendritic cell: Tumor(adv)_vs_others shows enriched "Antigen processing and presentation" [GeneCards: Antigen processing and presentation], "Chemokine signaling pathway", and "NF-kappa B signaling pathway", suggesting an active role in antigen presentation and immune modulation, which can be either pro- or anti-tumorigenic depending on the context.
Clinical or Translational Implications
The comprehensive GSEA across cell types provides a valuable resource for identifying potential therapeutic targets and understanding lung cancer progression:
- Targeting Oncogenic Pathways: The prominent upregulation of "Wnt", "Hedgehog", "VEGF", and "PPAR" signaling in tumor epithelial cells and supporting stromal cells suggests that inhibitors targeting these pathways could be effective in lung cancer treatment.
- Modulating the Tumor Microenvironment: Interventions aimed at reprogramming CAFs (e.g., targeting ECM-receptor interactions or growth factor pathways in fibroblasts) or re-educating tumor-associated macrophages (e.g., by influencing "NF-kappa B" or "TNF" signaling) could reduce tumor growth and metastasis. Anti-angiogenic therapies targeting the "VEGF signaling pathway" in endothelial cells remain relevant.
- Enhancing Immunotherapy: The observed activity in the "PD-L1 expression and PD-1 checkpoint pathway" in T cells and dendritic cells underscores the continued relevance of immune checkpoint inhibitors. Further analysis into the precise state of T cell activation and exhaustion could help optimize immunotherapy strategies.
- Metabolic Interventions: The strong downregulation of "Oxidative phosphorylation" in tumor epithelial cells highlights the glycolytic phenotype of lung cancer cells, opening possibilities for metabolism-focused therapies that target this metabolic vulnerability.
- Biomarker Discovery: The distinct pathway enrichments in early versus advanced tumor stages, as well as between diploid and aneuploid epithelial cells, could yield novel biomarkers for disease progression, prognosis, or prediction of therapeutic response. For instance, specific pathway signatures in aneuploid epithelial cells might indicate a more aggressive disease subset.
22. Discussion
This comprehensive single-cell analysis provides a high-resolution view of lung cancer progression, revealing a complex interplay between malignant epithelial cells and their dynamic microenvironment. A central and defining feature of the tumor-origin Lung Epithelial cells is widespread genomic instability, evidenced by prominent aneuploidy in both early and advanced tumor stages (Section 11) and recurrent copy number amplifications of oncogenes such as EGFR and ERBB2 (HER2) (Section 4). This genomic dysregulation is a hallmark of malignancy and intensifies with disease progression, driving uncontrolled cell cycle activity as indicated by the upregulation of proliferation markers (e.g., MCM7, E2F4, DBF4) and the downregulation of cell cycle inhibitors (e.g., GADD45B) in tumor epithelial cells (Section 19). Furthermore, GSEA and GSA analyses confirm that tumor epithelial cells exhibit significantly enriched pathways related to RNA and protein processing, ribosome function, and cell cycle, alongside a downregulation of oxidative phosphorylation and activation of stress-response pathways (Sections 20, 21), collectively reflecting high proliferative demand and metabolic reprogramming.
The tumor microenvironment undergoes profound remodeling. We observe a significant increase in the proportion of malignant Alveolar Epithelial cells, which correlates with increasing aneuploidy (Sections 6, 11). Concurrently, the immune landscape shifts from robust surveillance in normal tissue to an immunosuppressive state in tumors. Specifically, anti-tumor NK cells are significantly reduced in both early and advanced tumor stages, with a progressive decline (Sections 7, 8). While early tumors show an initial upregulation of various T helper subsets (Tfh, Th22, Th17, Th2, Th1), the presence of immunosuppressive regulatory T cells (Treg) is significantly increased in early tumors (Section 8). The macrophage compartment demonstrates a clear shift from an M1/M2A-dominant profile in normal tissue to a progressively M2B-dominant phenotype in early and advanced tumors (Sections 9, 10), underscoring their active role in fostering a pro-tumorigenic environment.
Cell-cell interaction analysis further elucidates these pathological communication networks. Malignant (aneuploid) Lung Epithelial cells emerge as central hubs, engaging in extensive cross-talk with immune and stromal cells (Section 12). Key pro-tumorigenic interactions include intensified EGFR signaling (autocrine and paracrine, involving AREG, HBEGF, EREG, BTC) (Section 13), significantly upregulated TGF-beta signaling (especially via TGFB1-integrin_avb6_complex between macrophages and tumor cells) (Section 13), and the 'don't eat me' signal involving CD47-SIRPB1.complex, facilitating immune evasion (Section 12). Stromal cells, particularly fibroblasts, are actively reprogrammed into cancer-associated fibroblasts (CAFs), characterized by surface markers like FAP, MMP14, and PDGFRB (Section 17). These CAFs, along with endothelial cells, drive extensive extracellular matrix remodeling (COL-integrin interactions) and angiogenesis (VEGFA/PGF-NRP1/2 interactions) (Section 14).
Condition-specific surfaceome analysis further delineates these cellular phenotypes. Malignant Lung Epithelial cells lose normal markers (CLDN18, ABCA3) and gain oncogenic receptors (EGFR, ERBB2, MET) and immune evasive molecules (CD276/B7-H3) (Section 15). Tumor-associated macrophages upregulate markers like CXCR4, FOLR2, and ACVRL1 (Section 16). CD4+ T cells in tumors show increased expression of inhibitory immune checkpoints (TIGIT, CTLA4) and co-stimulatory molecules (ICOS, TNFRSF18, TNFRSF4), indicative of an activated but potentially exhausted or regulatory phenotype (Section 18). These detailed molecular signatures provide concrete evidence for the observed functional shifts in the tumor microenvironment.
Hypotheses:
- The observed aneuploidy and recurrent oncogene amplifications in lung epithelial cells directly drive their uncontrolled proliferation and metabolic reprogramming, facilitating tumor growth.
- The shift in immune cell composition (reduced NK/cytotoxic T cells, increased Treg/M2B macrophages) and altered cell-cell interactions (CD47-SIRPα, TGF-β, CXCL12-CXCR4) collectively establish an immunosuppressive and immune-evasive microenvironment that promotes lung cancer progression.
- Tumor-associated fibroblasts and endothelial cells, identified by their distinct surface markers and active remodeling/angiogenic pathways (e.g., FAP, MMP14, VEGFA-NRP), actively support tumor growth and metastasis.
- The dysregulated cell cycle genes (MCM7, E2F4, DBF4) and oncogenic surface receptors (EGFR, ERBB2, MET) in malignant lung epithelial cells represent critical therapeutic vulnerabilities that can be targeted to inhibit tumor proliferation.
Potential therapeutic targets:
- EGFR: Highly amplified in tumor-origin Lung Epithelial cells, significant autocrine/paracrine signaling, and prominent surface expression, driving proliferation. Evidence: CNV amplification (7p11.23, Image 5), strong AREG_EGFR, HBEGF_EGFR, EREG_EGFR, BTC_EGFR interactions (Image 17, 18), upregulated surface expression (Image 20), GSEA showing 'Pathways in cancer' enrichment (Image 29). Validation: In vitro: EGFR inhibitor sensitivity assays on primary tumor epithelial cells. In vivo: Test EGFR TKIs in PDX models with EGFR amplification. Clinical: Correlate EGFR amplification/expression with TKI response in lung cancer patients.
- TGF-beta signaling pathway: Markedly upregulated, highly immunosuppressive, promotes fibrosis, and involves crucial interactions between macrophages and aneuploid lung epithelial cells. Evidence: Strong TGFB1_TGFBR1, TGFB1_TGFBR2, TGFB1_integrin_avb6_complex interactions in tumor (Image 17, 18). Validation: In vitro: Use TGF-beta inhibitors in co-culture models to assess effects on immune suppression, EMT, and fibroblast activation. In vivo: Test TGF-beta inhibitors (e.g., Fresolimumab, Galunisertib) in lung cancer models, potentially in combination with immunotherapies.
- CD47: 'Don't eat me' signal highly active from Aneuploid Lung Epithelial cells to phagocytes, enabling immune evasion. Evidence: Strong CD47-SIRB1B.complex interactions in tumor conditions involving Aneuploid Lung Epi (Image 13, 14). Validation: In vitro: Test CD47 blocking antibodies on tumor cell lines with macrophages/NK cells to assess phagocytosis/killing. In vivo: Evaluate anti-CD47 antibodies in lung cancer models, especially in combination with checkpoint inhibitors.
- FAP (Fibroblast Activation Protein): Highly specific and robust surface marker for activated cancer-associated fibroblasts (CAFs) in early tumors, critical for ECM remodeling and pro-tumorigenic niche. Evidence: Strong FAP expression on Fibroblasts in early tumor samples (Image 22). Condition-specific CCI patterns highlighting ECM remodeling (COL-integrin) in tumors (Image 19). Validation: In vitro: Test FAP inhibitors or FAP-targeted ADCs on CAFs in co-culture systems to assess effects on proliferation, matrix remodeling, and tumor cell invasion. In vivo: Evaluate FAP-targeted therapies in lung cancer models to deplete or reprogram CAFs and assess tumor growth.
- MCM7: A key component of the minichromosome maintenance complex, essential for DNA replication, significantly upregulated in lung epithelial tumor cells, indicating uncontrolled proliferation. Evidence: Significant upregulation of MCM7 in both early and advanced tumor Lung Epithelial cells (p=0.00776, p=0.00513 vs. Normal), and further increased in advanced vs. early (p=0.0324) (Image 24). GSA/GSEA showing 'Cell cycle' and 'DNA replication' pathways enrichment (Images 20, 21). Validation: In vitro: RNAi-mediated knockdown of MCM7 in lung cancer cell lines to assess proliferation, apoptosis, and cell cycle arrest. In vivo: Test MCM7 inhibitors (if available) or genetic ablation in lung cancer models.
Follow-up validation ideas:
- Perform in vitro functional assays (e.g., co-culture experiments) using isolated Aneuploid Lung Epithelial cells with different immune (T cells, macrophages) and stromal cells (fibroblasts, endothelial cells) to validate specific CCI pathways (e.g., blocking CD47-SIRPα, TGF-β, or EGFR signaling) and assess effects on proliferation, migration, and immune cell function (e.g., phagocytosis, T cell killing).
- Test the therapeutic efficacy of inhibiting identified oncogenes (e.g., EGFR, ERBB2) or key signaling pathways (e.g., TGF-β, CXCL12-CXCR4) or targeting specific cell surface markers (e.g., FAP, CD276) in patient-derived xenograft (PDX) or genetically engineered mouse models (GEMMs) of lung cancer, both as monotherapy and in combination with chemotherapy or immunotherapy.
- Apply spatial analysis techniques (e.g., spatial transcriptomics or multiplexed imaging) to human lung cancer tissue sections to confirm the spatial proximity of interacting cell types and the expression patterns of specific ligand-receptor pairs and surface markers identified (e.g., co-localization of FAP+ fibroblasts with malignant epithelial cells).
- Validate selected diagnostic, prognostic, or predictive biomarkers (e.g., proliferation markers, immune checkpoint expression, macrophage/T cell ratios, CNV patterns) in larger retrospective or prospective patient cohorts using immunohistochemistry (IHC), flow cytometry, or advanced molecular diagnostics on tumor biopsies or liquid biopsies.
- Integrate single-cell RNA-seq with single-cell ATAC-seq or proteomics to understand the epigenetic and proteomic landscape underlying the observed transcriptomic shifts and target expression.
Limitations:
The single-cell RNA-seq data provides a static snapshot of cellular states, meaning dynamic processes such as cell state transitions or clonal evolution are inferred rather than directly observed. Computational inferences for CNV, cell-cell interactions, and ploidy rely on specific algorithms with inherent limitations and assumptions. The findings are specific to human lung tissue and the conditions analyzed, and their generalizability to other cancer types or patients may vary. While distinct markers and pathways are highlighted, some gene expression is shared, and functional redundancy or context-dependent roles of genes need further clarification. The absence of a gene or interaction in the 'top N' lists does not imply its complete absence or irrelevance, but rather that it was not among the most statistically significant or highly expressed under the applied filters. Furthermore, detailed resolution of cell subtypes might still reveal additional rare populations or transitional states. All identified targets and hypotheses require extensive experimental validation to confirm their functional roles and therapeutic efficacy.
23. Query List
- Show and save UMAPs for condition, sample, major cell type, minor cell type, ploidy_dec, and celltype_subset in two columns.
- Show major cell type scores on UMAP and save the result.
- Show and save a marker expression dot plot for celltype_subset. SET target_cell = None and var_group_rotation = 45. Leave all other arguments at their default values.
- Select tumor-origin cells, show a CNV heatmap grouped by sample together with a summary of regions with significantly amplified copy numbers, and save the results.
- Show and save UMAPs of CNV patterns colored by major cell type, minor cell type, ploidy results, condition, and sample in two columns.
- Show and save a population bar plot of minor cell types.
- Show and save a population bar plot of T cell subsets.
- Show and save box plots of T cell subset populations with statistically significant differences between conditions, if any. Choose ncols based on the total number of panels.
- Show and save a population bar plot of macrophage subsets.
- Show and save box plots of macrophage subset populations with statistically significant differences between conditions, if any. Choose ncols based on the total number of panels.
- Select tumor-origin cells, show their ploidy populations as a bar plot, and save the result.
- Show and save cell-cell interaction patterns involving Lung Epithelial cells, Fibroblast, Macrophage, T cell, B cell, Dendritic cell, Endothelial cell, ILC, Mast cell, NK cell, Plasma cell, and Smooth muscle cell. Select at most 80 cell-cell interactions per group.
- Select only genes associated with immune checkpoint and cell cycle pathways, show cell-cell interactions for these genes, and save the result.
- Find cell-cell interactions involving major immune and stromal cells that differ significantly between conditions, show them as a dot plot, and save the result. Set max_n_items_per_group to 60.
- Extract condition-specific markers for Lung Epithelial cell, show their expression as a dot plot, and save the result. Use only surfaceome markers, with at most 50 markers per condition.
- Extract condition-specific markers for Macrophage, show their expression as a dot plot, and save the result. Use only surfaceome markers, with at most 30 markers per condition.
- Extract condition-specific markers for Fibroblast, show their expression as a dot plot, and save the result. Use only surfaceome markers, with at most 30 markers per condition.
- Extract condition-specific markers for T cell CD4+, show their expression as a dot plot, and save the result. Use only surfaceome markers, with at most 30 markers per condition.
- Among cell cycle pathway genes, select those with statistically significant expression differences between conditions in Lung Epithelial cell, show box plots, and save the result. Set max_n_items_to_plot to 24 and choose ncols based on the total number of panels for an overall width-to-height ratio of approximately 2:3.
- Show and save Gene Ontology (GSA) analysis results for Lung Epithelial cell as a bar plot.
- Show Gene Set Enrichment Analysis results as a dot plot, and save it. Set the color map to RdBu_r and n_pws_to_show to 120.