Single-Cell Landscape of Pancreatic Ductal Adenocarcinoma: Genomic Instability, Immune Reprogramming, and Oncogenic Signaling
This single-cell RNA-seq analysis reveals the intricate cellular landscape of Pancreatic Ductal Adenocarcinoma (PDAC) compared to adjacent normal tissue. UMAP analysis distinctly clusters malignant, aneuploid ductal cells that dominate PDAC samples, while marker gene expression validates cell type annotations. The PDAC tumor microenvironment (TME) exhibits significant immune and stromal cell shifts, pronounced genomic instability with recurrent CNVs in tumor cells, and a dense network of condition-specific cell-cell interactions. Gene Ontology and GSEA highlight widespread activation of oncogenic, inflammatory, and metabolic reprogramming pathways across various cell types, underscoring the aggressive nature and complex biology of PDAC.
Contents
- Dataset overview
- UMAP Visualization of Pancreatic Single-Cell RNA-Seq Data by Key Metadata
- Pancreatic Single-Cell UMAP Gene Expression Analysis and Cell Type Annotation Validation
- Celltype_subset Marker Expression Dot Plot Analysis
- CNV Analysis of Ductal and Unassigned Cells in Pancreatic Samples
- CNV-Informed UMAP Analysis of Pancreatic Single-Cell RNA-seq Data
- Minor Cell Type Population Analysis in Pancreatic Tissues
- T-cell Subset Population Analysis in Pancreatic Ductal Adenocarcinoma (PDAC) vs. Adjacent Normal Tissue
- Macrophages Subset Population Analysis in Pancreatic Ductal Adenocarcinoma (PDAC)
- PDAC 조건에서 T 세포 아형 및 관련 림프구 집단의 변화 분석
- Ductal Cell (Tumor-Origin) and Unassigned Cell Ploidy Population Analysis in Pancreatic Tissue
- PDAC 조건에서의 세포-세포 상호작용 패턴 분석
- Condition-Specific Cell-Cell Interaction Patterns in Pancreatic Ductal Adenocarcinoma (PDAC)
- Immune Checkpoint and Cell Cycle Related Cell-Cell Interactions in Pancreatic Tissue
- Condition-Specific Cell-Cell Interaction Patterns in Pancreatic Ductal Adenocarcinoma
- Ductal Cell Condition-Specific Surfaceome Markers in Pancreatic Cancer
- Macrophage Condition-Specific Surfaceome Markers in Pancreatic Cancer
- Condition-Specific Surfaceome Markers in Pancreatic Cancer CD4+ T cells
- Ductal Cell Cycle Genes Show Significant Upregulation in Pancreatic Ductal Adenocarcinoma (PDAC)
- Ductal and Acinar Cell Gene Ontology (GSA) Analysis in Pancreatic Conditions
- Gene Set Enrichment Analysis (GSEA) of Pancreatic Cell Types in PDAC
- Discussion
- Query List
0. Dataset overview
Dataset Summary
- Type: Single-cell RNA-seq data, processed by SCODA.
- Dimensions: Contains 26,871 cells and 23,239 genes.
- Species & Tissue: Human Pancreas.
- Conditions: Includes 'Adj_normal' and 'PDAC' conditions.
- Cell Type Annotations: Available at major, minor, and subset levels, such as 'Myeloid cell', 'Macrophage', 'Macrophage (M2B)', etc.
- Tumor Origin Celltype: 'Ductal cell' is identified as the tumor origin.
- Ploidy Information: Cells are classified as 'Aneuploid' or 'Diploid' in 'ploidy_dec'.
- Reference Condition: 'Adj_normal' is used as the reference for comparative analyses (DEG_vs_ref, GSEA_vs_ref, GSA_vs_ref_up).
Precomputed Results
- Cell-Cell Interaction (CCI): Results from CellPhoneDB are available per condition and per sample.
- Differential Gene Expression (DEG): Results are stored for each 'celltype_minor', comparing one condition against the rest.
- Gene Set Enrichment Analysis (GSEA): Results are available for each 'celltype_minor', comparing one condition against the rest.
- Gene Ontology (GO/GSA): 'GSA_up' results are available for each 'celltype_minor', comparing one condition against the rest.
- Copy Number Variation (CNV): Estimates are stored in obsm['X_cnv'], and ploidy inference is in obs['ploidy_dec'].
Important Cell Types for Analysis
- For DEG, GSEA, and GSA/GO analyses, target cell types can be selected from: Acinar cell, Ductal cell, Endothelial cell, Macrophage, Mast cell, T cell CD4+, T cell CD8+.
1. UMAP Visualization of Pancreatic Single-Cell RNA-Seq Data by Key Metadata
[Analysis Visualization Results]...
Analysis Overview
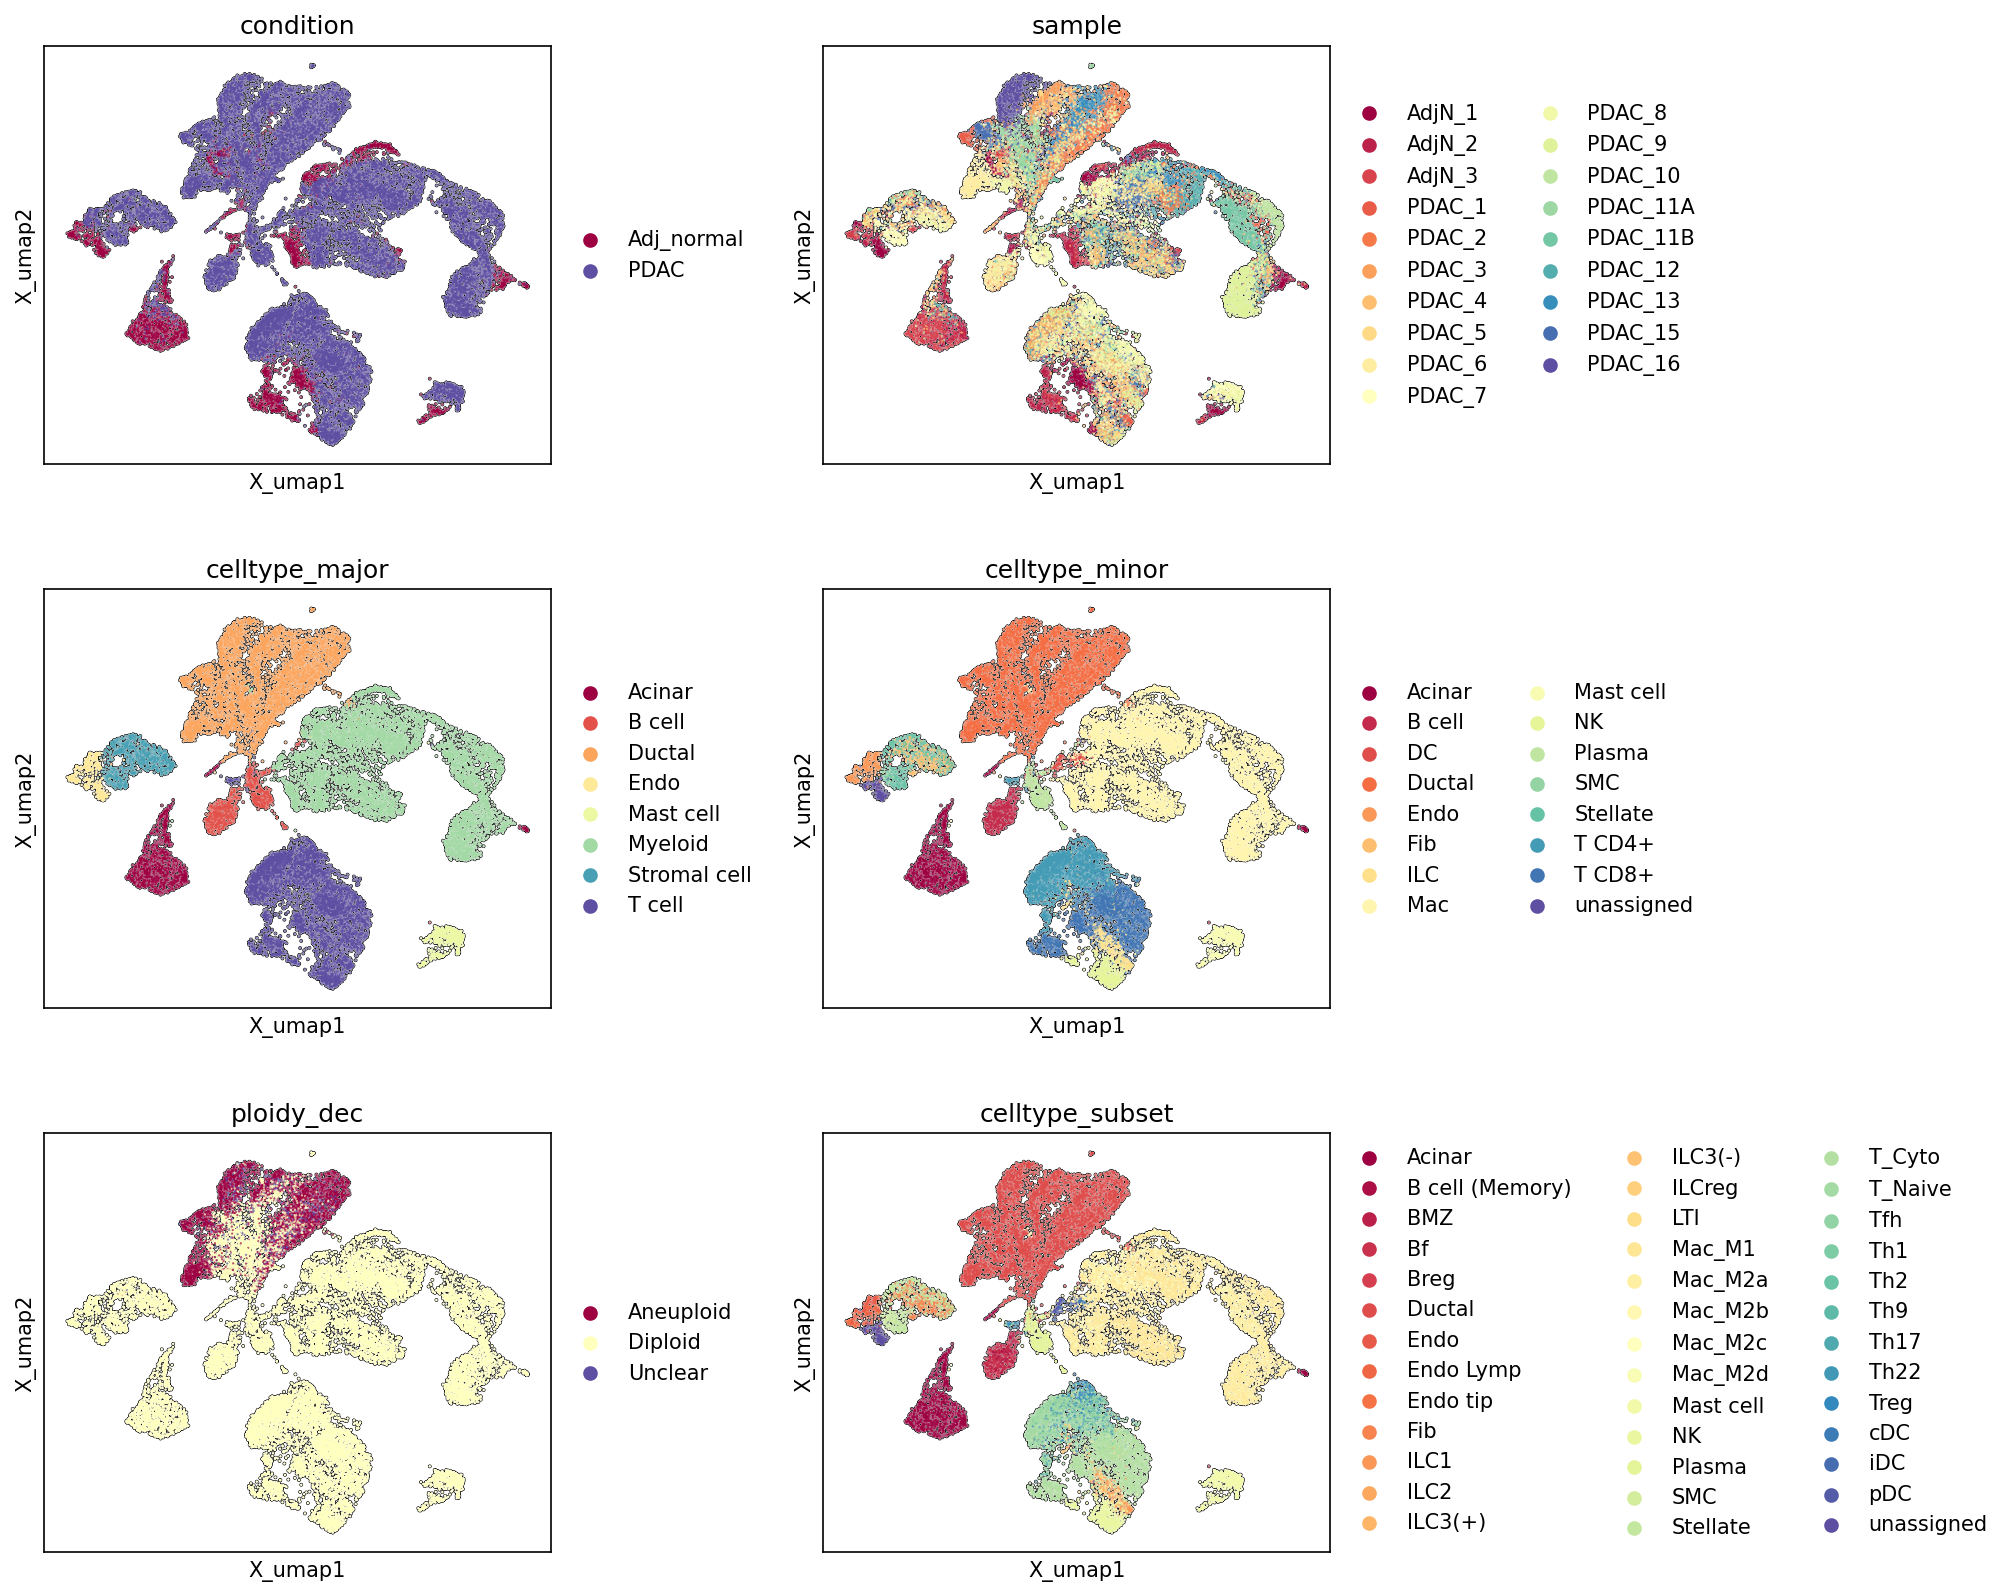
This analysis presents UMAP (Uniform Manifold Approximation and Projection) visualizations of single-cell RNA-seq data from the human pancreas, colored by various metadata features: condition (Adj_normal vs. PDAC), individual sample, major cell type, minor cell type, inferred ploidy status, and cell type subsets. These plots provide an overview of the dataset structure, cell type heterogeneity, disease-associated population shifts, and the distribution of ploidy status, essential for understanding the overall quality of annotations and the underlying biological landscape.
Visual Summary
Condition and Sample Distribution
- Condition: The UMAP colored by condition reveals distinct but also overlapping regions for "Adj_normal" (maroon) and "PDAC" (purple) cells. PDAC cells appear widely distributed across many clusters, including a large central cluster. Ad_normal cells tend to concentrate in specific regions, particularly in smaller, more peripheral clusters and some parts of the central mass. This suggests that while some cell populations are shared or similar between conditions, others are distinctly enriched or altered in PDAC.
- Sample: The sample plot shows a diverse distribution of cells from different samples across the UMAP. While there's a good intermixing of samples within some major clusters, suggesting minimal strong batch effects, some smaller clusters or regions show a dominance of cells from one or a few specific samples (e.g., specific Adj_normal samples). This indicates some sample-specific contributions to cell composition or gene expression, which is common in complex biological datasets and should be considered in downstream analyses.
Cell Type Annotations (Major, Minor, Subset)
- Celltype_major: This plot demonstrates clear separation of major cell types into distinct clusters. "Ductal cell" (orange) forms a prominent, large cluster, centrally located and broadly distributed. "Myeloid cell" (light green) and "T cell" (dark purple) also form large, well-defined clusters. "Acinar cell" (maroon), "Endothelial cell" (light yellow), "B cell" (red), "Stromal cell" (teal), and "Mast cell" (pale yellow) form smaller but equally distinct clusters. This indicates high confidence in the major cell type annotations and their transcriptional distinctness.
- Celltype_minor: The celltype_minor plot further refines the major cell type clusters into more specific populations. For instance, "T cell" splits into "T cell CD4+" and "T cell CD8+". "Myeloid cell" resolves into "Macrophage" and "Dendritic cell (DC)". "Ductal cell" remains a large, central cluster. The refined annotations continue to show good separation and clustering, affirming the quality of granular cell typing. A small population of "unassigned" cells (dark purple) is present, scattered but minimal.
- Celltype_subset: This level provides the most granular view of cell populations. Many minor cell types are further subdivided (e.g., Macrophage into M1, M2A, M2B, M2C, M2D; T cells into various subtypes like Cytotoxic, Naive, Th1, Treg, etc.). These subsets largely maintain distinct clustering patterns, indicating successful identification of fine-grained cellular heterogeneity.
Ploidy Status
- Ploidy_dec: The ploidy_dec UMAP is particularly informative. "Aneuploid" cells (maroon) are predominantly concentrated within the large "Ductal cell" cluster that is also enriched for PDAC cells. In contrast, "Diploid" cells (yellow) constitute the vast majority of other cell types and the peripheral regions of the ductal cluster. A small number of "Unclear" cells (purple) are scattered. This distinct separation strongly suggests that the aneuploid cells represent the malignant epithelial component (Ductal cells) of the pancreatic ductal adenocarcinoma, consistent with the data context indicating "Ductal cell" as the "Tumor origin celltype" and PDAC being a cancer condition.
Biological Interpretation
The UMAP visualizations provide a comprehensive overview of the cellular landscape in pancreatic tissue, highlighting key differences between adjacent normal and PDAC conditions.
- Tumor Microenvironment Composition: The presence of diverse immune cells (T cells, B cells, Macrophages, Dendritic cells, Mast cells, NK cells, ILCs), endothelial cells, and stromal cells (Fibroblasts, Stellate cells, Smooth muscle cells) alongside epithelial cells (Ductal, Acinar) indicates a robust representation of the pancreatic tumor microenvironment (TME) in the PDAC samples. This rich dataset allows for detailed investigations into cell-cell interactions and cell-type specific responses.
- Malignant Cell Identification: The strong co-localization of "Ductal cells" (specifically those from PDAC samples) with "Aneuploid" status is a crucial finding. This confirms the identity of the malignant cell population as transformed ductal cells, which is consistent with the biology of PDAC (Pancreatic Ductal Adenocarcinoma) GeneCards: KRAS, TP53, SMAD4. This also validates the accuracy of the ploidy_dec annotation for distinguishing tumor cells from normal epithelial and stromal cells.
- Condition-Specific Cell Population Shifts: The distribution of "PDAC" and "Adj_normal" cells suggests that while some core pancreatic cell types are present in both conditions, there are likely alterations in cell type proportions or transcriptional states within specific populations in PDAC. For example, the expansion of certain immune cell subsets or the altered state of stromal cells would contribute to the unique UMAP topology seen in PDAC.
- Annotation Quality: The consistent clustering and distinct separation of cells across all three levels of cell type annotation (celltype_major, celltype_minor, celltype_subset) demonstrate high-quality and robust cell type identification. This provides a strong foundation for downstream differential expression, pathway analysis, and cell-cell interaction studies.
Clinical or Translational Implications
- Understanding PDAC Heterogeneity: The detailed cell type subset annotations provide a valuable resource for dissecting the cellular heterogeneity of PDAC and its microenvironment, which is crucial for identifying therapeutic targets. For instance, understanding the different macrophage polarization states (M1, M2A-D) or T cell subtypes (Treg, T_Cyto, Th1, Th17) within the PDAC TME could inform immunotherapeutic strategies PubMed search: Pancreatic cancer immunotherapy TME.
- Biomarker Discovery: The distinct molecular profiles of aneuploid ductal cells, as well as specific immune or stromal cell populations within the PDAC context, could yield novel diagnostic or prognostic biomarkers.
- Targeting Tumor Origin Cells: The clear identification of aneuploid ductal cells as the tumor origin population allows for focused analysis of their specific molecular vulnerabilities, which could lead to new targeted therapies for PDAC.
Annotation Notes
- The sample plot indicates some sample-specific clustering, which suggests variations in cell composition or subtle batch effects. While not severe enough to compromise overall cell type clustering, it's a factor to consider when interpreting sample-level differences in gene expression.
- The "unassigned" cells (dark purple) in celltype_minor and celltype_subset plots represent a very small fraction of the total cells and do not form a major distinct cluster, indicating that the vast majority of cells have been successfully annotated.
2. Pancreatic Single-Cell UMAP Gene Expression Analysis and Cell Type Annotation Validation
[Analysis Visualization Results]...
Analysis Overview
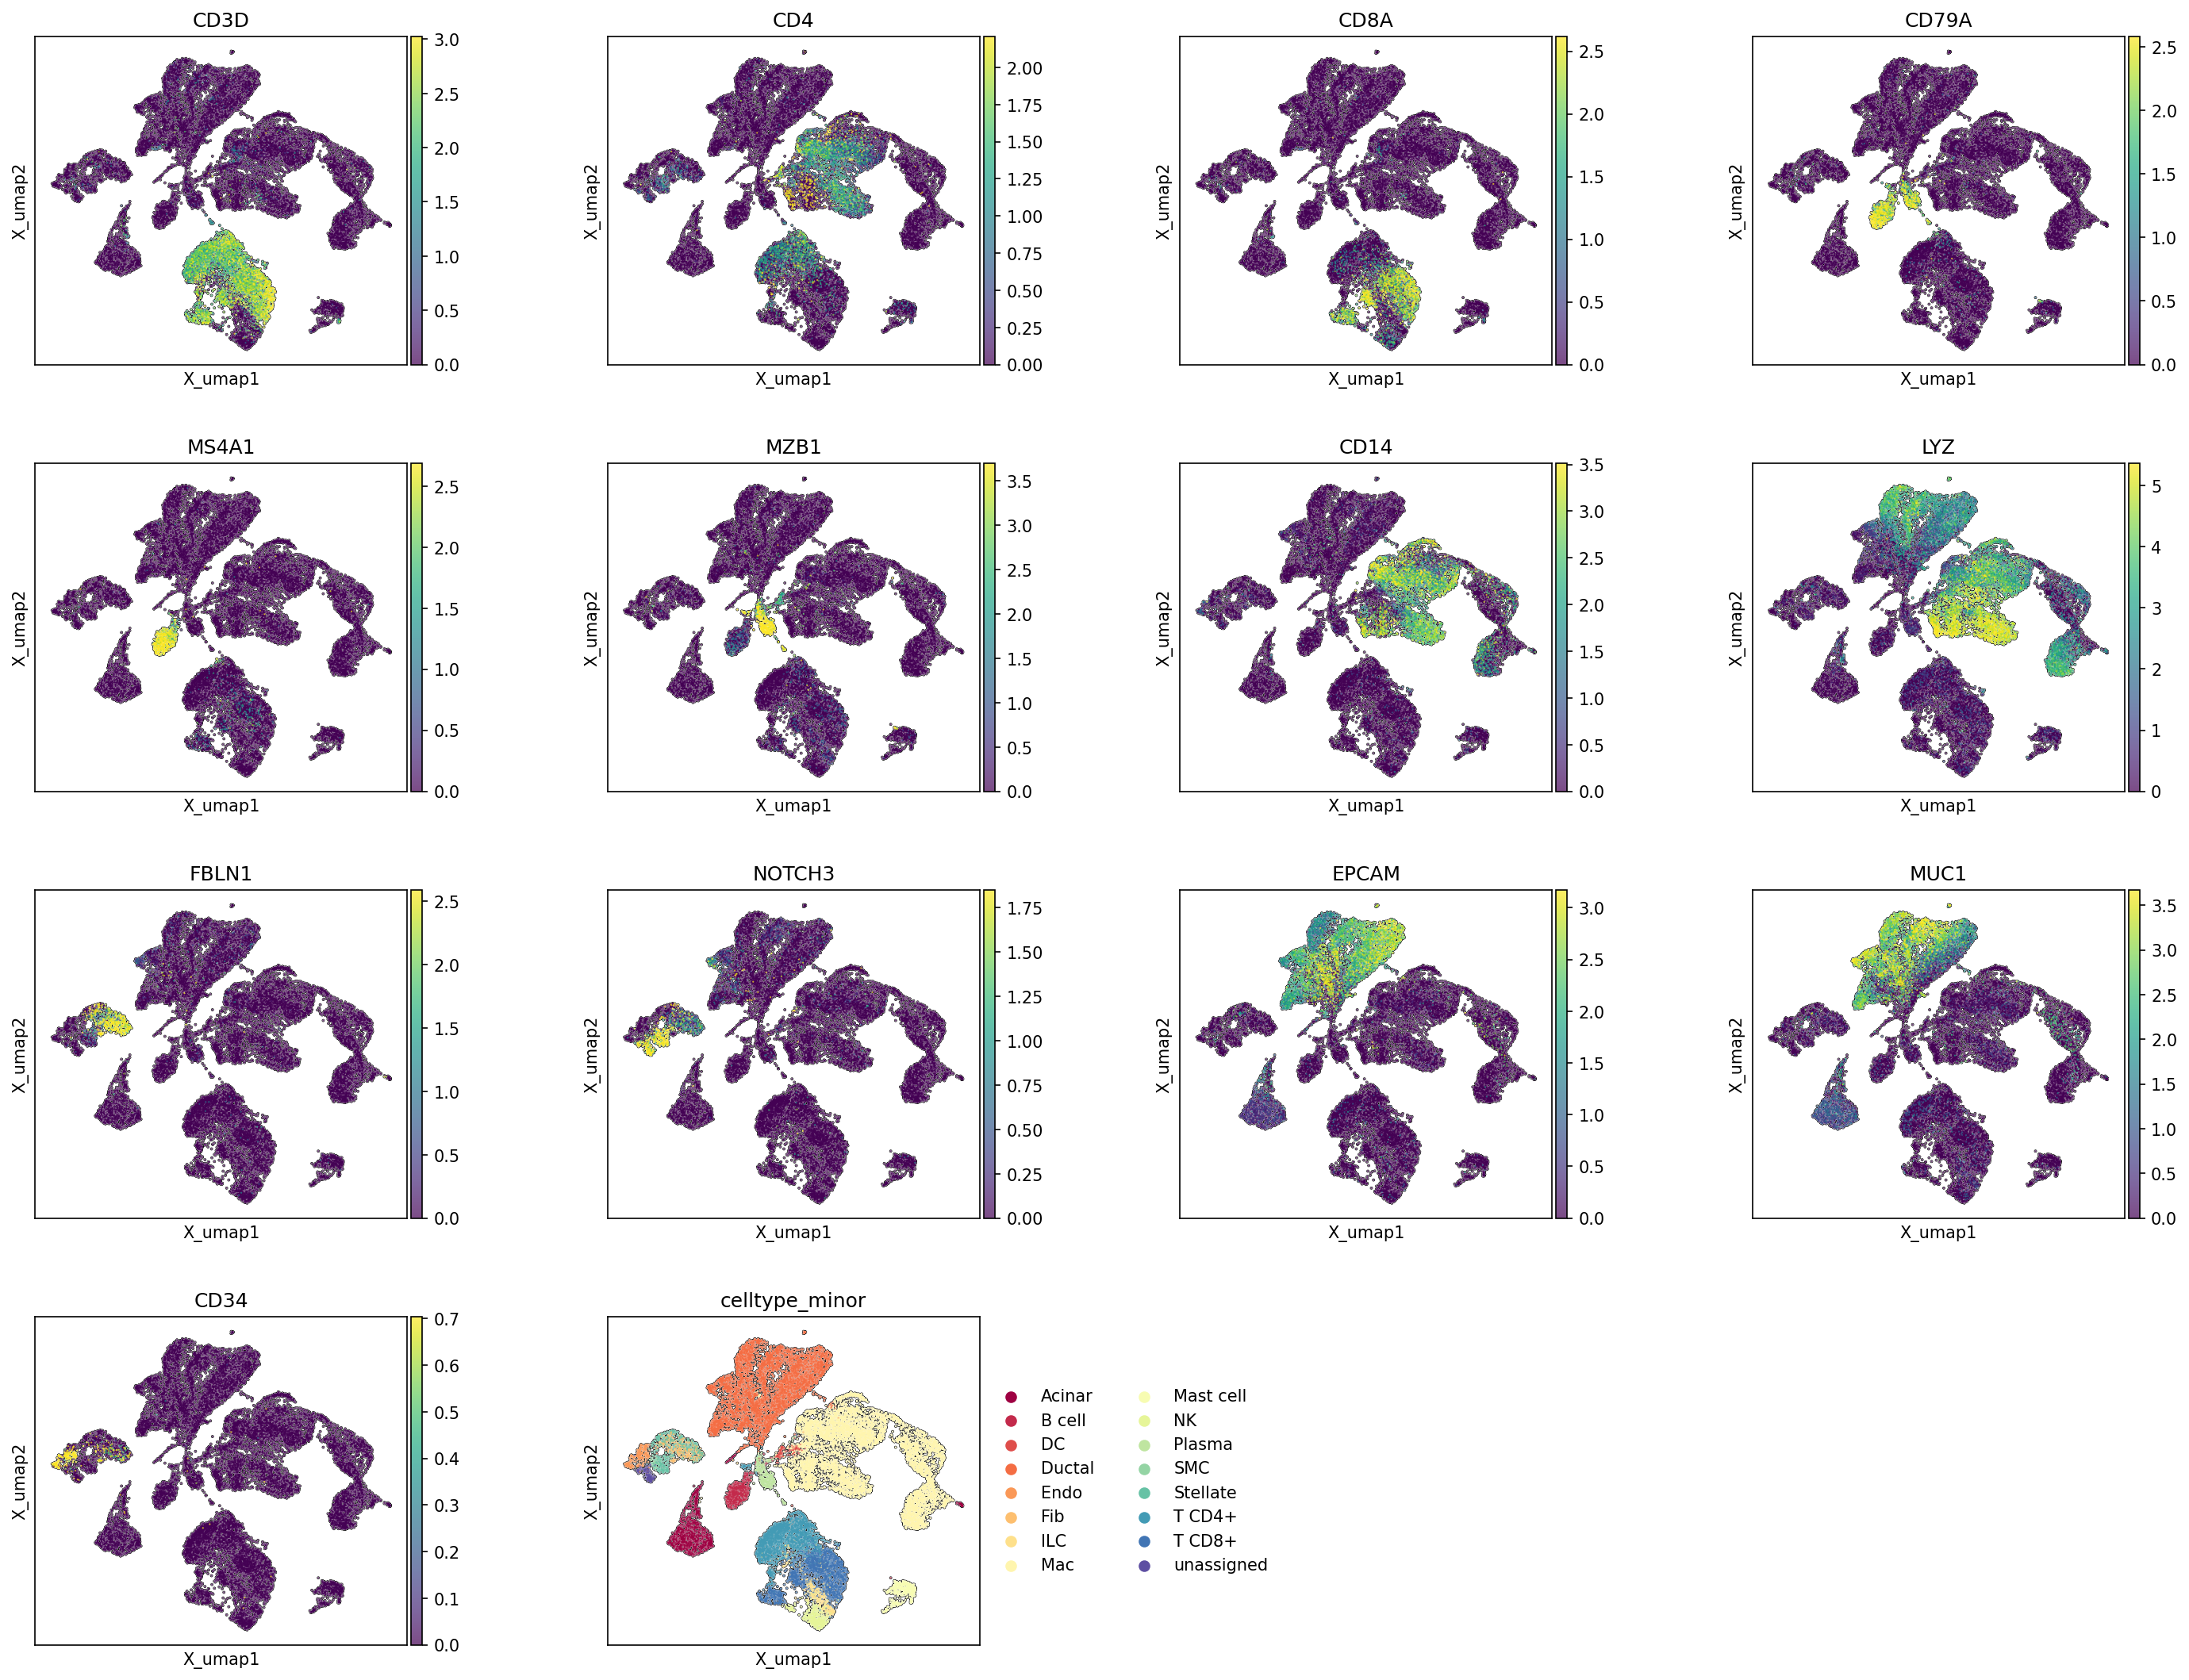
This analysis visualizes the expression of a panel of canonical marker genes across the UMAP embedding of pancreatic single-cell RNA-seq data. The primary goal is to validate the celltype_minor annotations by observing whether specific gene markers are highly expressed within their expected cell populations. The UMAP plots display the expression levels of 12 key genes, alongside a UMAP colored by celltype_minor annotations for direct comparison.
Visual Summary
The UMAP plots clearly delineate distinct clusters of cells corresponding to various pancreatic cell types. The expression patterns of the investigated genes are highly localized to specific regions of the UMAP, which largely align with the celltype_minor annotations:
- T-cell Markers (CD3D, CD4, CD8A): CD3D shows broad expression in a large cluster at the bottom-center/bottom-right of the UMAP, corresponding to the pan-T cell population. Within this cluster, CD4 expression is concentrated in one sub-region (T cell CD4+), and CD8A expression is in another distinct sub-region (T cell CD8+), confirming their specific identities.
- B-cell and Plasma Cell Markers (CD79A, MS4A1, MZB1): CD79A and MS4A1 (CD20) exhibit strong, co-localized expression in a discrete cluster on the mid-left side, which is annotated as B cells. MZB1 expression is observed in a smaller, adjacent cluster, consistent with plasma cells or marginal zone B cells, which are typically derived from B cells.
- Myeloid Cell Markers (CD14, LYZ): Both CD14 and LYZ show high expression in a large, contiguous cluster located towards the upper-right of the UMAP. This region broadly encompasses cells annotated as Macrophages and Dendritic Cells (DCs), consistent with their myeloid origin.
- Stromal Cell Markers (FBLN1, NOTCH3): FBLN1 expression is prominent in a cluster at the bottom-left, overlapping with Fibroblast and Stellate cell populations. NOTCH3 shows more diffuse expression across several clusters on the left side, including Endothelial cells, Fibroblasts, and potentially Smooth muscle cells (SMC), reflecting its role in various stromal and vascular components.
- Epithelial Cell Markers (EPCAM, MUC1): EPCAM and MUC1 are highly expressed in the two largest clusters at the top-left and right-center. These regions correspond to Ductal and Acinar cells, which are the main epithelial cell types of the pancreas.
- Endothelial Cell Marker (CD34): CD34 expression is concentrated in a small, well-defined cluster on the far left, precisely matching the Endothelial cell annotation.
Biological Interpretation
The strong concordance between the spatial distribution of canonical marker gene expression and the celltype_minor annotations provides robust validation for the cell type assignments in this single-cell RNA-seq dataset.
- Immune Cell Identity: The clear separation of T cells (CD3D+, CD4+, CD8A+), B cells (CD79A+, MS4A1+), plasma cells (MZB1+), and myeloid cells (CD14+, LYZ+) demonstrates successful resolution of distinct immune cell populations within the pancreatic microenvironment. The presence of T cells, B cells, macrophages, and dendritic cells is expected in both healthy and diseased pancreatic tissue.
- CD3D: GeneCards [GeneCards]
- CD4: GeneCards [GeneCards]
- CD8A: GeneCards [GeneCards]
- CD79A: GeneCards [GeneCards]
- MS4A1: GeneCards [GeneCards]
- MZB1: GeneCards [GeneCards]
- CD14: GeneCards [GeneCards]
- LYZ: GeneCards [GeneCards]
- Pancreatic Parenchymal and Stromal Cell Identification: The expression patterns confirm the presence and correct annotation of major pancreatic resident cell types:
- Epithelial Cells (Ductal, Acinar): EPCAM and MUC1 are robust markers for these populations, which form the bulk of the pancreatic tissue. Ductal cells are the tumor origin cell type in PDAC, making their accurate identification crucial.
- Stromal Cells (Fibroblasts, Stellate cells, Endothelial cells): FBLN1 as a fibroblast/stellate marker, NOTCH3 indicating various stromal and vascular components, and CD34 as a clear endothelial marker, all point to well-defined stromal compartments. Pancreatic stellate cells and fibroblasts are key drivers of desmoplasia in PDAC.
- EPCAM: GeneCards [GeneCards]
- MUC1: GeneCards [GeneCards]
- FBLN1: GeneCards [GeneCards]
- NOTCH3: GeneCards [GeneCards]
- CD34: GeneCards [GeneCards]
- Embedding Structure and Annotation Quality: The distinct and non-overlapping expression of cell-type-specific markers across different UMAP regions indicates a high quality of cell clustering and subsequent cell type annotation. The embedding effectively separates distinct biological cell states.
Annotation Notes
The comprehensive validation of celltype_minor annotations using canonical markers confirms the reliability of the cell type assignments, which is fundamental for subsequent downstream analyses such as differential gene expression (DEG), gene set enrichment analysis (GSEA), or cell-cell interaction (CCI) studies. This robust annotation foundation ensures that findings derived from these cell types are biologically sound.
3. Celltype_subset Marker Expression Dot Plot Analysis
[Analysis Visualization Results]...
Analysis Overview
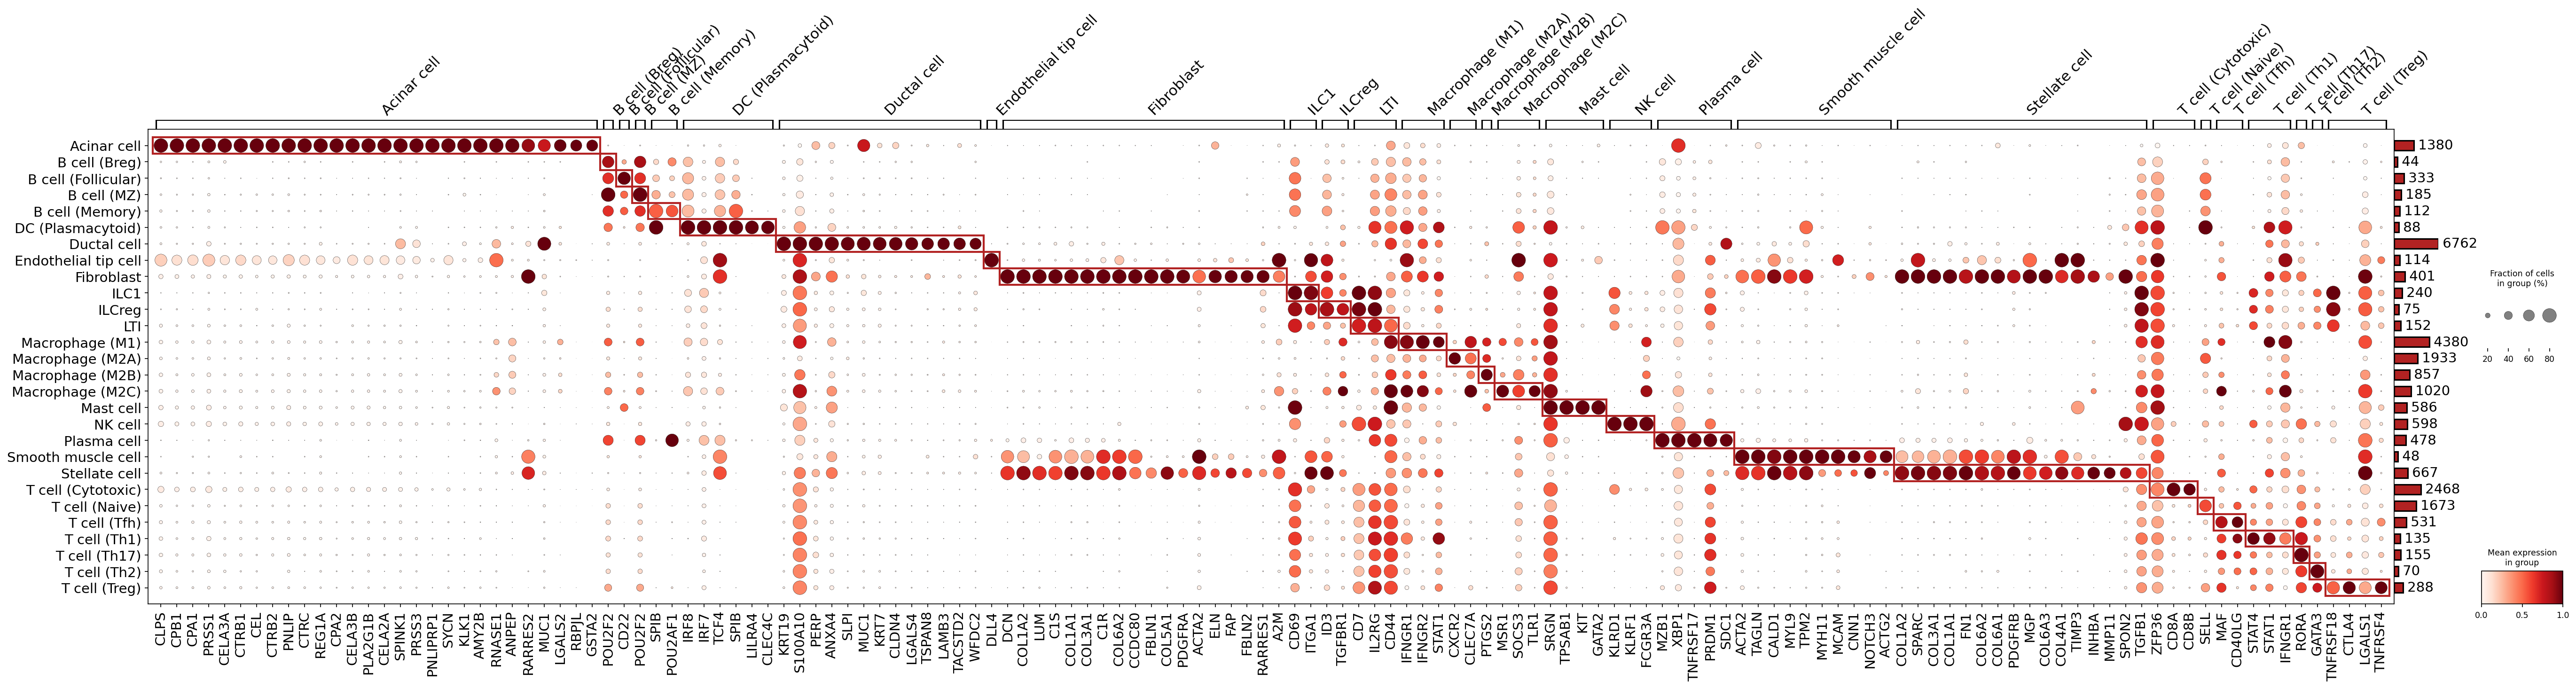
This analysis presents a dot plot illustrating the expression patterns of marker genes across various celltype_subset populations identified in the single-cell RNA-seq data from human pancreas. The primary goal is to assess the quality of cell type annotations by examining whether the assigned cell subsets exhibit characteristic expression of known marker genes. Each dot represents a marker gene within a specific cell subset, with its size indicating the fraction of cells expressing the gene and its color intensity (red scale) representing the mean expression level. Markers were selected based on non-zero percentage score, focusing on surfaceome genes.
Visual Summary
The dot plot effectively visualizes distinct sets of marker genes highly expressed within specific celltype_subset populations.
- Clear Clustering: The plot shows clear blocks of high expression (large, dark red dots) corresponding to expected marker genes for most cell subsets, indicated by the red boxes. This pattern suggests well-defined and transcriptionally distinct cell populations.
- Specificity of Markers: Most markers exhibit high specificity, with strong expression concentrated in one or a few closely related cell types. For example, pancreatic acinar cell markers are almost exclusively expressed in acinar cells, and specific B cell markers are largely confined to B cell subsets.
- Pan-Cell Type Markers: While most markers are specific, some broader immune cell markers (e.g., pan-T cell markers) might show expression across multiple T cell subsets, as expected. Macrophage markers also show a collective pattern across macrophage subsets.
- Expression Level and Prevalence: The varying sizes and intensities of the dots highlight both the proportion of cells expressing a marker within a group and the average expression level, providing a comprehensive view of marker gene activity.
- Cell Type Hierarchies: Related cell types, such as different B cell subsets or T cell subsets, often share a core set of markers while also displaying unique distinguishing genes, reflecting their lineage relationships and functional specialization.
Biological Interpretation
The marker expression patterns observed in the dot plot provide strong evidence supporting the robustness and accuracy of the celltype_subset annotations.
- Acinar Cell Identity: Acinar cells are clearly defined by the high expression of genes encoding digestive enzymes and related proteins such as CLPS, PRSS1, CPA1, CPA2, CELLA3A/B, and SPINK1 (Serine Peptidase Inhibitor Kazal Type 1) GeneCards: SPINK1.
- B Cell Subsets: Different B cell subsets (Breg, Follicular, MZ, Memory) are characterized by canonical B cell markers like CD79A, CD79B, CD22, and transcription factors like POU2F2. Plasma cells, a terminal differentiation stage of B cells, are distinctly marked by SDC1 (CD138), MZB1, XBP1, and PRDM1 (BLIMP1) GeneCards: SDC1.
- Dendritic Cell (Plasmacytoid) Identity: Plasmacytoid DCs (pDCs) show specific expression of LILRA4, CLEC4C, and IRF7, which are characteristic markers for this immune cell type involved in antiviral responses GeneCards: LILRA4.
- Ductal Cell Identity: Ductal cells are identified by epithelial keratins KRT7 and KRT19, as well as other epithelial-associated genes like MUC1 and CLDN4.
- Endothelial Cell Subsets: Endothelial cells, including endothelial tip cells, display high expression of vascular endothelial markers such as VWF, CD34, PECAM1 (CD31), and CDH5 (VE-cadherin).
- Fibroblast and Stellate Cell Identity: Fibroblasts and pancreatic stellate cells (a specialized fibroblast type in the pancreas) exhibit a mesenchymal signature with genes like COL1A1, DCN, LUM, FAP, and PDGFRA. The presence of ACTA2 (alpha-smooth muscle actin) in stellate cells suggests an activated myofibroblastic phenotype.
- Macrophage Subsets: Macrophage populations show general macrophage markers like CD68, ITGAM, MSR1, and FCGR1A. While specific polarization markers for M1/M2 subtypes are not as distinctly separated in this overview, the overall macrophage identity is well supported.
- Mast Cell Identity: Mast cells are uniquely identified by classical markers such as KIT (CD117), TPSAB1 (Tryptase beta 1), and the transcription factor GATA2 GeneCards: KIT.
- NK Cell Identity: NK cells show expression of markers like KLRD1 (CD94) and KLRF1 (NKG2D).
- Smooth Muscle Cell Identity: Smooth muscle cells are characterized by contractile proteins like ACTA2, TAGLN, MYH11, and CNN1.
- T Cell Subsets: Various T cell subsets display their expected markers:
- Pan-T cell markers: CD3D, CD3E, CD3G, CD2.
- Cytotoxic T cells: CD8A, CD8B, PRF1 (Perforin), GZMA, GZMB (Granzymes).
- Naive T cells: SELL (CD62L).
- T follicular helper (Tfh) cells: PDCD1 (PD-1), CXCR5, CD40LG.
- Th1 cells: STAT1, IFNG (though IFNG not strongly specific in this plot).
- Th17 cells: RORC (RORγt).
- Th2 cells: GATA3.
- T regulatory (Treg) cells: FOXP3, CTLA4, TNFRSF18 (GITR), TNFRSF4 (OX40) GeneCards: FOXP3.
Annotation Notes
The strong and specific expression patterns of known marker genes across the various celltype_subset populations confirm the high quality and reliability of the cell type annotations. The distinct gene signatures for each subset allow for clear differentiation between cell types and support the biological relevance of the identified populations within the pancreatic tissue. This robust annotation serves as a solid foundation for subsequent analyses, such as differential gene expression, cell-cell interaction, or pathway enrichment studies.
4. CNV Analysis of Ductal and Unassigned Cells in Pancreatic Samples
[Analysis Visualization Results]...
Analysis Overview
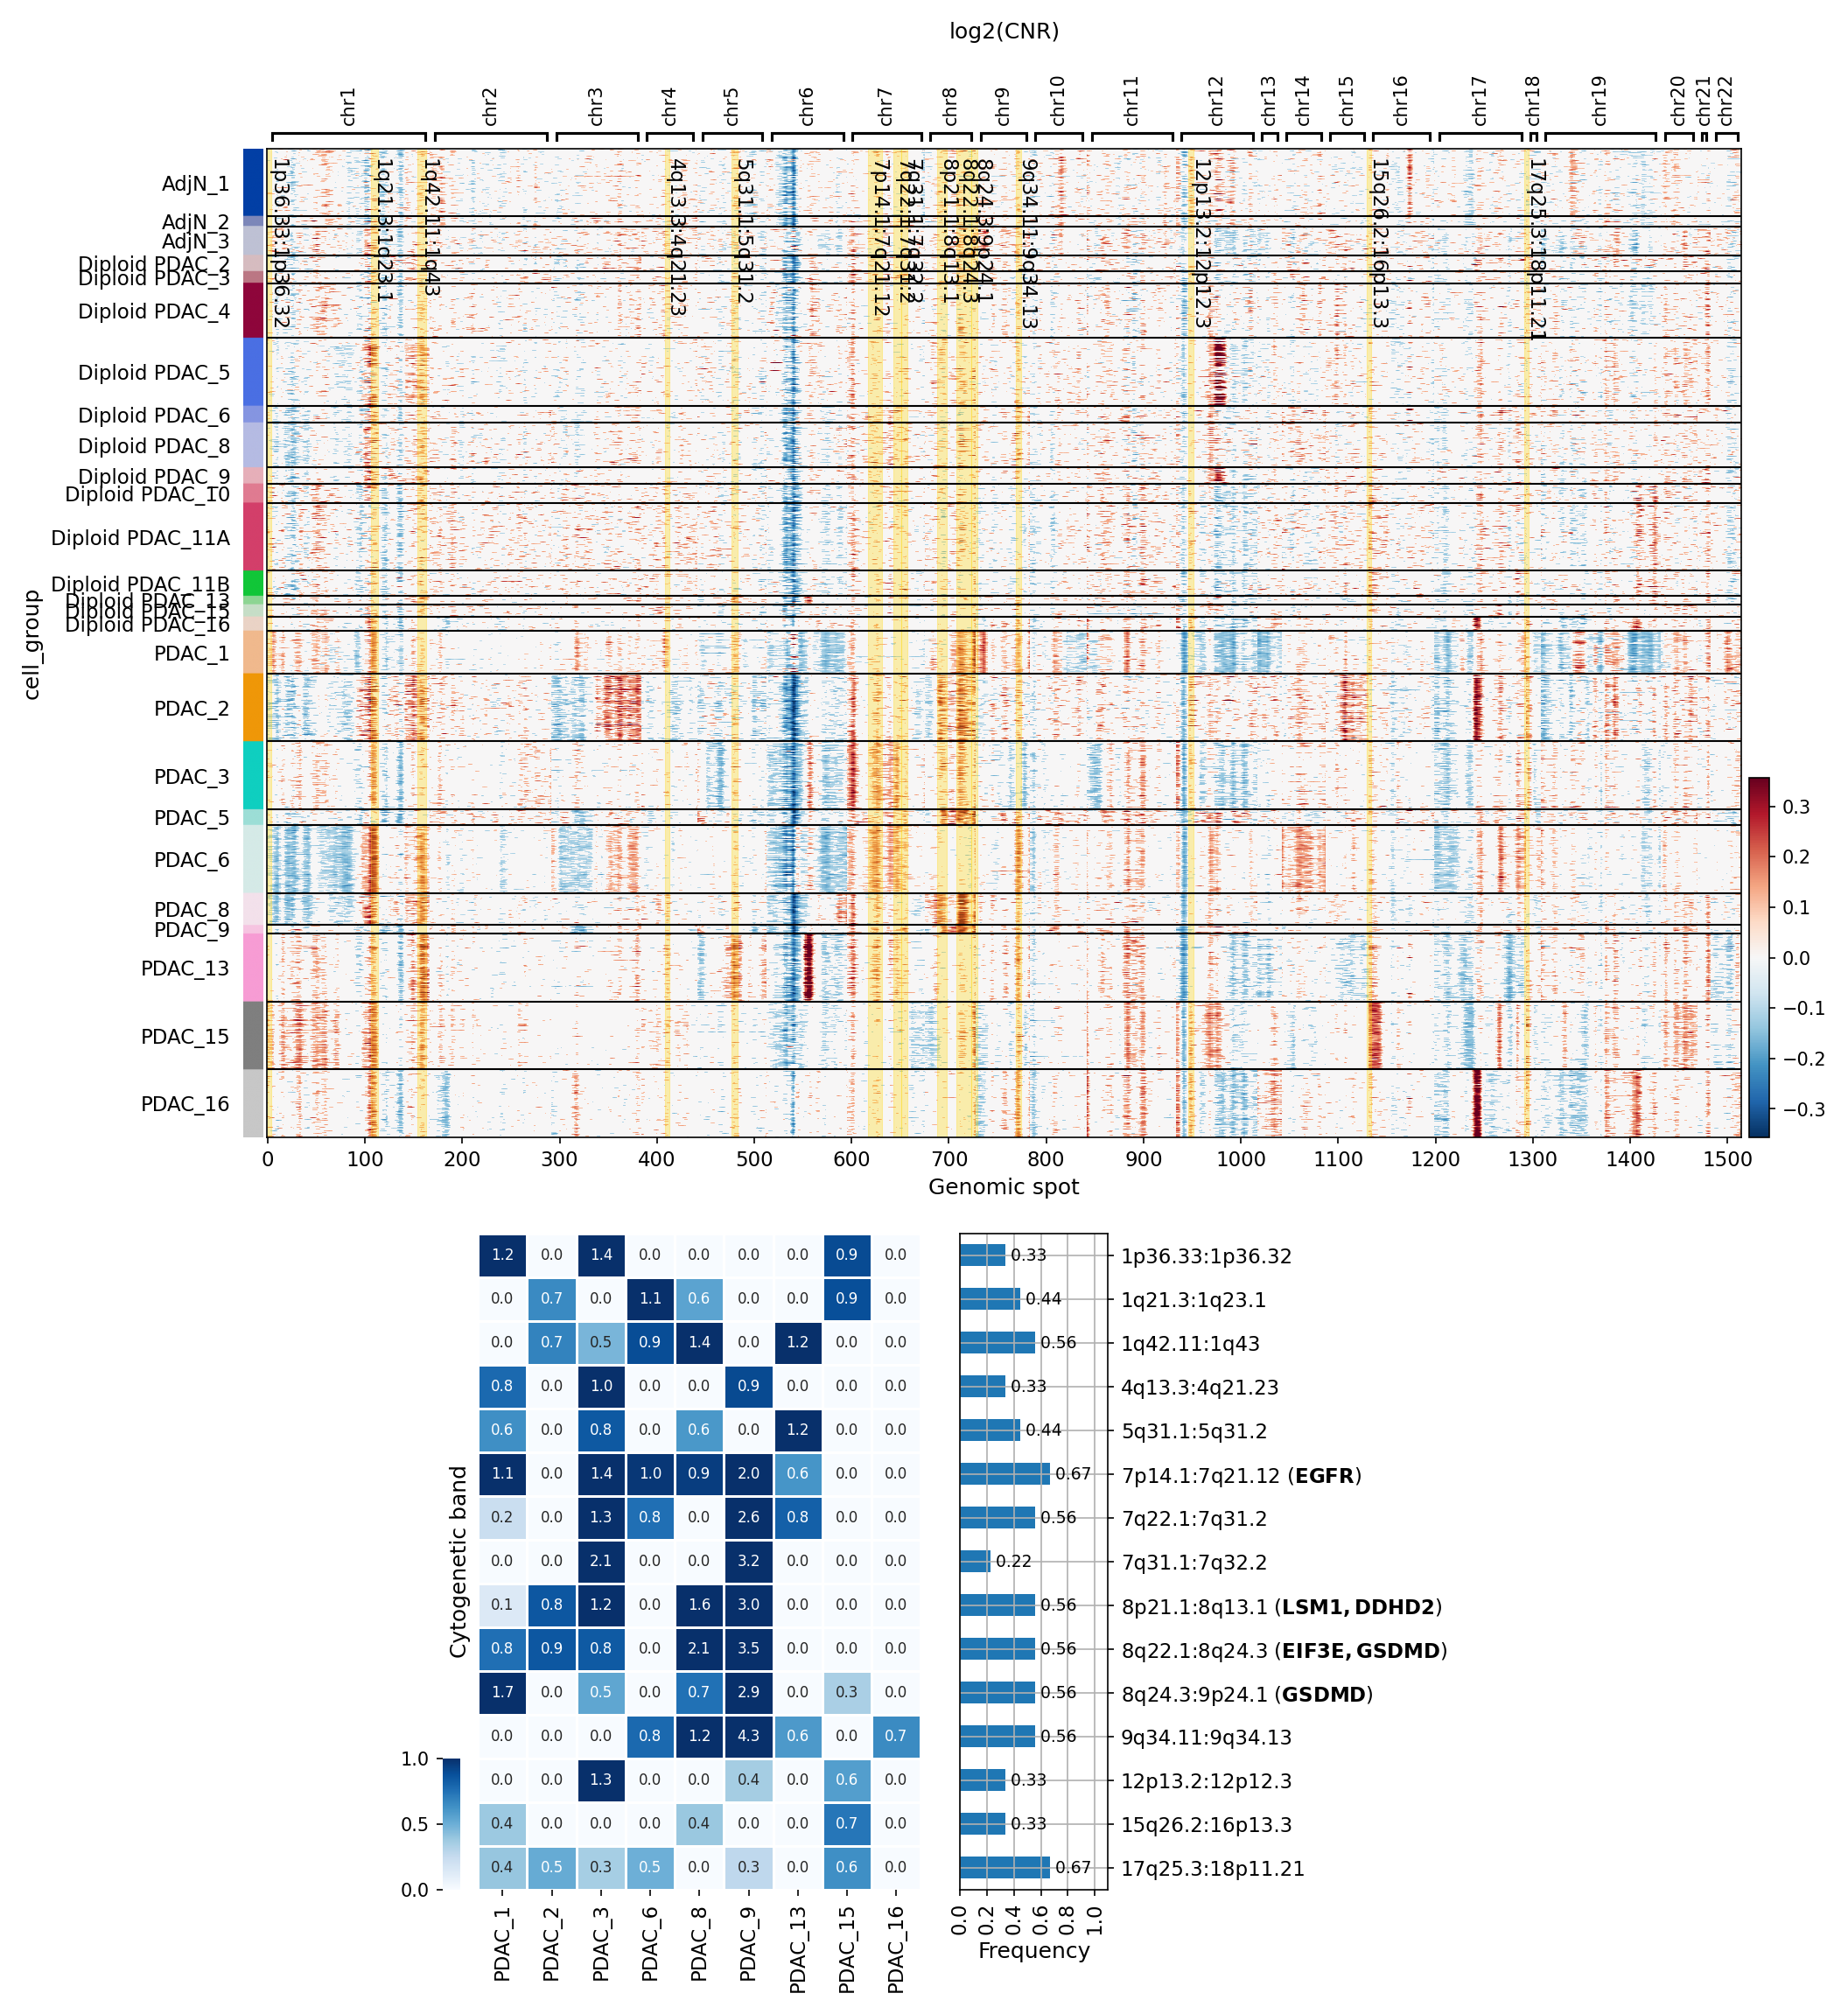
This analysis provides an interpretation of copy number variation (CNV) patterns in "Ductal cell" (identified as the tumor-origin cell type) and "unassigned" cells from single-cell RNA-seq data, across various pancreatic samples. The results include a heatmap illustrating log2(Copy Number Ratio) values for individual genomic spots across different samples, grouped by sample identity. Additionally, a summary plot highlights significantly amplified genomic regions, displaying both the extent of CNV activity per sample and the overall frequency of these amplifications across all samples. The goal is to identify common and sample-specific genomic alterations relevant to pancreatic disease, particularly in the context of pancreatic ductal adenocarcinoma (PDAC).
Visual Summary
CNV Heatmap (log2(CNR))
The main heatmap visualizes log2(CNR) values across approximately 1500 genomic spots, ordered by chromosome, for "Ductal cell" and "unassigned" cells from different samples.
- Adj_normal Samples: Samples from 'Adj_normal' condition (Adj_N 1, Adj_N 2, Adj_N 3) primarily show log2(CNR) values close to zero (yellow/light blue), indicating genomic stability and absence of significant CNVs, as expected for normal adjacent tissue cells.
- Diploid PDAC Samples: Samples labeled 'Diploid PDAC_X' (e.g., Diploid PDAC_4 to _16) also generally exhibit a relatively stable genomic profile, with fewer widespread amplifications (red) or deletions (blue) compared to the 'PDAC_X' samples. This supports their classification as predominantly diploid, although some focal CNAs are still observable, suggesting minor genomic instability even in cells designated as diploid.
- Aneuploid PDAC Samples: Samples labeled 'PDAC_X' (e.g., PDAC_1 to _16) show pronounced and widespread CNVs.
- Significant amplifications (red, log2(CNR) > 0) and deletions (blue, log2(CNR) < 0) are clearly visible across multiple chromosomes in these samples.
- Notably, several PDAC samples (e.g., PDAC_1, PDAC_2, PDAC_3, PDAC_8, PDAC_9, PDAC_13, PDAC_15, PDAC_16) display recurring amplification patterns, particularly on chromosomes 7, 8, 9, and 17.
- Sample-specific heterogeneity is evident, with some samples showing unique or more extensive CNVs than others (e.g., PDAC_13 has broad amplifications on chromosome 17, and PDAC_16 has deletions on chromosome 1p and amplifications on 17q).
- Commonly amplified regions include parts of chromosome 7q, 8q, and 9p, which are frequently implicated in PDAC.
Significant Amplified Copy Number Regions Summary
The summary plots provide a detailed view of significant CNAs:
- Left Plot (CNA Extent per Sample): This heatmap shows the aggregated magnitude of significant CNAs for specific cytogenetic bands across different 'PDAC_X' samples. Darker blue squares and higher numerical values indicate a greater extent of CNA in that specific band for that sample.
- For instance, sample PDAC_9 shows high CNA scores in 7q14.1:7q21.12, 8q21.1:8q13.1, 8q22.1:8q24.3, and 8q24.3:9p24.1.
- PDAC_3 and PDAC_8 also exhibit a high extent of CNA in many of the same regions, suggesting common drivers among these samples.
- Right Plot (Overall CNA Frequency): This bar chart displays the frequency (proportion of cells/samples with significant CNA) of specific cytogenetic bands across all analyzed 'Ductal cell' and 'unassigned' samples.
- The most frequently amplified region is 8q24.3:9p24.1 (GSDMD), observed in approximately 80% of samples (frequency ~0.8).
- Other highly frequent amplifications include 7p14.1:7q21.12 (EGFR) with a frequency of ~0.67, and 8q21.1:8q13.1 (LSM1, DDHD2), 8q22.1:8q24.3 (EIF3E, GSDMD), both at ~0.56.
- Amplifications on 1p36.33:1p36.32, 1q21.3:1q23.1, 1q42.11:1q43, 4q13.3:4q21.23, 5q31.1:5q31.2, 7q22.1:7q31.3, 7q31.1:7q32.2, 9q34.11:9q34.13, 12p13.2:12p12.3, 15q26.2:16p13.3, and 17q25.3:18p11.21 are also identified with varying frequencies.
Biological Interpretation
The CNV analysis provides critical insights into the genomic landscape of Ductal cells, the tumor-origin cell type in PDAC, and "unassigned" cells which likely include malignant cells.
- Tumor-specific CNVs: The stark difference in CNV burden between 'Adj_normal' and 'PDAC' samples, particularly those classified as aneuploid, strongly supports that these genomic alterations are associated with pancreatic tumorigenesis. The "Ductal cell" population in PDAC samples exhibits extensive genomic instability, a hallmark of cancer.
- Recurrent Amplifications in PDAC: Several frequently amplified regions contain genes known to play roles in cancer:
- 7q14.1:7q21.12 (EGFR): Epidermal Growth Factor Receptor (EGFR) is a well-established oncogene whose amplification and overexpression are common in various cancers, including subsets of PDAC. EGFR signaling promotes cell proliferation, survival, and migration. Its amplification is a known driver in some cancers. GeneCards: EGFR
- 8q24.3:9p24.1 (GSDMD): Gasdermin D (GSDMD) is involved in pyroptosis, a form of inflammatory programmed cell death. Its role in cancer is complex; while it can act as a tumor suppressor by inducing pyroptosis, its dysregulation (including amplification) can lead to impaired cell death and tumor progression or promote inflammation that aids tumor growth. The co-occurrence with 8q22.1:8q24.3 also containing GSDMD highlights this region. GeneCards: GSDMD
- 8q22.1:8q24.3 (EIF3E): Eukaryotic Translation Initiation Factor 3 Subunit E (EIF3E) is part of a complex crucial for protein synthesis. Overexpression or amplification of EIF3 subunits, including EIF3E, is frequently observed in various cancers and can promote tumor cell growth and survival by enhancing oncogenic protein translation. GeneCards: EIF3E
- 8q21.1:8q13.1 (LSM1, DDHD2): LSM1 (LSM1 Homolog, U6 snRNA Associated Sm-Like, S. Cerevisiae) is involved in mRNA degradation and is implicated in cell proliferation and survival in some cancers. DDHD2 (DDHD Domain Containing 2) is a phospholipase whose role in cancer is less clear but may be linked to lipid metabolism alterations often seen in cancer. GeneCards: LSM1, GeneCards: DDHD2
- Ploidy and CNV Burden: The distinction between 'Diploid PDAC' and 'PDAC' (presumably aneuploid) samples is generally consistent with the observed CNV burden. 'Diploid PDAC' cells show fewer global CNVs, while 'PDAC' samples, likely representing more advanced or aggressive tumors, exhibit a high degree of genomic instability. However, even 'Diploid PDAC' cells can harbor focal CNVs, suggesting that genomic alterations can occur prior to overt aneuploidy or that ploidy classification might not capture all regional CNAs.
- "Unassigned" Cells: The fact that "unassigned" cells were included in this analysis and show similar CNV patterns to "Ductal cell" populations suggests that many of these "unassigned" cells are likely malignant ductal cells that could not be precisely classified into specific minor cell types. Their genomic instability reinforces their potential malignant nature.
Clinical or Translational Implications
The recurrent CNVs identified in Ductal and unassigned cells offer potential avenues for clinical and translational research in PDAC:
- Biomarker Potential: The frequent amplification of regions containing genes like EGFR, EIF3E, and GSDMD could serve as biomarkers for PDAC diagnosis, prognosis, or monitoring therapeutic response. Detecting these CNVs could help characterize tumor aggressiveness or molecular subtypes.
- Therapeutic Targets: EGFR amplification, being a well-known oncogenic driver, could suggest a subset of PDAC patients might benefit from EGFR-targeted therapies, although monotherapy has shown limited success in unselected PDAC patients. The presence of these amplifications in single-cell data from actual patient samples provides context for evaluating such therapeutic strategies. Further research would be needed to understand the functional impact of GSDMD and EIF3E amplifications in PDAC and their potential as therapeutic targets.
- Understanding PDAC Heterogeneity: The observed inter-sample heterogeneity in CNV patterns underscores the complex nature of PDAC. Identifying specific CNV profiles in individual patient tumors could facilitate personalized medicine approaches, tailoring treatments to the unique genetic landscape of each patient's tumor.
5. CNV-Informed UMAP Analysis of Pancreatic Single-Cell RNA-seq Data
[Analysis Visualization Results]...
Analysis Overview
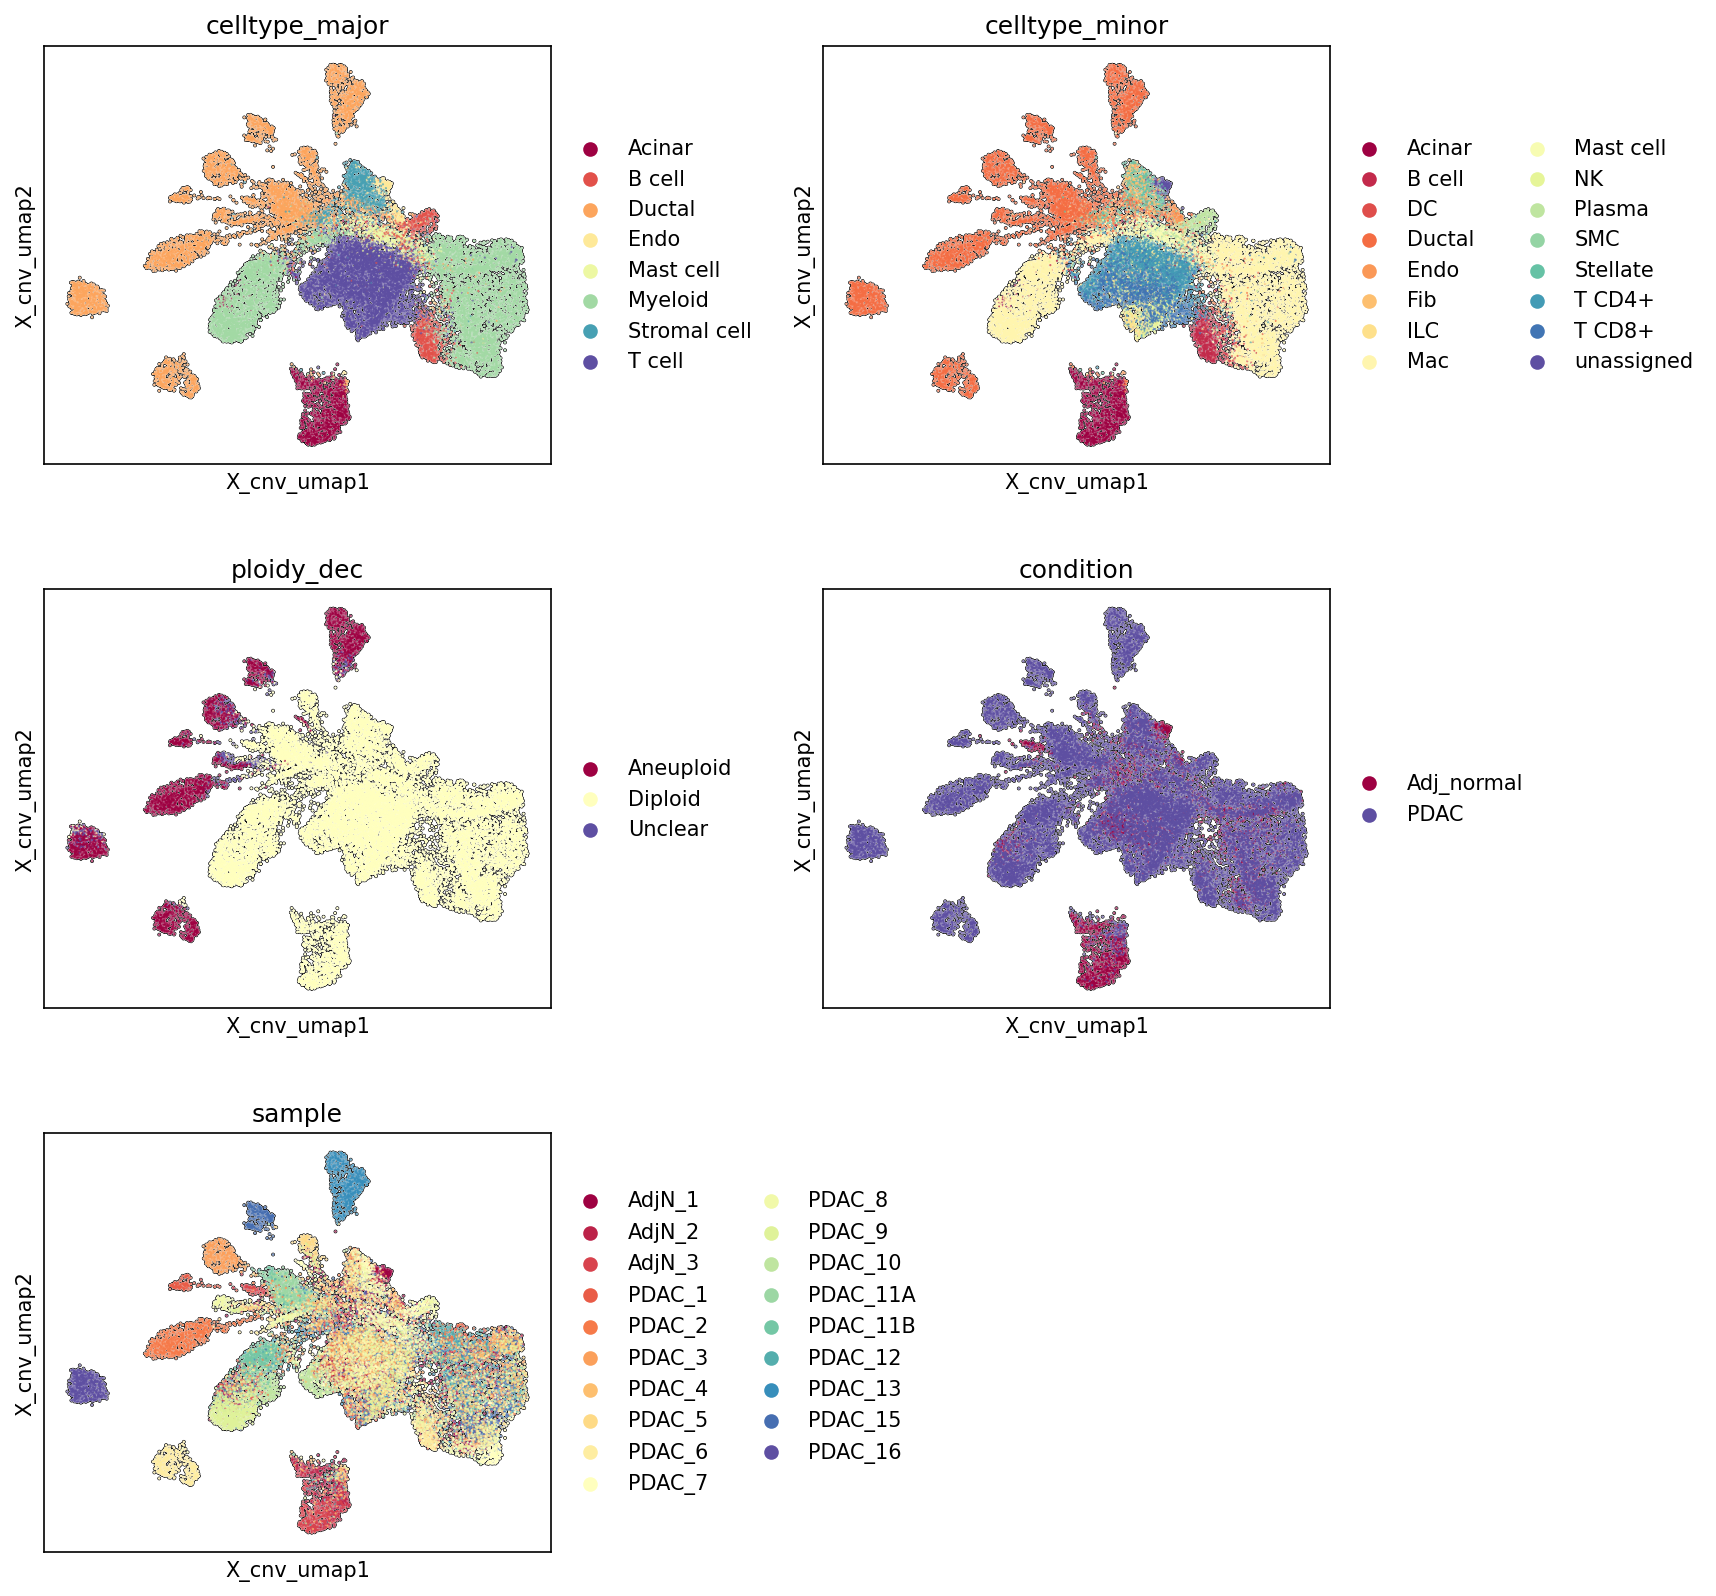
This analysis visualizes the single-cell RNA-sequencing data on a UMAP embedding, specifically incorporating Copy Number Variation (CNV) estimates into the dimensionality reduction. This allows for the clustering and separation of cells based not only on their gene expression profiles but also on their genomic integrity. The UMAP plots are colored by celltype_major, celltype_minor, ploidy_dec (inferred ploidy status), condition (Adj_normal vs. PDAC), and sample to provide a comprehensive view of cell identity, genomic alterations, and their distribution across different biological contexts.
Visual Summary
The UMAP visualizations reveal clear patterns regarding cell identity, genomic status, and disease condition:
Celltype Distribution (celltype_major and celltype_minor):
- Distinct clusters of cells are observable. For instance, Acinar cells form a compact cluster at the bottom of the UMAP.
- Ductal cells (orange in celltype_major/celltype_minor) form prominent, distinct clusters, particularly a large one extending towards the right side of the UMAP space.
- Immune cells (Myeloid, T cell, B cell, NK cell, Plasma cell) are largely interspersed in the central and upper-left regions, often overlapping, but also forming smaller, distinct sub-clusters (e.g., T cell CD8+).
- Stromal cells (Stellate, Fibroblast, Smooth muscle cell) are also distributed across various regions, often adjacent to or intermingled with epithelial or immune populations.
Ploidy Status (ploidy_dec):
- A striking pattern is observed with "Aneuploid" cells (dark red) forming several discrete, well-separated clusters, primarily coinciding with the large Ductal cell cluster on the right and some smaller peripheral groups.
- The vast majority of cells, particularly those in the central and upper-left regions, are "Diploid" (yellow). This large diploid population primarily comprises immune and stromal cells, as well as normal epithelial cells (e.g., Acinar cells).
- "Unclear" cells are very sparse.
Condition Distribution (condition):
- Cells from the "PDAC" condition (dark purple) show a substantial presence across the entire UMAP, critically dominating the "Aneuploid" clusters and the large Ductal cell clusters.
- "Adj_normal" cells (dark red) are primarily concentrated in the large central "Diploid" regions, largely overlapping with immune, stromal, and normal epithelial cell populations.
- There is some overlap in the central regions, where immune and stromal cells from both conditions reside.
Sample Distribution (sample):
- The "Aneuploid" and "Ductal" cell clusters, which are predominantly from PDAC samples, exhibit varying contributions from different PDAC samples (e.g., PDAC_1, PDAC_2, PDAC_3, PDAC_11A, PDAC_11B, PDAC_12, PDAC_13, PDAC_15, PDAC_16). This suggests inter-sample heterogeneity within the malignant cell populations.
- Adjacent normal samples (AdjN_1, AdjN_2, AdjN_3) contribute mainly to the large diploid clusters, confirming their non-malignant nature.
Biological Interpretation
The CNV-informed UMAP embedding effectively delineates distinct cell populations based on their genomic state, offering key biological insights into pancreatic ductal adenocarcinoma (PDAC):
- Identification of Malignant Cells: The most prominent finding is the clear separation and clustering of aneuploid cells. Given that Ductal cells are specified as the "Tumor origin celltype" and aneuploidy is a hallmark of cancer, the strong co-localization of aneuploid cells with Ductal cell clusters (particularly the large cluster on the right) and their exclusive presence in the "PDAC" condition strongly indicate that these aneuploid Ductal cells represent the malignant tumor cells. The CNV information has successfully separated these tumor cells from the surrounding diploid stromal and immune cells.
- Genomic Instability in PDAC: The significant proportion of aneuploid cells specifically within the PDAC samples underscores the widespread genomic instability characteristic of pancreatic cancer. These cells form distinct clusters, suggesting different subclones or states of aneuploidy within the tumor mass.
- Tumor Microenvironment Composition: The large, central clusters, predominantly composed of diploid cells from both "Adj_normal" and "PDAC" conditions, represent the diverse tumor microenvironment. This includes various immune cells (T cells, Myeloid cells) and stromal cells (Fibroblasts, Stellate cells, Smooth muscle cells), which are recruited to or reside within both normal and cancerous pancreatic tissue. Their largely diploid status confirms they are non-malignant components.
- Preservation of Normal Pancreatic Architecture: The distinct cluster of Acinar cells at the bottom, which are predominantly diploid and can originate from both normal and tumor-adjacent tissue, suggests that this normal pancreatic epithelial component is well-preserved and distinct from the malignant Ductal cells in this dataset.
- Sample-Specific Tumor Heterogeneity: The observation that different PDAC samples contribute to distinct parts of the aneuploid Ductal cell clusters highlights the inter-patient heterogeneity of PDAC. While all identified tumor cells share aneuploidy and ductal origin, their specific CNV profiles or expression states, as reflected in the UMAP, can vary between patients.
Clinical or Translational Implications
This analysis provides a robust framework for identifying and characterizing malignant cell populations in PDAC based on their genomic alterations.
- Accurate Tumor Cell Identification: The integration of CNV data is crucial for accurately distinguishing malignant epithelial cells (aneuploid Ductal cells) from normal epithelial cells and other diploid components within the tumor microenvironment. This is particularly important in tumors like PDAC where desmoplasia can dilute the tumor cell fraction in bulk analyses.
- Investigating Tumor Evolution and Heterogeneity: The distinct aneuploid clusters could represent different tumor subclones within a patient or across patients. Further analysis of these subclones (e.g., specific CNV profiles, gene expression differences) could provide insights into tumor evolution, resistance mechanisms, and potential therapeutic vulnerabilities.
- Understanding the Tumor Microenvironment: By clearly separating tumor cells, this analysis enables a more precise investigation of the immune and stromal cell composition and states within the PDAC tumor microenvironment, unconfounded by malignant cell signals. This is critical for developing immunotherapies or stroma-targeting strategies.
- Prognostic and Predictive Biomarkers: Identifying specific aneuploid patterns or gene expression profiles unique to the malignant Ductal cells in this CNV-informed UMAP could lead to the discovery of novel prognostic or predictive biomarkers for PDAC.
6. Minor Cell Type Population Analysis in Pancreatic Tissues
[Analysis Visualization Results]...
Analysis Overview
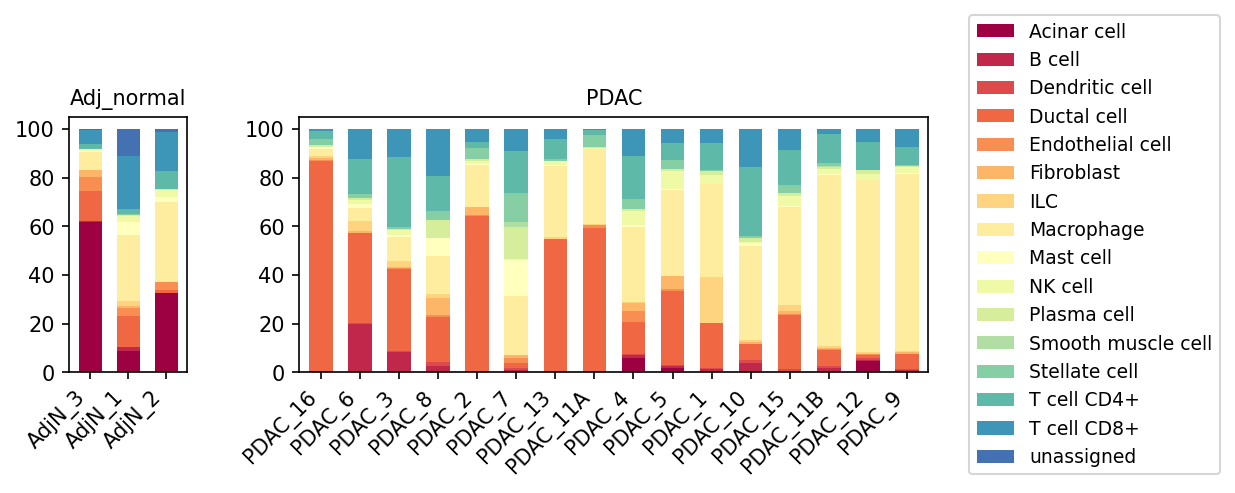
이 분석은 Adj_normal (정상 인접 조직)과 PDAC (췌장 췌관선암) 조건에서 단일 세포 RNA 시퀀싱 데이터를 기반으로 한 minor cell type의 상대적인 세포 개체군 분포를 시각화한 것입니다. 각 막대는 개별 샘플을 나타내며, 서로 다른 색상은 다양한 minor cell type을 의미합니다. 이 플롯은 각 샘플 내에서 특정 세포 유형이 차지하는 비율을 보여주어 조건 간의 세포 구성 변화를 비교하는 데 도움을 줍니다.
Visual Summary
- Adj_normal (정상 인접 조직): 정상 인접 조직 샘플(AdjN_3, AdjN_1, AdjN_2)에서는 Acinar cell (짙은 적색)이 가장 지배적인 세포 유형 중 하나로 나타나며, 특히 AdjN_3에서는 60% 이상을 차지합니다. Macrophage (옅은 노란색)와 T cell CD4+ (청록색), T cell CD8+ (짙은 청색)도 상당한 비율을 차지하고 있습니다. Ductal cell (주황색)은 적은 비율로 존재합니다.
- PDAC (췌장 췌관선암): PDAC 샘플에서는 세포 구성에 큰 이질성이 관찰됩니다.
- Ductal cell (주황색): Adj_normal 샘플에 비해 PDAC 샘플에서 Ductal cell의 비율이 현저히 증가한 경우가 많습니다. 이는 Ductal cell이 췌장암의 기원 세포(Tumor origin celltype: Ductal cell)임을 감안할 때 예상되는 결과입니다. 일부 PDAC 샘플 (예: PDAC_16, PDAC_6, PDAC_3, PDAC_8)에서는 Ductal cell이 전체 세포의 절반 이상을 차지하기도 합니다.
- Acinar cell (짙은 적색): 정상 조직에서 우세했던 Acinar cell은 PDAC 샘플에서는 대부분 매우 낮은 비율로 감소하거나 거의 관찰되지 않습니다. 이는 암성 전환 과정에서 정상 췌장 실질 조직이 파괴되고 종양 세포로 대체되는 현상을 반영합니다.
- Macrophage (옅은 노란색): Macrophage는 많은 PDAC 샘플에서 높은 비율을 차지하며, 특히 PDAC_2, PDAC_7, PDAC_13, PDAC_11A, PDAC_4, PDAC_5, PDAC_10, PDAC_15, PDAC_11B, PDAC_12, PDAC_9 등에서는 Ductal cell 다음으로 또는 Ductal cell과 함께 주요 구성원임을 알 수 있습니다. 이는 종양 미세환경 내 면역 세포 침윤의 중요한 지표입니다.
- Fibroblast (옅은 주황색) 및 Stellate cell (옅은 녹색): 이들 기질 세포(stromal cell)도 PDAC 샘플에서 그 비율이 증가하는 경향을 보이며, 이는 PDAC의 특징인 섬유화(desmoplasia)와 관련이 있을 수 있습니다.
- Lymphoid cells (T cell CD4+, T cell CD8+, B cell, Plasma cell, NK cell, ILC): 이들 면역 세포의 비율은 PDAC 샘플마다 다양하게 나타나, 종양 미세환경 내 면역 침윤의 이질성을 시사합니다. 일부 PDAC 샘플(예: PDAC_1, PDAC_10)에서는 T cell CD4+와 CD8+가 상당한 비율을 차지하기도 합니다.
- unassigned (짙은 파란색): Adj_normal 샘플 중 AdjN_1과 AdjN_2에서는 'unassigned' 세포의 비율이 높게 나타나, 해당 샘플에서 세포 유형 분류의 한계가 있거나 특정 미분화 세포 집단이 존재할 가능성을 시사합니다. PDAC 샘플에서는 일반적으로 'unassigned' 세포의 비율이 낮게 유지됩니다.
Biological Interpretation
이 세포 개체군 분석 결과는 췌장암 발병 및 진행과 관련된 조직학적 및 면역학적 변화를 명확하게 보여줍니다.
- 정상 췌장 구조의 파괴 및 종양 세포 증식: Adj_normal 샘플에서 Acinar cell이 우세한 것은 정상 췌장 외분비 조직의 주요 구성원을 반영합니다. 반면, PDAC 샘플에서 Acinar cell의 현저한 감소와 Ductal cell (종양 기원 세포)의 증가는 종양으로 인한 정상 조직의 파괴 및 암세포의 무분별한 증식을 나타냅니다. 췌장 췌관선암은 췌관 상피세포에서 기원하며, 이는 Ductal cell의 증가로 확인됩니다 https://www.ncbi.nlm.nih.gov/pmc/articles/PMC6908920/.
- 종양 미세환경 (TME) 재구성:
- Macrophage 침윤: PDAC 샘플에서 Macrophage의 높은 비율은 종양 관련 대식세포(Tumor-Associated Macrophages, TAMs)의 풍부한 존재를 강력히 시사합니다. TAMs는 면역 억제, 혈관 신생, 종양 성장 촉진, 전이 등 다양한 종양 진행 과정을 지원하는 것으로 알려져 있습니다 https://www.ncbi.nlm.nih.gov/pmc/articles/PMC8909871/.
- 섬유화 (Desmoplasia) 유도: Fibroblast와 Stellate cell의 증가는 PDAC의 특징적인 소견인 심한 섬유성 기질(desmoplastic stroma)의 형성을 나타냅니다. 췌장 성상 세포(Pancreatic Stellate Cells)는 섬유증 발생의 핵심 조절자이며, 종양 세포와의 상호작용을 통해 암 진행에 기여합니다 https://pubmed.ncbi.nlm.nih.gov/30678685/. 이 섬유성 기질은 약물 침투를 방해하고 면역 세포의 접근을 제한하여 치료 저항성에 기여할 수 있습니다.
- 림프구 침윤의 이질성: T cell CD4+ 및 CD8+의 비율은 PDAC 샘플마다 크게 다릅니다. 이는 환자별로 면역 반응의 활성화 정도나 침윤 패턴이 다르다는 것을 의미하며, 일부 "면역 뜨거운(immune hot)" 종양은 더 많은 T 세포를 가질 수 있는 반면, "면역 차가운(immune cold)" 종양은 T 세포 침윤이 적을 수 있음을 시사합니다.
Clinical or Translational Implications
이러한 세포 개체군 변화는 PDAC의 진단, 예후 및 치료 전략 개발에 중요한 시사점을 제공합니다.
- 바이오마커 개발: Ductal cell의 비정상적인 증식, Acinar cell의 감소, 그리고 Macrophage, Fibroblast, Stellate cell 등 기질 세포의 증가는 PDAC 진단을 위한 조직학적 및 분자 바이오마커로서 활용될 수 있습니다.
- 치료 표적:
- TAMs 표적 치료: 종양 미세환경에서 Macrophage의 높은 비율은 TAMs가 PDAC 치료의 유망한 표적이 될 수 있음을 시사합니다. TAMs의 활성화를 억제하거나 재프로그래밍하는 전략은 면역 치료 효과를 높일 수 있습니다.
- 기질 표적 치료: Fibroblast 및 Stellate cell에 의해 형성되는 섬유성 기질은 약물 전달을 방해하므로, 이러한 기질 세포를 표적으로 하여 섬유화를 감소시키는 전략은 기존 항암제의 효능을 개선할 수 있습니다.
- 환자 계층화 및 예후 예측: T 세포 침윤의 이질성은 PDAC 환자를 면역 반응에 따라 계층화하고 면역 관문 억제제와 같은 면역 치료에 대한 반응을 예측하는 데 활용될 수 있습니다. T 세포 침윤이 높은 환자는 면역 치료에 더 잘 반응할 수 있습니다.
- 세포 기반 치료 개발: 특정 세포 유형 (예: 종양을 직접 공격하는 T cell CD8+)의 비율 변화를 이해하는 것은 세포 기반 면역 치료법을 개발하고 최적화하는 데 도움이 될 수 있습니다.
7. T-cell Subset Population Analysis in Pancreatic Ductal Adenocarcinoma (PDAC) vs. Adjacent Normal Tissue
[Analysis Visualization Results]...
Analysis Overview
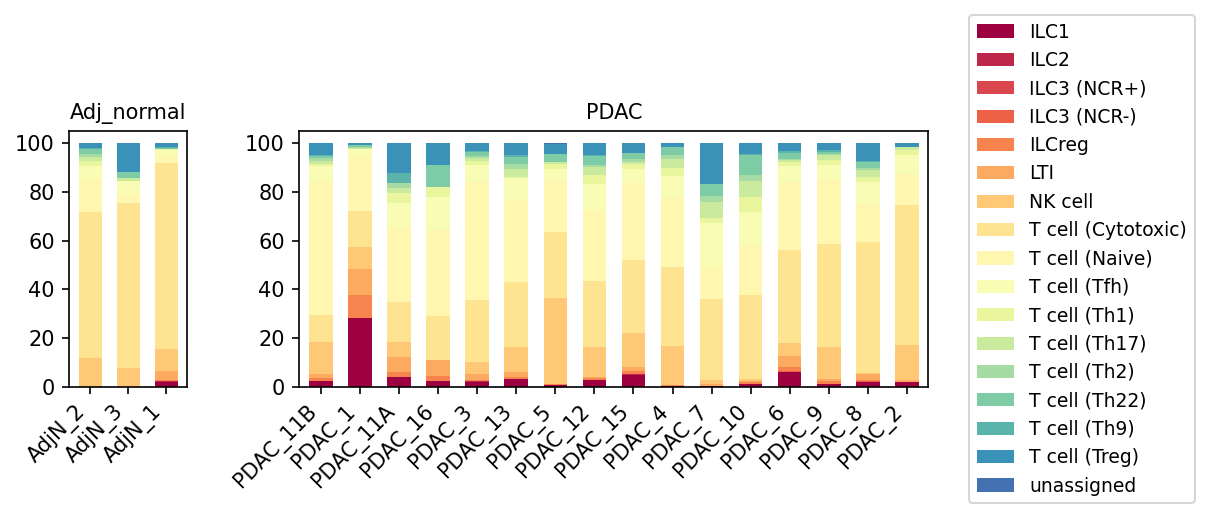
This analysis visualizes the proportional distribution of various T cell and related innate lymphoid cell (ILC) subsets within the overall 'T cell' major population across individual samples from both adjacent normal pancreas and Pancreatic Ductal Adenocarcinoma (PDAC) conditions. The aim is to identify shifts in immune cell composition associated with PDAC.
Visual Summary
The stacked bar plots display the relative proportions of T cell and ILC subsets for each sample. Samples are grouped by condition: 'Adj_normal' (3 samples) and 'PDAC' (13 samples).
- Adjacent Normal Pancreas (Adj_normal): The T cell compartment in adjacent normal tissue samples is predominantly composed of T cell (Naive) and T cell (Cytotoxic) populations. T cell (Treg) is also present but generally constitutes a smaller proportion. Other ILCs and helper T cell subsets are minimal.
- Pancreatic Ductal Adenocarcinoma (PDAC): A significant shift in the T cell subset composition is observed in PDAC samples compared to adjacent normal tissues.
- Expansion of Immunosuppressive Cells: T cell (Treg) (dark blue) shows a consistent and often increased presence across many PDAC samples, indicating a potential enrichment of these immunosuppressive cells within the tumor microenvironment.
- Increased Diversity and Presence of Innate Lymphoid Cells (ILCs): Various ILC subsets, including ILC1, ILC2, ILC3 (NCR+), ILC3 (NCR-), ILCreg, and LTI (represented by various shades of red and orange), are more frequently and prominently observed in PDAC samples, particularly ILC1 and ILC2 in certain tumors (e.g., PDAC_11B, PDAC_11A). This suggests an active involvement of the innate lymphoid compartment in PDAC.
- Variability in Conventional T cells: While T cell (Cytotoxic) and T cell (Naive) remain significant components, their proportions are more variable across PDAC samples, and in some cases, relatively reduced compared to the expansion of other subsets.
- Helper T cell Subsets: T cell (Th1), T cell (Th17), T cell (Th2) (various greens) are also present in PDAC samples, though generally in smaller proportions than the dominant T cell or ILC types.
- Inter-sample Heterogeneity: There is considerable heterogeneity in T cell and ILC subset compositions among individual PDAC samples, reflecting the diverse immune landscapes characteristic of this cancer.
Biological Interpretation
The observed shifts in T cell and ILC subset populations in PDAC highlight a complex immune reprogramming within the tumor microenvironment compared to normal pancreas.
- Immune Evasion and Immunosuppression: The consistent increase in T cell (Treg) populations in PDAC samples is a strong indicator of an immunosuppressive microenvironment. Tregs are crucial in suppressing anti-tumor immune responses, contributing to tumor immune evasion in pancreatic cancer [1].
- Innate Lymphoid Cell Involvement in PDAC: The expanded presence and diversity of ILCs (ILC1, ILC2, ILC3) in PDAC suggest their active participation in the disease pathology.
- ILC1s: Often associated with type 1 immunity and IFN-γ production, which can have anti-tumor effects. Their increase in some tumors might reflect an attempt at anti-tumor response or a pro-inflammatory state.
- ILC2s: Known for their role in type 2 immunity, tissue repair, and fibrosis. Given the highly desmoplastic nature of PDAC, an increase in ILC2s could contribute to the fibrotic stroma and potentially promote tumor progression or create an immunosuppressive environment [2].
- ILC3s: Are involved in inflammation and can exert both pro- and anti-tumor effects depending on the context, often linked to IL-17 and IL-22 production. Their presence could indicate chronic inflammation or specific responses within the PDAC niche.
- T Cell Exhaustion/Differentiation: The relative shift away from predominantly naive T cells towards more diverse effector and regulatory populations in PDAC suggests active immune cell recruitment, differentiation, and potentially exhaustion within the tumor. The variability in T cell (Cytotoxic) proportions could reflect differences in anti-tumor efficacy or the degree of immune suppression across tumors.
Clinical or Translational Implications
The distinct immune cell signatures observed have several potential clinical implications for PDAC:
- Prognostic Biomarkers: The specific composition and ratios of T cell and ILC subsets, particularly the elevated T cell (Treg) and ILC populations, could serve as prognostic biomarkers to predict disease aggressiveness and patient outcomes in PDAC [1].
- Therapeutic Targets: Targeting immunosuppressive cells like T cell (Treg) (e.g., via depletion or inhibition) could be a viable strategy to enhance anti-tumor immunity and improve the efficacy of existing therapies or immunotherapies in PDAC [3]. Understanding the precise roles of different ILC subsets in PDAC progression could also uncover novel therapeutic targets for modulating the tumor microenvironment.
- Response to Immunotherapy: The immune cell landscape, especially the balance between cytotoxic effector cells and immunosuppressive cells, can significantly influence a patient's response to immunotherapies like checkpoint inhibitors. Patients with a highly immunosuppressive TME (e.g., high Tregs, specific ILCs) might require combination therapies to overcome resistance.
---
References
- Regulatory T cells in pancreatic cancer:
- PubMed Search: Regulatory T cells pancreatic cancer prognosis
- ILC2s and fibrosis in cancer:
- PubMed Search: ILC2 fibrosis cancer
- Targeting Tregs in cancer immunotherapy:
- PubMed Search: Treg depletion cancer immunotherapy
8. Macrophages Subset Population Analysis in Pancreatic Ductal Adenocarcinoma (PDAC)
[Analysis Visualization Results]...
Analysis Overview
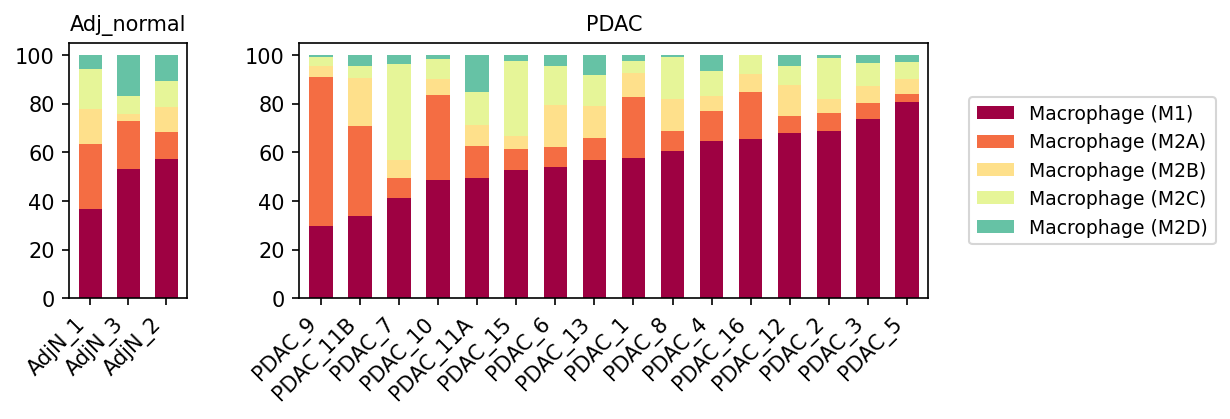
This analysis visualizes the proportional distribution of different macrophage subsets (M1, M2A, M2B, M2C, M2D) across individual samples from both "Adj_normal" (adjacent normal pancreas tissue) and "PDAC" (Pancreatic Ductal Adenocarcinoma) conditions. The aim is to understand the shifts in macrophage polarization within the tumor microenvironment compared to non-malignant tissue.
Visual Summary
The stacked bar plots display the relative proportions of macrophage subsets within each sample.
- Adj_normal Samples: In the adjacent normal pancreatic tissue samples (AdjN_1, AdjN_3, AdjN_2), Macrophage (M1) cells constitute a significant proportion (approximately 35-55%). Macrophage (M2A) is also prominent, making up about 10-30% of the macrophage population, while Macrophage (M2B), (M2C), and (M2D) contribute smaller but notable fractions. This suggests a mixed macrophage profile in the non-malignant pancreas, likely reflecting homeostatic and wound-healing functions.
- PDAC Samples: In contrast, the PDAC samples show a striking shift towards a strong dominance of Macrophage (M1) cells. In most PDAC samples, M1 macrophages account for over 60% of the total macrophage population, often reaching 70-80% (e.g., PDAC_1, PDAC_8, PDAC_4, PDAC_16, PDAC_12, PDAC_2, PDAC_3, PDAC_5). The proportions of M2A, M2B, M2C, and M2D subtypes are noticeably reduced across nearly all PDAC samples compared to the Adj_normal group. While some PDAC samples (e.g., PDAC_9, PDAC_11B, PDAC_7) exhibit slightly higher proportions of M2A and M2B than others within the PDAC group, M1 remains the largest single subset.
Biological Interpretation
Macrophages are critical components of the tumor microenvironment (TME) and are broadly classified into M1 (pro-inflammatory, anti-tumorigenic) and M2 (pro-tumoral, immune suppressive, tissue repair) phenotypes.
The observed predominance of Macrophage (M1) in PDAC samples is a notable finding, as tumor-associated macrophages (TAMs) in many solid tumors, including PDAC, are often reported to be skewed towards an M2-like phenotype, which promotes tumor growth, angiogenesis, and immune evasion [1].
Several biological interpretations can be considered for this observation:
- Persistent Pro-inflammatory Environment: The high proportion of M1 macrophages in PDAC might indicate a strong, sustained inflammatory response within the tumor, possibly driven by tumor-derived factors or ongoing immune activation. While M1 macrophages are classically associated with anti-tumor immunity, chronic inflammation can also contribute to tumor progression in some contexts [2].
- Functional State of M1 Macrophages: It is crucial to consider the functional state of these M1-like macrophages. While they express M1 markers, they might be functionally exhausted, anergic, or suppressed within the immune-modulatory PDAC TME, rendering them ineffective at tumor clearance. Further investigation into their activation state and cytokine profiles would be valuable.
- Heterogeneity of PDAC TME: The varying proportions of M1 dominance across different PDAC samples highlight the significant heterogeneity within PDAC tumors, suggesting that macrophage polarization can differ considerably between patients or even within different regions of a single tumor.
- Differences from Adjacent Normal Tissue: The distinct macrophage profiles between adjacent normal and PDAC tissue emphasize the profound changes in immune cell composition that occur during pancreatic carcinogenesis. The shift away from a more balanced M1/M2 profile in normal tissue towards M1 dominance in the tumor could reflect the specific immune pressures or signals present in the PDAC TME.
Clinical or Translational Implications
The distinct macrophage landscape observed in PDAC samples has several potential clinical and translational implications:
- Biomarker for Immune Subtyping: The robust presence of M1-like macrophages could serve as a biomarker for classifying PDAC patients into distinct immune subtypes. Patients with higher functional M1 populations might respond differently to immunotherapies compared to those with M2-dominant TAMs.
- Therapeutic Target: If these M1 macrophages are functionally active, strategies aimed at further enhancing their anti-tumor functions (e.g., through TLR agonists or IFN-gamma stimulation) could be explored. Conversely, if they are M1-like but functionally impaired, therapeutic approaches focused on reactivating or re-educating these cells might be beneficial [3].
- Understanding Treatment Resistance: The specific polarization state of macrophages could influence resistance or sensitivity to existing treatments, including chemotherapy and novel immunotherapies. Investigating the correlation between macrophage subsets and treatment response could lead to personalized treatment strategies.
- Prognostic Indicator: Future studies could explore if the proportion of M1 macrophages correlates with patient prognosis in PDAC, where a higher proportion of *functional* M1 cells might be associated with better outcomes, or conversely, if their presence indicates a more inflammatory and aggressive disease.
---
References:
- Tumor-Associated Macrophages in Pancreatic Cancer: [PubMed Search: "pancreatic cancer tumor-associated macrophages M1 M2"
- Chronic Inflammation and Cancer: [PubMed Search: "chronic inflammation cancer progression"
- Macrophage Reprogramming in Cancer Therapy: [PubMed Search: "macrophage reprogramming cancer therapy"
9. PDAC 조건에서 T 세포 아형 및 관련 림프구 집단의 변화 분석
[Analysis Visualization Results]...
Analysis Overview
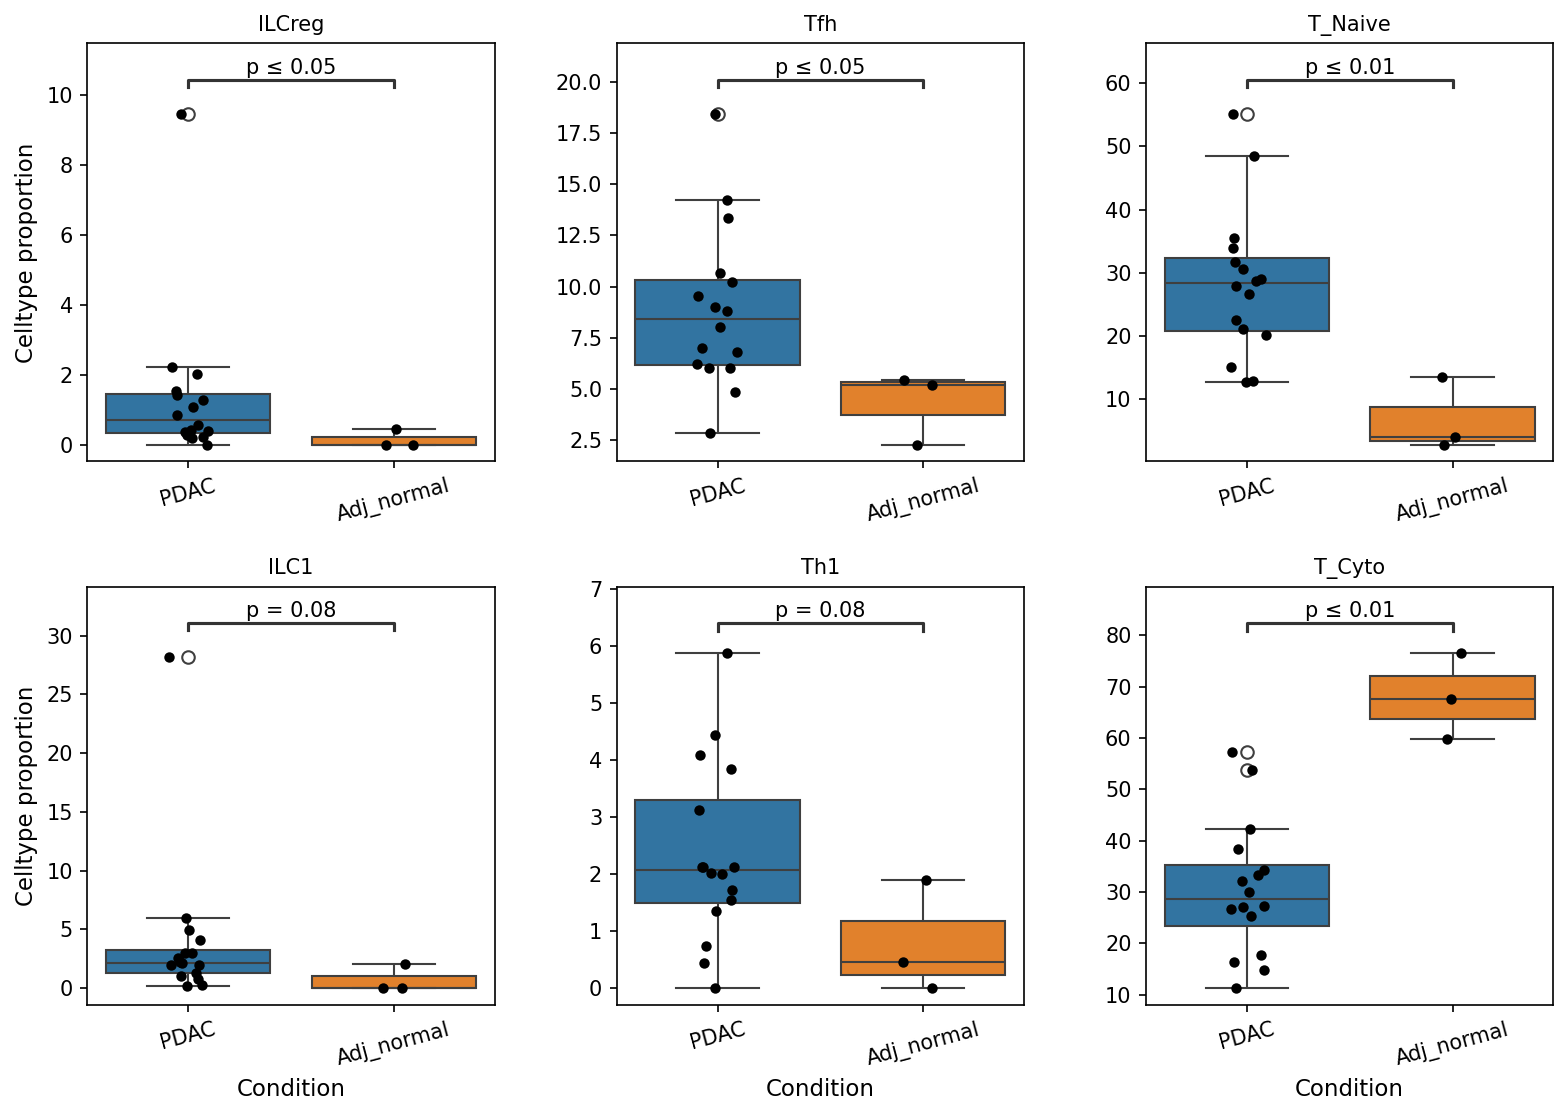
본 분석은 단일 세포 RNA 시퀀싱 데이터를 활용하여 췌장암(PDAC) 조직과 인접 정상(Adj_normal) 조직 간의 T 세포 아형 및 일부 관련 림프구 집단의 상대적 비율 차이를 비교한 결과입니다. celltype_major가 'T cell'인 세포들을 대상으로 celltype_subset 수준에서 각 아형의 비율 변화를 박스 플롯으로 시각화하고 통계적 유의성을 평가했습니다.
Visual Summary
제공된 박스 플롯은 6가지 림프구 아형(ILCreg, Tfh, T_Naive, ILC1, Th1, T_Cyto)의 PDAC 및 Adj_normal 조직 내에서의 비율 분포를 보여줍니다. 각 플롯에는 개별 샘플의 데이터 포인트(점), 중앙값(박스 안의 선), 사분위수 범위(박스), 및 이상치(동그라미)가 표시되어 있습니다. 주요 관찰 결과는 다음과 같습니다:
- ILCreg (조절형 선천성 림프구): PDAC 조직에서 Adj_normal 조직에 비해 통계적으로 유의미하게 높은 비율을 보였습니다 (p ≤ 0.05).
- Tfh (여포성 T 도우미 세포): PDAC 조직에서 Adj_normal 조직에 비해 통계적으로 유의미하게 높은 비율을 보였습니다 (p ≤ 0.05).
- T_Naive (미분화 T 세포): PDAC 조직에서 Adj_normal 조직에 비해 통계적으로 유의미하게 높은 비율을 보였습니다 (p ≤ 0.01).
- ILC1 (제1형 선천성 림프구): PDAC 조직에서 Adj_normal 조직에 비해 증가하는 경향을 보였으나, 통계적 유의성은 낮았습니다 (p = 0.08).
- Th1 (제1형 T 도우미 세포): PDAC 조직에서 Adj_normal 조직에 비해 증가하는 경향을 보였으나, 통계적 유의성은 낮았습니다 (p = 0.08).
- T_Cyto (세포독성 T 세포): Adj_normal 조직에서 PDAC 조직에 비해 통계적으로 유의미하게 높은 비율을 보였습니다 (p ≤ 0.01). 즉, PDAC 조직에서는 세포독성 T 세포의 비율이 현저히 낮게 나타났습니다.
참고: ILCreg 및 ILC1은 T 세포와는 다른 계통의 선천성 림프구(Innate Lymphoid Cells)이지만, 본 분석 결과에 포함되어 함께 해석되었습니다.
Biological Interpretation
이 결과는 췌장암(PDAC)의 종양 미세환경(TME)에서 T 세포 및 관련 림프구 집단 구성에 중요한 변화가 있음을 시사합니다.
- 세포독성 T 세포(T_Cyto)의 감소: 가장 두드러진 발견은 PDAC 조직에서 종양 세포 살상에 핵심적인 역할을 하는 세포독성 T 세포의 비율이 현저히 감소한다는 것입니다. 이는 PDAC TME가 강력한 면역 억제 환경임을 명확하게 보여주며, 항종양 면역 반응이 효과적으로 작동하지 못하고 있음을 나타냅니다 PubMed search: Pancreatic cancer immune evasion cytotoxic T cells.
- 미분화 T 세포(T_Naive)의 증가: PDAC에서 미분화 T 세포의 비율이 증가하는 것은, 종양으로 유입되는 T 세포들이 효과적인 종양 반응성 T 세포로 분화 및 활성화되지 못하고 있음을 시사할 수 있습니다. 이는 TME 내의 면역 억제 요인(예: 조절 T 세포, 골수 유래 억제 세포, 면역 체크포인트 분자)으로 인해 T 세포 활성화가 저해되기 때문일 수 있습니다.
- Tfh 세포의 증가: Tfh 세포는 주로 B 세포 반응을 조절하며 항체 생산을 돕는 역할을 합니다 GeneCards: TFC. PDAC TME 내 Tfh 세포의 증가는 종양 관련 3차 림프 구조 형성 또는 특정 B 세포 반응의 변화와 관련될 수 있지만, 고형암에서의 Tfh 역할은 복잡하고 문맥 의존적입니다. 일부 연구에서는 Tfh가 항종양 면역에 기여하거나, B 세포를 통해 종양 진행을 촉진할 수도 있음을 제시합니다.
- 조절형 선천성 림프구(ILCreg)의 증가: ILCreg는 면역 억제 기능을 수행하는 것으로 알려져 있으며, 이들의 증가는 PDAC의 면역 억제 TME 형성에 기여할 수 있습니다 PubMed search: Regulatory ILCs cancer.
- ILC1 및 Th1 세포의 경미한 증가 경향: ILC1 및 Th1 세포는 주로 IFN-γ를 생산하여 세포 매개 면역 반응 및 항종양 반응을 유도하는 것으로 알려져 있습니다. 이들의 증가 경향은 면역 체계가 종양에 대항하려는 시도를 반영할 수 있으나, 동시에 세포독성 T 세포의 감소가 관찰되므로, 이러한 방어 메커니즘이 PDAC의 강력한 면역 억제 환경에 의해 극복되고 있을 가능성을 시사합니다.
전반적으로, PDAC TME는 세포독성 T 세포가 고갈되고 미분화 T 세포, Tfh 세포, 조절형 선천성 림프구가 증가하는 특징적인 면역 프로파일을 가지는 것으로 해석됩니다. 이는 췌장암의 진행에 중요한 면역 회피 메커니즘을 형성합니다.
Clinical or Translational Implications
- 면역 치료 저항성: 세포독성 T 세포의 현저한 감소는 PDAC가 현재의 면역 체크포인트 억제제(ICI) 치료에 대체로 저항성을 보이는 이유를 설명하는 데 기여합니다. ICI는 T 세포 활성화를 증폭시키지만, 효과적인 T 세포가 부족한 환경에서는 그 효과가 제한적일 수 있습니다.
- 새로운 치료 전략 개발: PDAC TME의 이러한 면역 프로파일은 새로운 면역 치료 전략 개발의 필요성을 강조합니다. 예를 들어, T 세포 유입 및 활성화를 촉진하는 전략(예: 종양 용해 바이러스, CAR T 세포 치료 병용 요법), 미분화 T 세포의 분화를 유도하는 전략, 또는 면역 억제 세포(ILCreg, 골수 유래 억제 세포 등)를 표적화하는 전략이 고려될 수 있습니다.
- 바이오마커로서의 잠재력: T 세포 아형의 비율 변화, 특히 T_Cyto/T_Naive 비율 또는 특정 면역 억제 림프구(ILCreg)의 비율은 PDAC 환자의 예후 예측 또는 치료 반응 바이오마커로서의 잠재력을 가질 수 있습니다.
10. Ductal Cell (Tumor-Origin) and Unassigned Cell Ploidy Population Analysis in Pancreatic Tissue
[Analysis Visualization Results]...
Analysis Overview
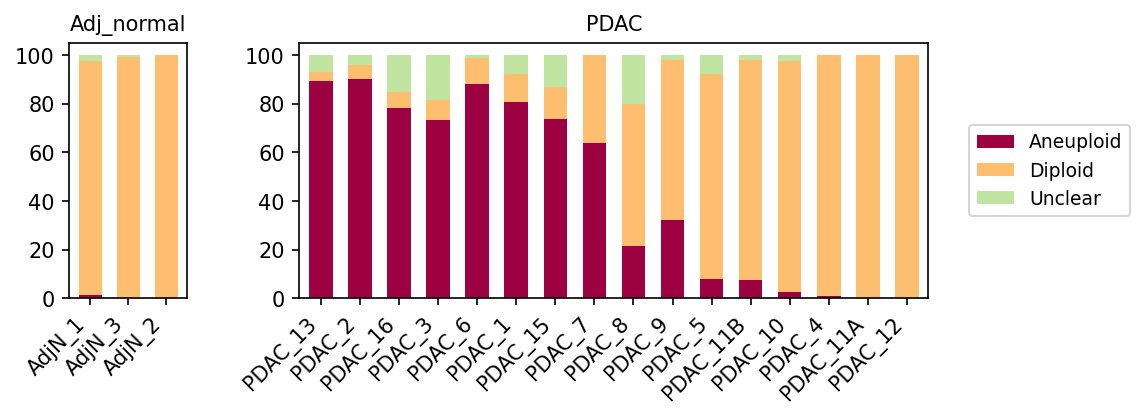
이 분석은 인접 정상(Adj_normal) 및 췌장 선암(PDAC) 조건에서 췌장 조직의 Ductal cell (종양 기원 세포)과 unassigned cells의 핵형(ploidy) 분포를 평가한 것입니다. Single-cell RNA-seq 데이터를 기반으로 각 샘플 내 세포 집단의 이수성(Aneuploid), 이배성(Diploid) 및 불명확(Unclear) 핵형 비율을 비교하여, 종양 발생 및 진행에 따른 게놈 불안정성을 탐색합니다.
Visual Summary
제공된 바 플롯은 인접 정상 및 PDAC 샘플에서 Ductal cell과 unassigned cells의 ploidy 분포를 보여줍니다.
- 인접 정상(Adj_normal) 샘플: 세 개의 모든 인접 정상 샘플(AdjN_1, AdjN_3, AdjN_2)에서 세포의 거의 100%가 이배성(Diploid, 연한 주황색) 핵형을 나타냈습니다. 아주 소수의 불명확(Unclear, 연한 녹색) 세포가 관찰되었으며, 이수성(Aneuploid, 암적색) 세포는 거의 존재하지 않았습니다. 이는 정상 조직 세포의 예상되는 핵형 분포입니다.
PDAC 샘플
- 많은 PDAC 샘플(예: PDAC_13, PDAC_2, PDAC_16, PDAC_3, PDAC_6, PDAC_1, PDAC_15, PDAC_7, PDAC_8)에서 이수성 세포(Aneuploid)의 비율이 매우 높게 나타났습니다. 특히 일부 샘플에서는 이수성 세포가 전체 세포의 90%에 육박하는 높은 비율을 차지했습니다.
- 반면, 다른 PDAC 샘플(예: PDAC_9, PDAC_5, PDAC_11B, PDAC_10, PDAC_4, PDAC_11A, PDAC_12)에서는 이배성 세포(Diploid)가 지배적이며, 이수성 세포의 비율이 인접 정상 샘플과 유사하거나 매우 낮게 관찰되었습니다.
- 일부 PDAC 샘플에서는 불명확(Unclear) 핵형 세포의 비율이 인접 정상 샘플에 비해 다소 높게 나타나기도 했지만, 일반적으로는 이수성 또는 이배성 세포에 비해 소수였습니다.
Biological Interpretation
- 종양 특이적 이수성: Ductal cell은 췌장 선암(PDAC)의 종양 기원 세포로 명시되어 있습니다. 이수성은 비정상적인 염색체 수의 상태로, 암의 대표적인 특징 중 하나인 게놈 불안정성의 결과로 나타납니다 GeneCards: Aneuploidy. PDAC 샘플에서 두드러지게 높은 이수성 세포의 비율은 이러한 종양 기원 세포들이 악성 전환을 겪었음을 강력하게 시사합니다.
- 정상 조직의 안정성: 인접 정상 샘플에서 관찰된 이배성 핵형의 지배는 건강한 췌장 조직에서 Ductal cell 및 기타 세포(unassigned cells)가 정상적인 게놈 안정성을 유지하고 있음을 확인시켜 줍니다.
- PDAC의 이질성: PDAC 샘플 간 이수성 세포 비율의 현저한 차이는 췌장암의 높은 종양 내 및 종양 간 이질성을 반영합니다. 일부 환자에서는 암세포가 광범위한 게놈 불안정성을 보이며 이수성 세포가 지배적인 반면, 다른 환자에서는 종양 미세환경에 있는 비악성 세포의 비율이 높거나, 종양 자체가 비교적 낮은 수준의 이수성을 가질 수 있음을 의미합니다. 'unassigned' 세포 집단 역시 이러한 이질성에 기여할 수 있으며, 이들 중 일부는 분류하기 어려운 종양 세포이거나 종양 미세환경의 영향을 받은 세포일 수 있습니다.
- 세포 유형 고려: Ductal cell이 종양 기원 세포라는 점을 감안할 때, PDAC 샘플에서 관찰되는 이수성 세포들은 주로 형질 전환된 Ductal cell에서 유래했을 가능성이 높습니다.
Clinical or Translational Implications
- 진단 및 예후 바이오마커: PDAC 샘플에서 이수성 세포의 존재는 악성 종양의 강력한 지표입니다. 높은 이수성 비율은 PDAC의 진행성 및 좋지 않은 예후와 연관될 수 있으므로 PubMed search: PDAC aneuploidy prognosis, 진단 및 예후 예측을 위한 잠재적인 바이오마커로 활용될 수 있습니다.
- 치료 전략: PDAC 환자 간 이수성 수준의 차이는 맞춤형 치료 전략의 필요성을 강조합니다. 높은 이수성을 보이는 종양은 게놈 불안정성을 표적으로 하는 약물(예: PARP 억제제)에 더 잘 반응할 수 있는 반면, 이배성 종양은 다른 치료 접근법이 필요할 수 있습니다 PubMed search: aneuploidy cancer therapy.
- 종양 진화 연구: 이수성 세포 집단의 동적 변화를 추적하는 것은 PDAC의 종양 진화 경로를 이해하고 치료 저항성 메커니즘을 밝히는 데 중요할 수 있습니다.
- 종양 세포 식별: 단일 세포 수준에서 ploidy 정보를 활용하여 종양 세포와 비종양 세포를 더욱 정확하게 구분하는 데 기여할 수 있습니다. 이는 특히 종양 미세환경 분석에서 중요합니다.
11. PDAC 조건에서의 세포-세포 상호작용 패턴 분석
[Analysis Visualization Results]...
Analysis Overview
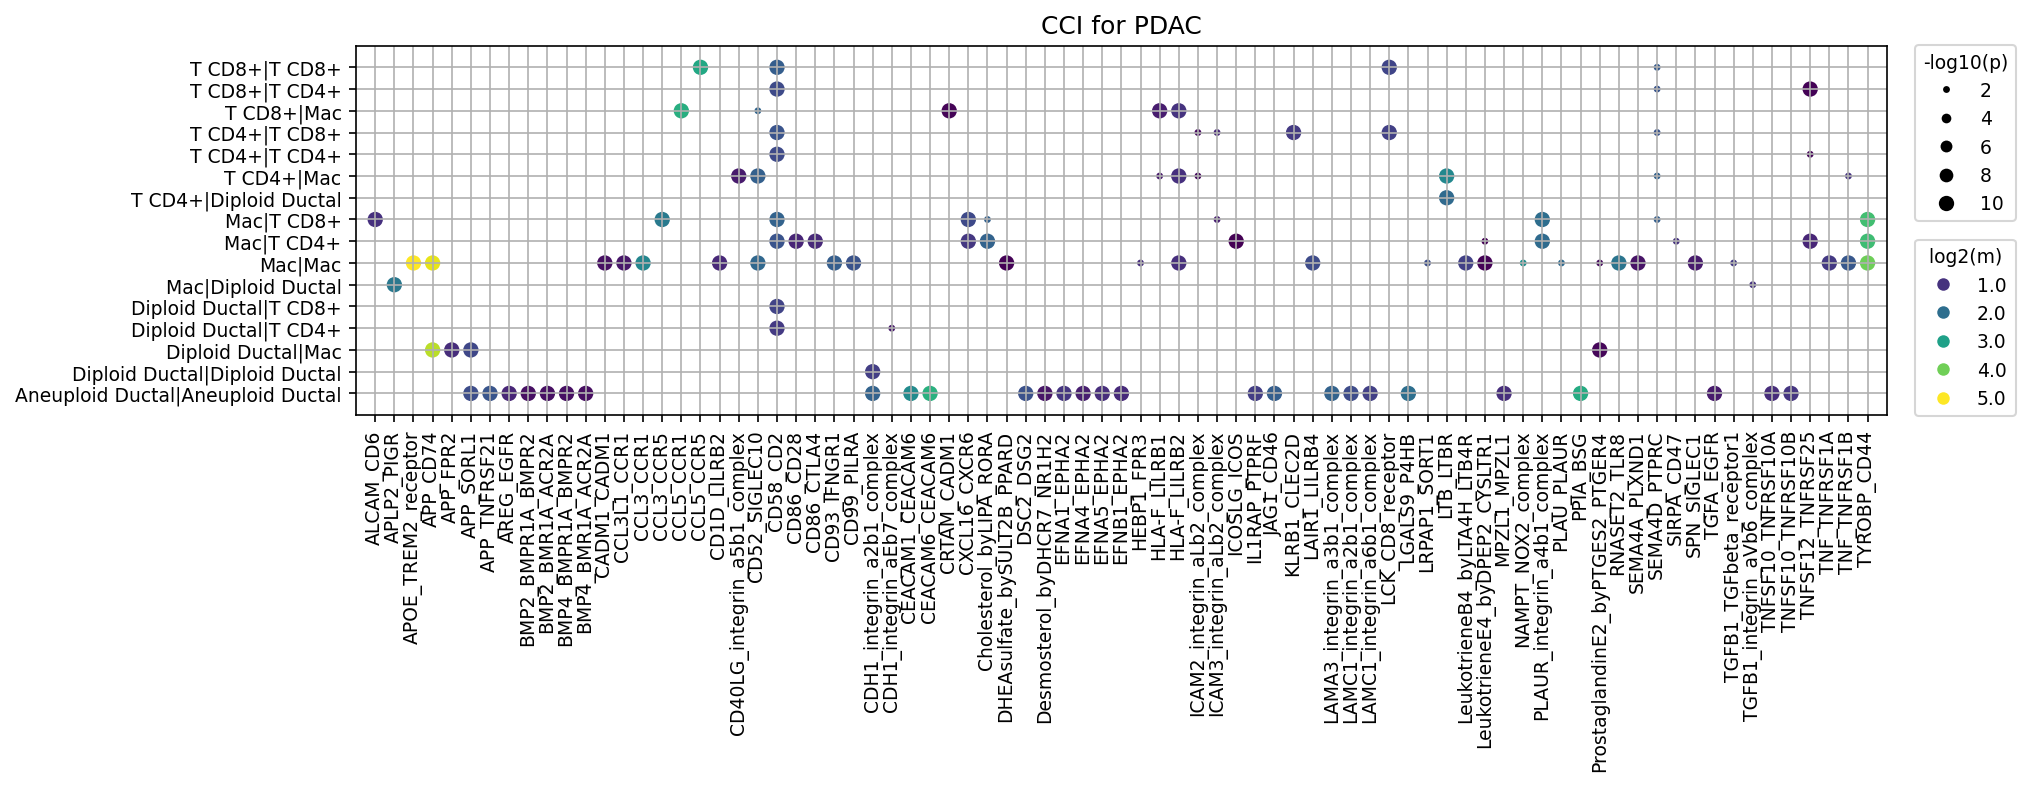
이 분석은 췌장암(PDAC) 조건에서 특정 세포 유형 간의 세포-세포 상호작용(CCI) 패턴을 CellPhoneDB를 사용하여 시각화한 결과입니다. 주요 관심 세포 유형은 Ductal cell, Fibroblast, Macrophage, T cell CD4+, T cell CD8+였습니다. 특히, 암세포의 근원인 Ductal cell은 ploidy(염색체 수성)에 따라 Diploid Ductal과 Aneuploid Ductal로 세분화되어 분석되었습니다. 그림은 각 세포쌍 간의 상호작용에 대한 통계적 유의성(-log10(p))과 평균 발현 강도(log2(m))를 나타내며, PDAC 미세환경의 복잡한 통신 네트워크를 조명합니다.
Visual Summary
주어진 CellPhoneDB 닷 플롯은 PDAC 조건에서 상위 80개 세포-세포 상호작용 쌍을 보여줍니다.
- Aneuploid Ductal cell의 두드러진 활성: 'Aneuploid Ductal|Aneuploid Ductal' 상호작용 쌍이 가장 많은 수의 강력한(높은 평균 발현과 낮은 p-value) 자가분비(autocrine) 및 측분비(paracrine) 상호작용을 나타냈습니다. 이는 BMP2/4-BMPR1A/BMPR2, AREG-EGFR, TGFA-EGFR, TGFB1-TGFBR1, 다양한 EPHA/EFNA/EFNB 및 CDH1/LAMC1-integrin 복합체 상호작용을 포함합니다. 이들 상호작용은 주로 노란색(높은 log2(m))과 큰 점(낮은 p-value)으로 표시되어 매우 활발함을 시사합니다.
- Macrophage의 핵심 역할: 'Mac|Mac' 상호작용 쌍에서 APOE-TREM2_receptor, APP-CD74, APP-FPR2, 그리고 여러 CCL-CCR 케모카인 신호가 강력하게 관찰되었습니다. 이는 Macrophage 간의 활발한 자가분비/측분비 통신을 나타냅니다. 또한 'Mac|Diploid Ductal' 및 'Diploid Ductal|Mac' 쌍에서도 CCL-CCR 케모카인 및 TGFB1-TGFBR1과 같은 상호작용이 나타났습니다.
- T cell-Macrophage 상호작용: 'T CD4+|Mac' 및 'T CD8+|Mac' 쌍에서 CD86-CD28 및 CD86-CTLA4와 같은 면역 조절 상호작용이 나타났으며, 이는 T 세포 활성화 및 억제 메커니즘이 존재함을 시사합니다.
- Fibroblast 상호작용의 부재: 분석에 Fibroblast가 포함되었음에도 불구하고, 표시된 상위 80개 상호작용에서는 Fibroblast가 관여하는 세포쌍이 눈에 띄게 나타나지 않았습니다. 이는 Fibroblast의 상호작용이 이 특정 조건 및 필터링 기준에서 다른 세포 유형만큼 지배적이지 않거나, 다른 유형의 상호작용이 더 우선적으로 랭크되었음을 의미할 수 있습니다.
- Diploid Ductal cell 상호작용: 'Diploid Ductal|Diploid Ductal' 및 'Diploid Ductal|T CD4+', 'Diploid Ductal|Mac' 등에서 일부 상호작용이 관찰되었으나, Aneuploid Ductal cell에 비해 수와 강도 면에서 적거나 약한 경향을 보였습니다.
Biological Interpretation
PDAC의 종양 미세환경(TME)은 고도로 복잡하며, 다양한 세포 유형 간의 상호작용은 질병 진행에 필수적입니다.
- 악성 Ductal cell의 자율 성장 및 침습 촉진: 'Aneuploid Ductal|Aneuploid Ductal' 간의 광범위하고 강력한 상호작용은 악성 췌장 덕트 선암세포의 특징적인 자가분비 루프를 강조합니다.
- 성장 및 증식: AREG-EGFR GeneCards: EGFR 및 TGFA-EGFR 신호는 암세포의 증식 및 생존에 중요한 역할을 하는 것으로 알려져 있습니다.
- 줄기세포 특성 및 전이: BMP2/4-BMPR1A/BMPR2 신호는 암 줄기세포 특성과 종양 진행에 관여할 수 있습니다 PubMed search: BMP signaling PDAC.
- EMT 및 미세환경 조절: CDH1-integrin 및 LAMC1-integrin 복합체 상호작용은 세포 접착 및 상피-간엽 전이(EMT) 과정과 관련되어 종양 침습 및 전이를 촉진할 수 있습니다 PubMed search: Cadherin Integrin EMT cancer. EPHA/EFNA/EFNB 신호 또한 세포 이동 및 침습에 중요합니다.
- 면역억제 및 섬유화: TGFB1-TGFBR1 및 TGFB1-integrin_aVb6_complex는 PDAC TME에서 면역억제 및 섬유화를 촉진하는 핵심 경로입니다 PubMed search: TGFB1 PDAC.
- Macrophage 중심의 면역 조절 및 종양 지지: Macrophage는 PDAC TME에서 종양 관련 대식세포(TAM)로서 중요한 역할을 합니다.
- TAM 활성화: 'Mac|Mac' 간의 APOE-TREM2_receptor 상호작용은 TAM의 활성화 및 면역억제 기능에 기여할 수 있습니다 GeneCards: TREM2. TREM2는 TAMs의 생존, 증식 및 면역억제 표현형 유지에 중요합니다.
- 염증 및 TAM 모집: CCL-CCR 케모카인 상호작용은 TAM을 포함한 다양한 면역세포를 종양 부위로 모집하고 염증 반응을 조절합니다.
- T 세포 조절: Macrophage와 T 세포 간의 CD86-CD28(공동 자극) 및 CD86-CTLA4(공동 억제) 상호작용은 T 세포의 활성화 및 기능을 미세하게 조절하여 항종양 면역 반응을 억제할 수 있습니다.
- T 세포의 제한적인 항종양 반응: T 세포와 Ductal cell 간의 직접적인 강력한 상호작용이 적은 것은 PDAC TME에서 T 세포의 기능이 억제되거나 물리적으로 접근이 제한될 수 있음을 시사하며, 이는 PDAC의 면역 회피 특징과 일치합니다.
Clinical or Translational Implications
- Aneuploid Ductal cell 표적 치료: EGFR (AREG-EGFR, TGFA-EGFR), TGF-beta (TGFB1-TGFBR1), Ephrin (EPHA/EFNA/EFNB) 신호전달 경로는 Aneuploid Ductal cell에서 강력하게 활성화되어 있으므로, 이들 경로를 표적으로 하는 치료제(예: EGFR 저해제)는 PDAC 환자에게 직접적인 항암 효과를 제공할 잠재력이 있습니다. 특히, 기존 EGFR 저해제의 효능을 개선하거나, 다른 표적과 병용하는 전략이 고려될 수 있습니다.
- TAM 재프로그래밍을 통한 면역 강화: Macrophage 간의 APOE-TREM2_receptor 상호작용은 TAM의 면역억제 역할을 강화하는 중요한 경로일 수 있습니다. TREM2를 표적으로 하는 전략은 TAM을 항종양 표현형으로 재프로그래밍하여 면역항암치료의 효과를 높일 수 있는 잠재적인 치료 접근법이 될 수 있습니다.
- 미세환경 조절을 통한 전이 억제: Ductal cell 및 Macrophage에서 나타나는 Integrin 복합체 (CDH1-integrin, LAMC1-integrin, PLAUR-integrin) 상호작용은 세포의 접착, 이동, 침습 및 ECM 리모델링에 중요한 역할을 합니다. 이들 상호작용을 차단함으로써 종양의 전이를 억제하고 섬유화된 TME를 완화하여 약물 전달을 개선할 수 있습니다.
- 면역 체크포인트 조절 및 병용 요법: Macrophage와 T 세포 간의 CD86-CD28/CTLA4 상호작용은 면역 체크포인트 억제제 반응에 대한 중요한 정보를 제공합니다. PDAC에서 면역 체크포인트 억제제의 제한적인 효능을 고려할 때, 이러한 특정 상호작용을 조절하는 치료법(예: CTLA4 억제제)을 다른 TME 표적 치료와 병용하여 T 세포의 항종양 활성을 회복시키는 전략이 필요할 수 있습니다.
12. Condition-Specific Cell-Cell Interaction Patterns in Pancreatic Ductal Adenocarcinoma (PDAC)
[Analysis Visualization Results]...
Analysis Overview
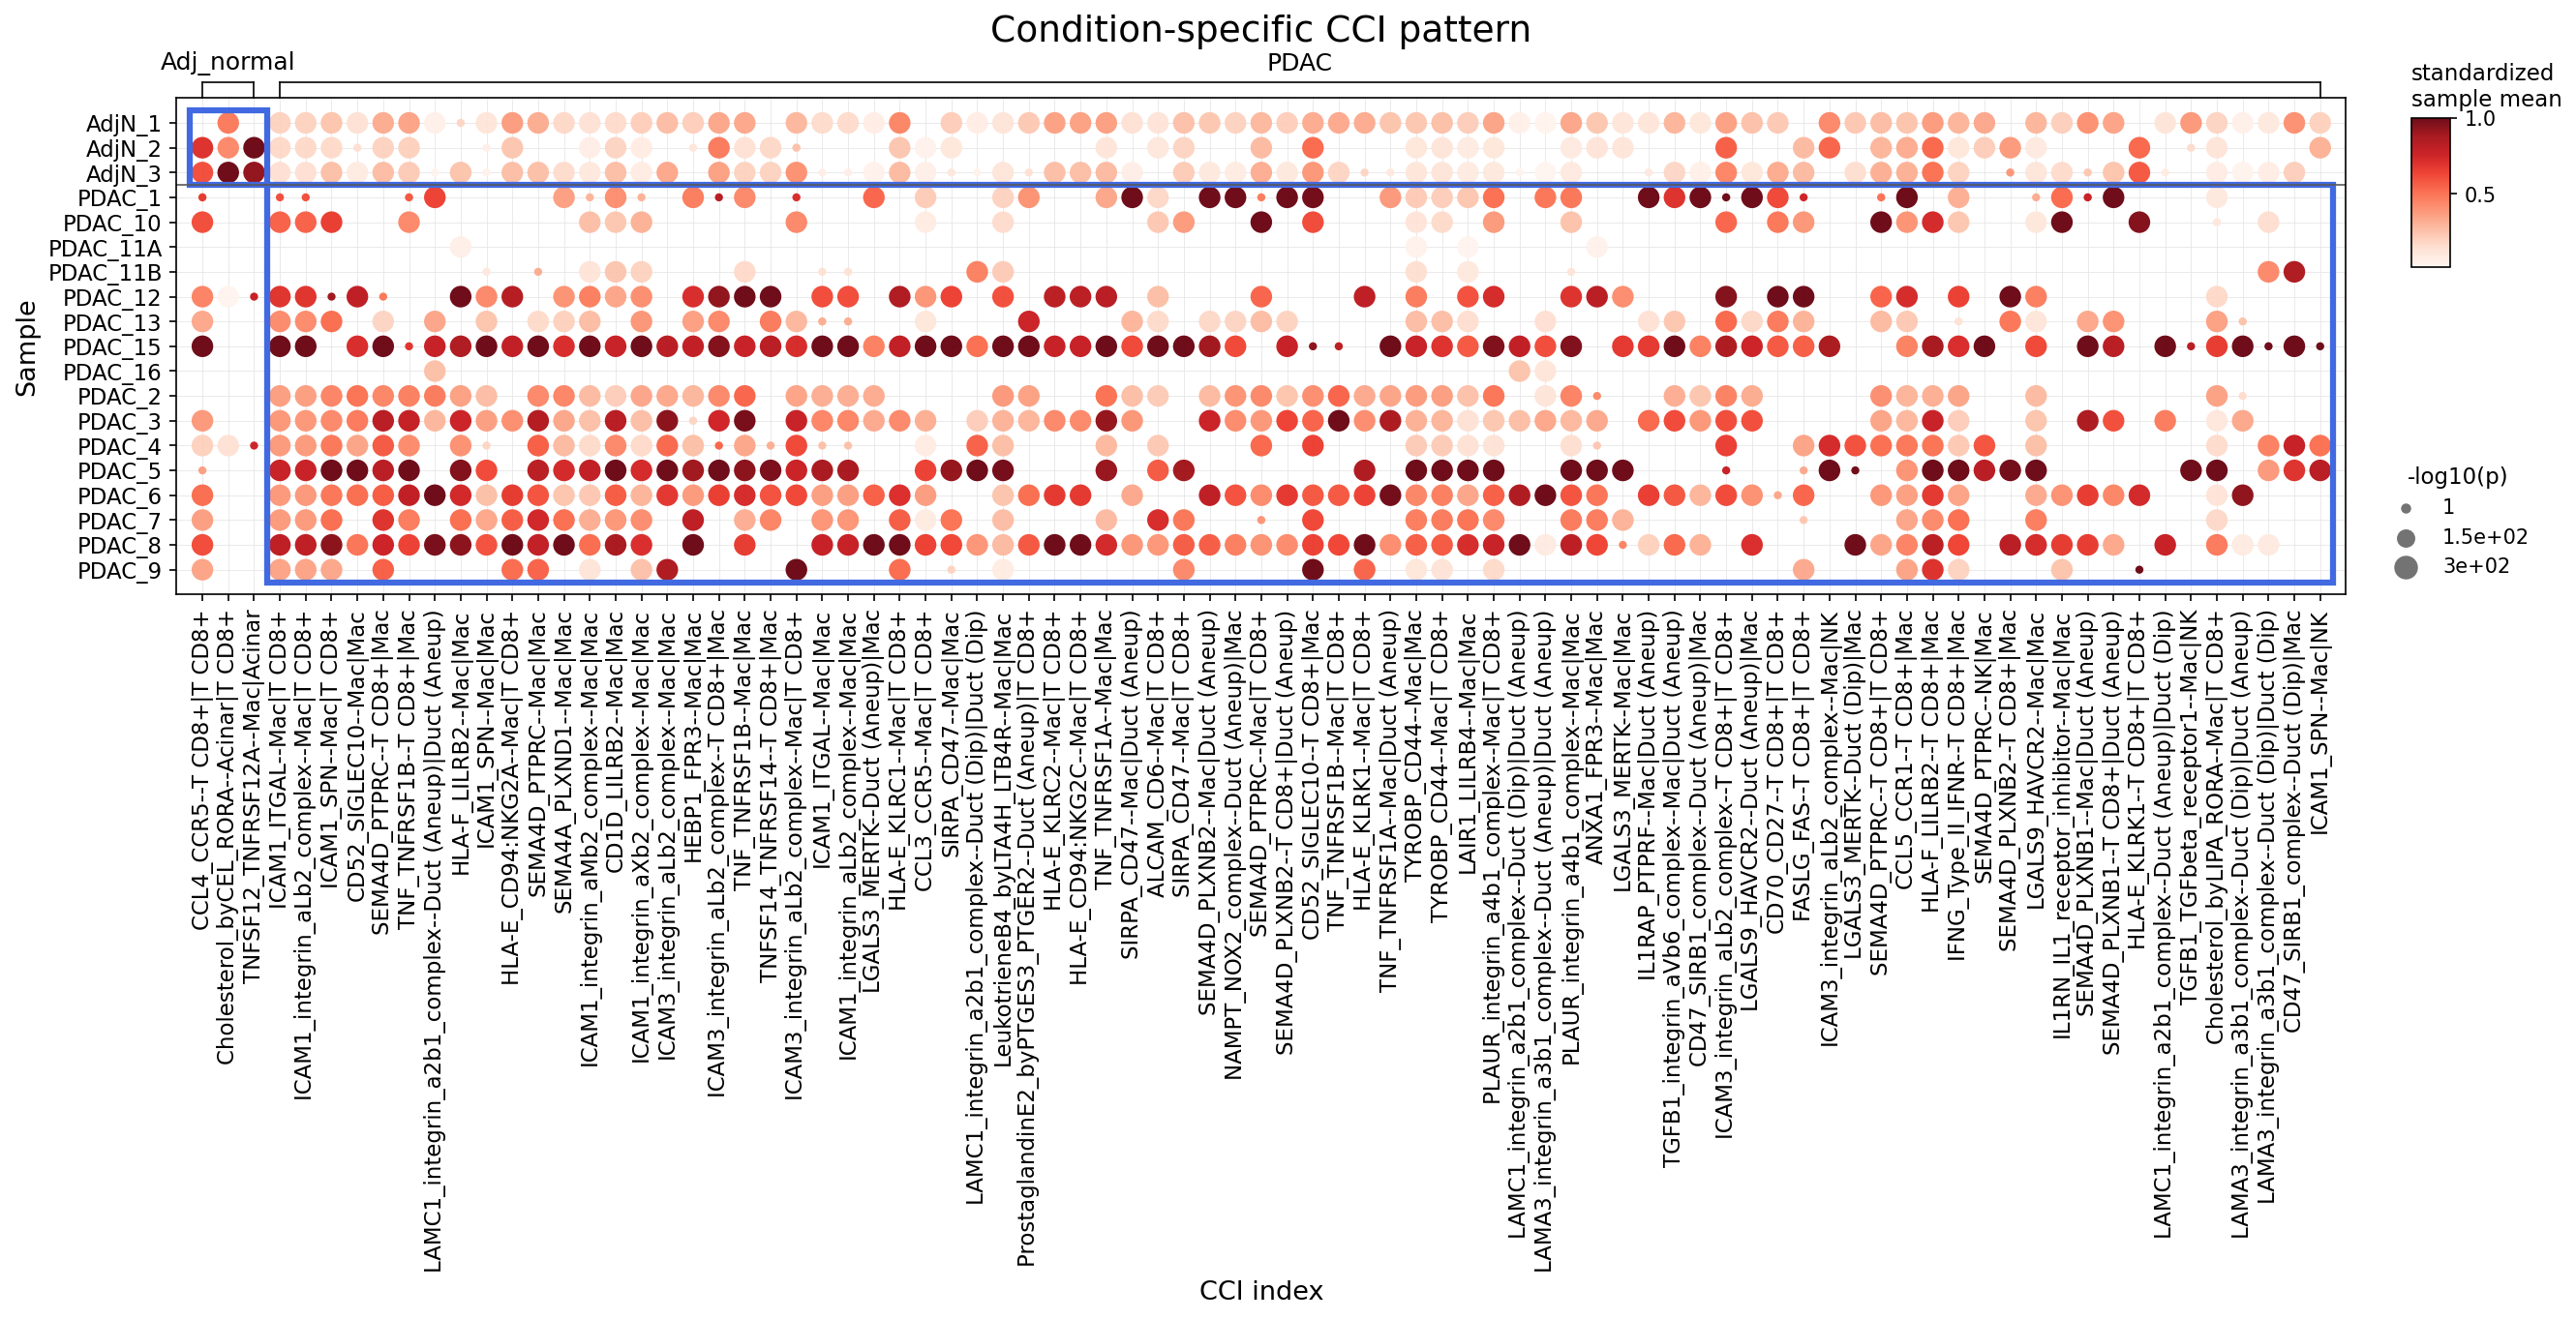
This analysis investigates the cell-cell interaction (CCI) landscape in pancreatic tissue, comparing healthy adjacent normal samples (Adj_normal) with Pancreatic Ductal Adenocarcinoma (PDAC) samples. Using single-cell RNA sequencing data, the plot_dot_for_cci_with_signif_difference tool was employed to identify and visualize the most significant CCIs (up to 80 per condition based on minimum p-value) across individual samples. The visualization displays the strength of interactions (standardized sample mean, color intensity) and their statistical significance (-log10(p-value), dot size) for various ligand-receptor pairs between specific cell types.
Visual Summary
The dot plot effectively illustrates distinct CCI patterns between the Adj_normal and PDAC conditions.
- Global Difference: Adj_normal samples (top 3 samples) generally exhibit fewer and weaker cell-cell interactions (paler dots, smaller sizes) across the displayed CCI indices compared to PDAC samples. This indicates a relatively quiescent intercellular communication network in healthy tissue.
- PDAC-Specific Activation: In stark contrast, PDAC samples show a widespread and intensified network of CCIs. Many ligand-receptor pairs demonstrate strong interaction strengths (deep red dots) and high statistical significance (large dot sizes) across numerous PDAC samples. This points to extensive remodeling of the tumor microenvironment (TME) in PDAC.
- Heterogeneity within PDAC: While most PDAC samples display robust CCI activity, there is noticeable inter-sample heterogeneity. Some PDAC samples (e.g., PDAC_1, PDAC_10, PDAC_11A/B, PDAC_12, PDAC_13, PDAC_15, PDAC_16) show a particularly high density of strong interactions, whereas others (e.g., PDAC_2 through PDAC_9) exhibit a somewhat less pronounced, though still elevated, interaction landscape compared to normal.
- Dominant Cell Types Involved: A significant proportion of the highlighted CCIs involve Macrophage cells (Mac), often interacting with T cell CD8+ cells (T CD8+), and Ductal cells (both Aneuploid and Diploid). This underscores the central role of immune cells, particularly macrophages and T cells, and the malignant ductal cells in shaping the PDAC TME.
Key Interaction Categories
- Integrin-mediated interactions: A prominent set of CCIs involves integrin complexes, such as ICAM1_integrin_aLb2_complex, LAMC1_integrin_a2b1_complex, and ICAM3_integrin_aLb2_complex. These are highly active in PDAC samples, mediating interactions between macrophages, T CD8+ cells, and ductal cells.
- Immune Modulatory Interactions: Several interactions related to immune regulation are observed, including CD52_SIGLEC10--Mac|T CD8+, HLA-E_CD94:NKG2A--Mac|T CD8+, SIRPA-CD47--Mac|Mac, and various TNF/TNFRSF family interactions.
- Ductal Cell-Specific Interactions: Interactions involving Duct (Aneuploid) cells, which are likely the cancerous population, demonstrate a strong presence in PDAC, such as LAMC1_integrin_a2b1_complex--Duct (Aneuploid)|Mac. These are crucial for understanding tumor-immune cell crosstalk.
Biological Interpretation
The observed condition-specific CCI patterns provide critical insights into the biological processes driving PDAC progression.
- Tumor Microenvironment Transformation: The dramatic increase in CCI activity in PDAC samples reflects the extensive biological rewiring within the tumor microenvironment. This transformation often facilitates tumor growth, immune evasion, and metastasis [PubMed search: Pancreatic cancer tumor microenvironment].
- Central Role of Macrophages in PDAC TME: The high frequency and strength of macrophage-mediated interactions, especially with T CD8+ cells and tumor-origin ductal cells, highlight macrophages as key orchestrators of the PDAC TME. Tumor-associated macrophages (TAMs) are known to promote tumor progression, angiogenesis, and immunosuppression in PDAC [PubMed search: Tumor associated macrophages PDAC].
- Integrin Signaling in Cancer Progression: The activation of various integrin-mediated CCIs (e.g., involving ICAM1, LAMC1) is significant. Integrins are crucial for cell adhesion, migration, and signaling, playing vital roles in tumor invasion, metastasis, and interaction with the extracellular matrix and immune cells [GeneCards: Integrin alpha L; GeneCards: ICAM1]. Their upregulation in PDAC suggests enhanced cell motility and stromal interactions.
- Ductal Cell Crosstalk with Immune Cells: Interactions involving Duct (Aneuploid) cells with macrophages (e.g., LAMC1_integrin_a2b1_complex) are particularly noteworthy. This direct communication between malignant epithelial cells and immune components can dictate tumor cell survival, proliferation, and immune escape. The distinction from Duct (Diploid) cells emphasizes the specific contributions of cancerous cells.
- Immune Evasion Mechanisms: Several identified interactions point towards mechanisms of immune evasion:
- CD47-SIRPA Axis: The strong SIRPA-CD47--Mac|Mac interaction is highly relevant. CD47 on cancer cells acts as a "don't eat me" signal to SIRPA on macrophages, inhibiting phagocytosis. Its activation in PDAC is a key strategy for immune escape [GeneCards: CD47].
- HLA-E-NKG2A Axis: The interaction HLA-E_CD94:NKG2A--Mac|T CD8+ suggests an inhibitory pathway for T cells and NK cells. HLA-E expression by tumor cells or antigen-presenting cells can engage NKG2A on T/NK cells, suppressing anti-tumor immunity [GeneCards: HLA-E].
- SIGLEC10-CD52: The CD52_SIGLEC10--Mac|T CD8+ interaction also implicates immune modulation. SIGLEC10, expressed on macrophages and other immune cells, often acts as an inhibitory receptor [GeneCards: SIGLEC10].
- T Cell Engagement and Dysfunction: While T CD8+ cells are critical for anti-tumor immunity, their extensive involvement in CCIs with macrophages and tumor cells in PDAC could reflect either an ongoing but potentially ineffective immune response or the induction of T cell exhaustion within the immunosuppressive TME.
Clinical or Translational Implications
The detailed characterization of condition-specific CCIs in PDAC offers significant clinical and translational opportunities.
- Novel Therapeutic Targets: The identified highly active CCIs, particularly those driving immunosuppression (e.g., CD47-SIRPA, HLA-E-NKG2A) or tumor progression (e.g., integrin-mediated interactions), represent promising targets for therapeutic intervention in PDAC.
- Targeting integrins could disrupt tumor-stroma interactions and metastasis [PubMed search: Integrin inhibitors cancer therapy PDAC].
- Blocking the CD47-SIRPA axis or the HLA-E-NKG2A axis could reactivate anti-tumor immunity, potentially overcoming resistance to existing immunotherapies [PubMed search: CD47 SIRPA therapy cancer].
- Biomarker Discovery: The distinct CCI signatures observed in PDAC, especially those involving Aneuploid Ductal cells, could serve as novel diagnostic or prognostic biomarkers. Monitoring the activity of these interactions might provide insights into disease progression or response to treatment.
- Combination Immunotherapy Strategies: Given the complex and often redundant nature of the PDAC TME, combination therapies that simultaneously target multiple critical CCI pathways (e.g., immune checkpoints, integrin signaling, and macrophage polarization) may offer superior efficacy compared to monotherapies.
- Understanding Treatment Resistance: Investigating changes in these CCI patterns in response to current therapies (e.g., chemotherapy, radiation, or emerging immunotherapies) could reveal mechanisms of treatment resistance and guide the development of adaptive therapeutic strategies.
13. Immune Checkpoint and Cell Cycle Related Cell-Cell Interactions in Pancreatic Tissue
[Analysis Visualization Results]...
Analysis Overview
This analysis utilizes single-cell RNA sequencing data from pancreatic tissue (human) to identify cell-cell interactions (CCI) involving a predefined set of immune checkpoint and cell cycle-related genes. The interactions are visualized using dot plots, comparing two conditions: "Adj_normal" (adjacent normal tissue) and "PDAC" (Pancreatic Ductal Adenocarcinoma). The objective is to understand how these critical pathways mediate cell communication in both healthy and diseased pancreatic microenvironments.
Visual Summary
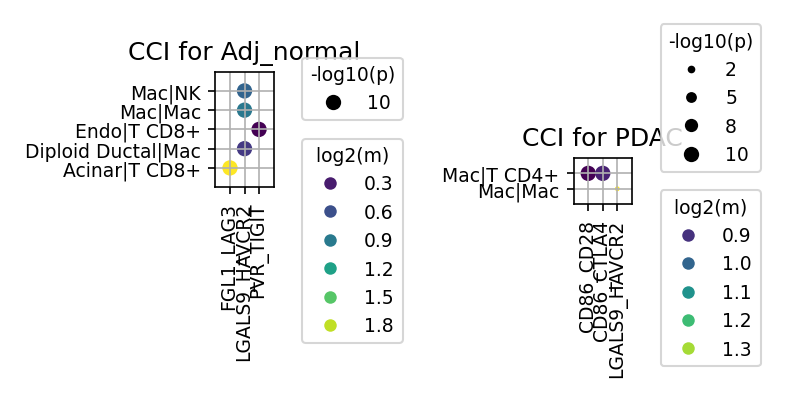
The analysis produced two dot plots, one for the "Adj_normal" condition and one for the "PDAC" condition, displaying significant cell-cell interaction pairs and the associated ligand-receptor interactions. The size of each dot represents the -log10(p-value) of the interaction, indicating statistical significance, while the color intensity reflects the log2(mean) expression of the interacting gene pair, indicating interaction strength.
Adj_normal Condition
- The plot for "Adj_normal" shows several significant interactions involving macrophages (Mac), NK cells, Endothelial cells, CD8+ T cells, Diploid Ductal cells, and Acinar cells.
- Key ligand-receptor pairs identified include FGL1-LAG3, LGALS9-HAVCR2, and PVR-TIGIT.
- Notably, strong and significant interactions are observed for Acinar cells with CD8+ T cells via FGL1-LAG3, and Endothelial cells with CD8+ T cells via LGALS9-HAVCR2. Diploid Ductal cells also interact with Macrophages via PVR-TIGIT.
- These interactions predominantly involve immune checkpoint molecules, suggesting baseline immune regulatory mechanisms within the healthy pancreatic tissue.
PDAC Condition
- The plot for "PDAC" shows a more focused set of interactions, primarily involving Macrophages (Mac) and CD4+ T cells.
- The dominant ligand-receptor pairs identified are CD86-CD28, CD86-CTLA4, and LGALS9-HAVCR2.
- Macrophages show significant interactions with CD4+ T cells through both co-stimulatory (CD86-CD28) and co-inhibitory (CD86-CTLA4) pathways, highlighting a complex regulatory environment.
- Macrophages also exhibit self-interactions (Mac|Mac) via LGALS9-HAVCR2, similar to observations in the normal condition, although the cell partners and context differ.
- Compared to "Adj_normal," the diversity of interacting cell types and gene pairs appears reduced in PDAC, but the interactions observed are highly relevant to immune modulation within the tumor microenvironment.
- It is noteworthy that none of the requested cell cycle genes appeared in the significant CCI results for either condition, suggesting their primary roles may not be in direct ligand-receptor mediated cell-cell communication captured by CellPhoneDB, or their interaction levels did not meet the specified cutoffs.
Biological Interpretation
The analysis highlights distinct patterns of immune checkpoint-related cell-cell interactions between healthy adjacent pancreatic tissue and PDAC.
- Baseline Immune Regulation in Adj_normal Tissue:
- The presence of FGL1-LAG3 interactions between Acinar cells and CD8+ T cells suggests that even in normal tissue, there are mechanisms to modulate T cell activity, potentially preventing overt inflammation or maintaining immune homeostasis [PubMed: FGL1 LAG3 interaction].
- Similarly, LGALS9-HAVCR2 (Tim-3) interactions between Endothelial cells and CD8+ T cells, and PVR-TIGIT interactions between Diploid Ductal cells and Macrophages, point to a well-orchestrated suppressive network that maintains immune tolerance in the healthy pancreas [UniProt: HAVCR2].
- The involvement of Diploid Ductal cells in these interactions indicates that even non-immune resident cells contribute to the immune landscape in normal conditions.
- Altered Immune Checkpoint Landscape in PDAC:
- In PDAC, the interactions shift to emphasize macrophage-T cell axis. The co-existence of CD86-CD28 (co-stimulation) and CD86-CTLA4 (co-inhibition) interactions between Macrophages and CD4+ T cells is a hallmark of immune regulation in the tumor microenvironment [GeneCards: CTLA4]. This balance determines the activation or suppression of T cell responses. Tumor-associated macrophages often contribute to immune suppression, and the CTLA4 pathway is a critical negative regulator of T cell activation.
- The persistent LGALS9-HAVCR2 interaction within Macrophages (Mac|Mac) in PDAC, as well as its presence in the normal condition (Endo|T CD8+), underscores the significance of the Galectin-9/Tim-3 axis in immune modulation, potentially contributing to macrophage polarization or regulatory functions in both contexts.
- Absence of Cell Cycle Gene Interactions:
- The absence of cell cycle-related genes in the significant CCI results is important. While genes like CDK1, MKI67, and PCNA are crucial for cell proliferation, their primary functions are intracellular. CellPhoneDB, which identifies ligand-receptor interactions, is less likely to detect direct cell-cell communication mediated by these intracellular cell cycle regulators. This reinforces that the observed interactions are specifically related to surface-expressed immune checkpoint molecules.
Clinical or Translational Implications
The differential patterns of immune checkpoint interactions between "Adj_normal" and "PDAC" conditions have significant clinical and translational implications for pancreatic cancer immunotherapy.
- Therapeutic Target Prioritization:
- The prominent involvement of CD86-CTLA4 and LGALS9-HAVCR2 (Tim-3) interactions in PDAC suggests that targeting these pathways could be therapeutically beneficial. CTLA4 and Tim-3 are established immune checkpoints, and their blockade can reinvigorate anti-tumor T cell responses [PubMed: CTLA4 blockade cancer].
- The strong presence of CD86-CTLA4 on Mac|T CD4+ interactions in PDAC might imply that T helper cells are being actively suppressed or regulated by tumor-associated macrophages, highlighting macrophages as potential cellular targets in conjunction with checkpoint blockade.
- Biomarker Development:
- The specific ligand-receptor pairs identified (e.g., CD86-CTLA4, LGALS9-HAVCR2) could serve as potential biomarkers for patient stratification or treatment response prediction in PDAC immunotherapy. For example, high expression of LGALS9 or HAVCR2 on specific cell populations within the tumor could indicate a more immunosuppressive microenvironment.
- Understanding Tumor Microenvironment:
- The shift from diverse immune-regulatory interactions in normal tissue to a macrophage-centric, tightly regulated (co-stimulation vs. co-inhibition) immune checkpoint network in PDAC provides valuable insights into how the tumor microenvironment establishes and maintains immune evasion.
- Understanding these context-dependent interactions could guide the development of combination therapies, for instance, combining checkpoint blockade with strategies to re-educate tumor-associated macrophages.
- Experimental Validation:
- The identified CCI pairs represent strong candidates for further experimental validation using techniques like multiplex immunofluorescence, spatial transcriptomics, or *in vitro* co-culture assays to confirm their functional significance in PDAC progression and response to therapy.
14. Condition-Specific Cell-Cell Interaction Patterns in Pancreatic Ductal Adenocarcinoma
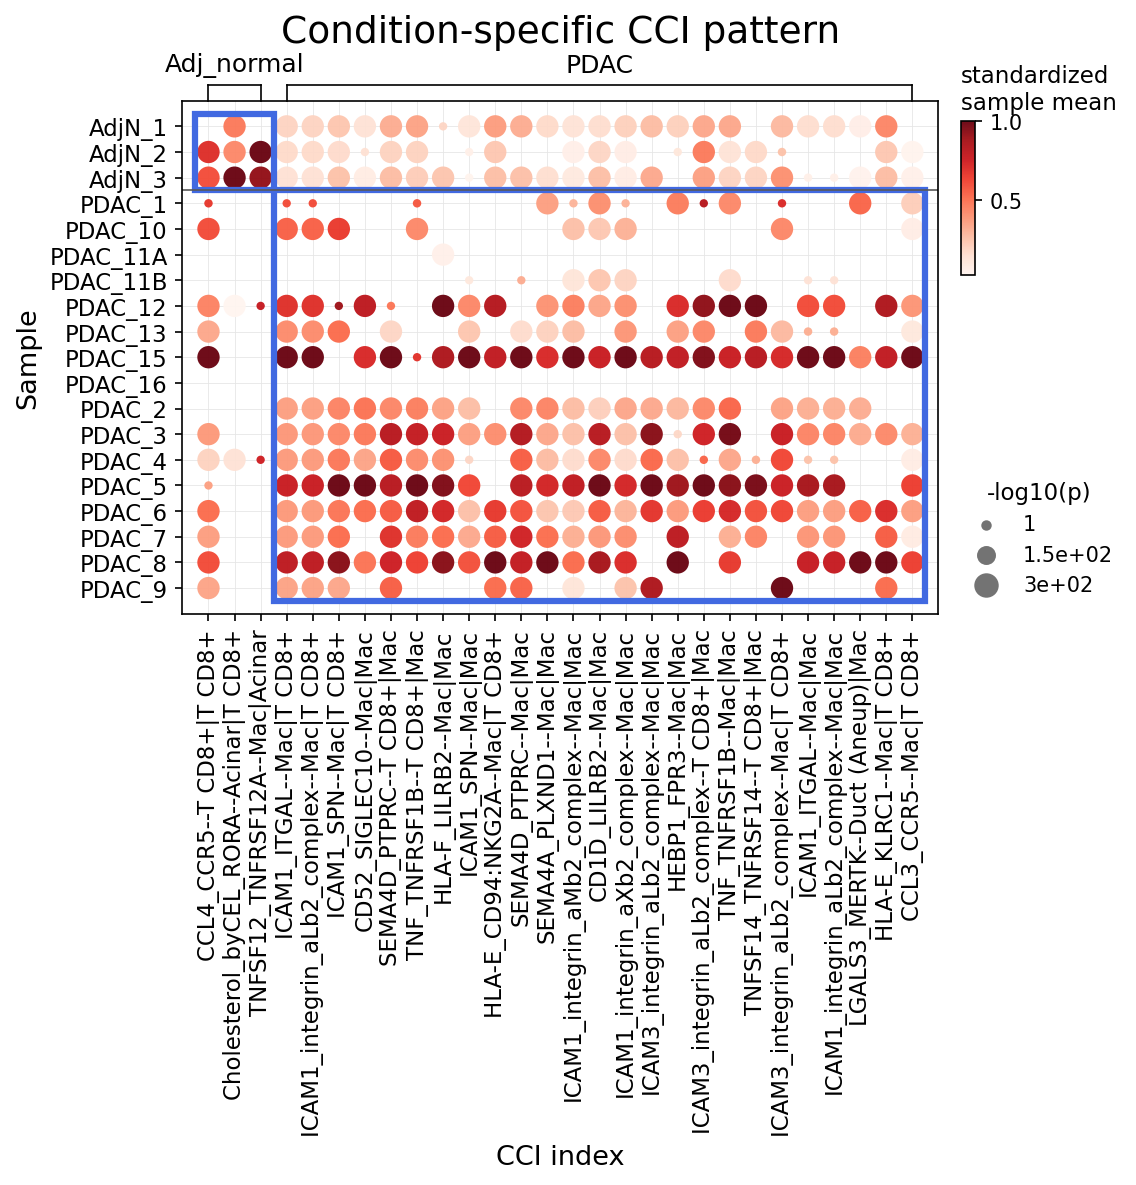
[Analysis Visualization Results]...
Analysis Overview
This analysis identifies statistically significant differences in cell-cell interactions (CCIs) between 'Adj_normal' (adjacent normal pancreas tissue) and 'PDAC' (Pancreatic Ductal Adenocarcinoma) conditions. The investigation focused on major immune and stromal cell types: Myeloid cells, T cells, Endothelial cells, Mast cells, B cells, and Stromal cells. CellPhoneDB was used to compute CCIs per condition and per sample, followed by statistical testing to identify interactions significantly different between conditions. The results are visualized as a dot plot, showing the strength and statistical significance of specific ligand-receptor interactions between defined cell types across individual samples.
Visual Summary
The dot plot effectively illustrates distinct patterns of cell-cell communication characterizing the adjacent normal pancreatic tissue versus PDAC samples.
- Adj_normal Condition: Samples from the 'Adj_normal' group exhibit strong and significant interactions primarily concentrated on a few specific ligand-receptor pairs at the far left of the plot. Notable examples include CCL4_CCR5--T CD8+|T CD8+, Cholesterol_byCEL_RORA--Acinar|T CD8+, and TNFRSF12_TNFRSF12A--Mac|Acinar. The majority of other CCIs show minimal to no activity in these samples.
- PDAC Condition: In contrast, PDAC samples display a significantly broader and more intense landscape of CCIs. The interactions prominent in 'Adj_normal' are generally attenuated or absent in PDAC samples. Instead, a large number of diverse CCIs, particularly involving Macrophages ('Mac') interacting with T cells ('T CD8+') or other Macrophages, are highly active and statistically significant across most PDAC samples. This distinct set of interactions dominates the middle and right sections of the plot.
- Key PDAC-specific interactions: Many of these interactions involve Integrin-related pathways (e.g., ICAM1_integrin_aMb2_complex--Mac|Mac, ICAM3_integrin_aXb2_complex--Mac|Mac), Semaphorin signaling (SEMA4D_PTPRC--Mac|Mac, SEMA4A_PLXND1--Mac|Mac), MHC class I related molecules (HLA-E_KLRC1--Mac|T CD8+), and inhibitory receptors (CD1D_LILRB2--Mac|Mac, CD52_SIGLEC10--Mac|Mac). A particularly noteworthy interaction is LGALS3_MERTK--Duct (Aneupl)|Mac, indicating communication between aneuploid ductal cells (likely tumor cells) and macrophages.
- Overall Pattern: The dot size (representing -log10(p-value)) and color intensity (standardized mean interaction strength) consistently show that the interactions prevalent in PDAC are both strong and statistically significant, highlighting a fundamental shift in cellular crosstalk within the tumor microenvironment.
Biological Interpretation
The observed differences in CCI patterns reflect a profound reshaping of the cellular communication network in PDAC compared to normal pancreatic tissue, primarily driven by altered immune and stromal cell interactions.
- Remodeling of the Tumor Microenvironment (TME): The extensive and distinct set of CCIs in PDAC points to a highly active and complex tumor microenvironment. This is characteristic of PDAC, which is known for its desmoplastic stroma and intricate immune cell infiltration that often supports tumor growth and progression rather than suppression.
- Dominance of Macrophage-Mediated Interactions in PDAC: Macrophages (represented as 'Mac') are central players in the majority of PDAC-specific CCIs. This highlights the critical role of tumor-associated macrophages (TAMs) in PDAC. TAMs are well-known for their pleiotropic functions, including promoting angiogenesis, immune suppression, and tumor cell proliferation and invasion.
- Adhesion and Immune Synapse Formation (ICAMs/Integrins): The frequent appearance of ICAM1/3-integrin complexes in macrophage-macrophage and macrophage-T cell interactions suggests increased cell adhesion and potential alterations in immune synapse formation, which could contribute to immune cell recruitment or dysfunction within the TME. GeneCards: ICAM1
- Immunosuppressive Signaling: Interactions involving SEMA4D_PTPRC (CD45), CD52_SIGLEC10, HLA-E_KLRC1 (NKG2A), and CD1D_LILRB2 (ILT4) are particularly significant. These pathways are frequently implicated in immune evasion and suppression:
- SEMA4D-PTPRC: Semaphorin 4D engagement of CD45 can inhibit T cell activation, potentially contributing to an immunosuppressive milieu. GeneCards: SEMA4D
- HLA-E-KLRC1: HLA-E presentation to NKG2A on T cells and NK cells often leads to inhibition of their cytotoxic functions, allowing tumor cells to evade immune surveillance. GeneCards: HLA-E
- LILRB2 (ILT4): LILRB2 is an inhibitory receptor expressed on myeloid cells, and its activation by ligands like CD1D can suppress anti-tumor immune responses, promoting a pro-tumorigenic TAM phenotype. GeneCards: LILRB2
- Tumor-Macrophage Crosstalk (LGALS3-MERTK): The interaction between aneuploid ductal cells (tumor cells) and macrophages via LGALS3_MERTK is a critical finding. Galectin-3 (LGALS3) is often overexpressed in cancer and contributes to tumor growth and immune modulation. MERTK is a receptor on macrophages involved in efferocytosis (clearance of apoptotic cells) and immune suppression. This axis can promote immune evasion by macrophages clearing apoptotic tumor cells silently, thus preventing immunogenic cell death and supporting an immunosuppressive microenvironment. GeneCards: LGALS3, GeneCards: MERTK
- Loss of 'Normal' Immune Signaling: The reduced activity of CCL4_CCR5--T CD8+|T CD8+ in PDAC compared to normal tissue suggests a potential disruption in normal T cell-T cell communication or chemokine signaling critical for effective immune responses. CCL4 is a chemokine involved in immune cell recruitment.
Clinical or Translational Implications
The distinct CCI patterns observed between normal and PDAC tissues offer several potential clinical and translational avenues.
- Biomarkers for PDAC and Disease Progression: The identified PDAC-specific CCI pairs, particularly those involving TAMs and tumor cells (e.g., LGALS3-MERTK, SEMA4D-PTPRC, HLA-E-KLRC1), could serve as novel biomarkers for early detection, diagnosis, or monitoring of disease progression in PDAC. Analysis of these specific interactions in biopsy samples could potentially aid in distinguishing malignant from benign lesions or stratifying patients.
- Novel Therapeutic Targets: The numerous immunosuppressive and pro-tumorigenic interactions in PDAC represent attractive targets for therapeutic intervention.
- Targeting Macrophages: Strategies aimed at reprogramming TAMs, depleting them, or blocking specific pro-tumorigenic interactions (e.g., blocking LGALS3 or MERTK, or neutralizing SEMA4D) could enhance anti-tumor immunity and sensitize tumors to existing therapies.
- Immunotherapy Enhancement: Modulating these interactions could improve the efficacy of immunotherapies, which have had limited success in PDAC. For instance, interventions that disrupt HLA-E-NKG2A or LILRB2 signaling might reactivate suppressed NK and T cell responses.
- Understanding Treatment Resistance: A deeper understanding of these complex CCI networks may shed light on mechanisms of resistance to current treatments, guiding the development of more effective combination therapies.
- Prognostic Indicators: Further studies could explore whether specific CCI signatures correlate with patient outcomes, such as survival or response to therapy, thereby offering prognostic value.
15. Ductal Cell Condition-Specific Surfaceome Markers in Pancreatic Cancer
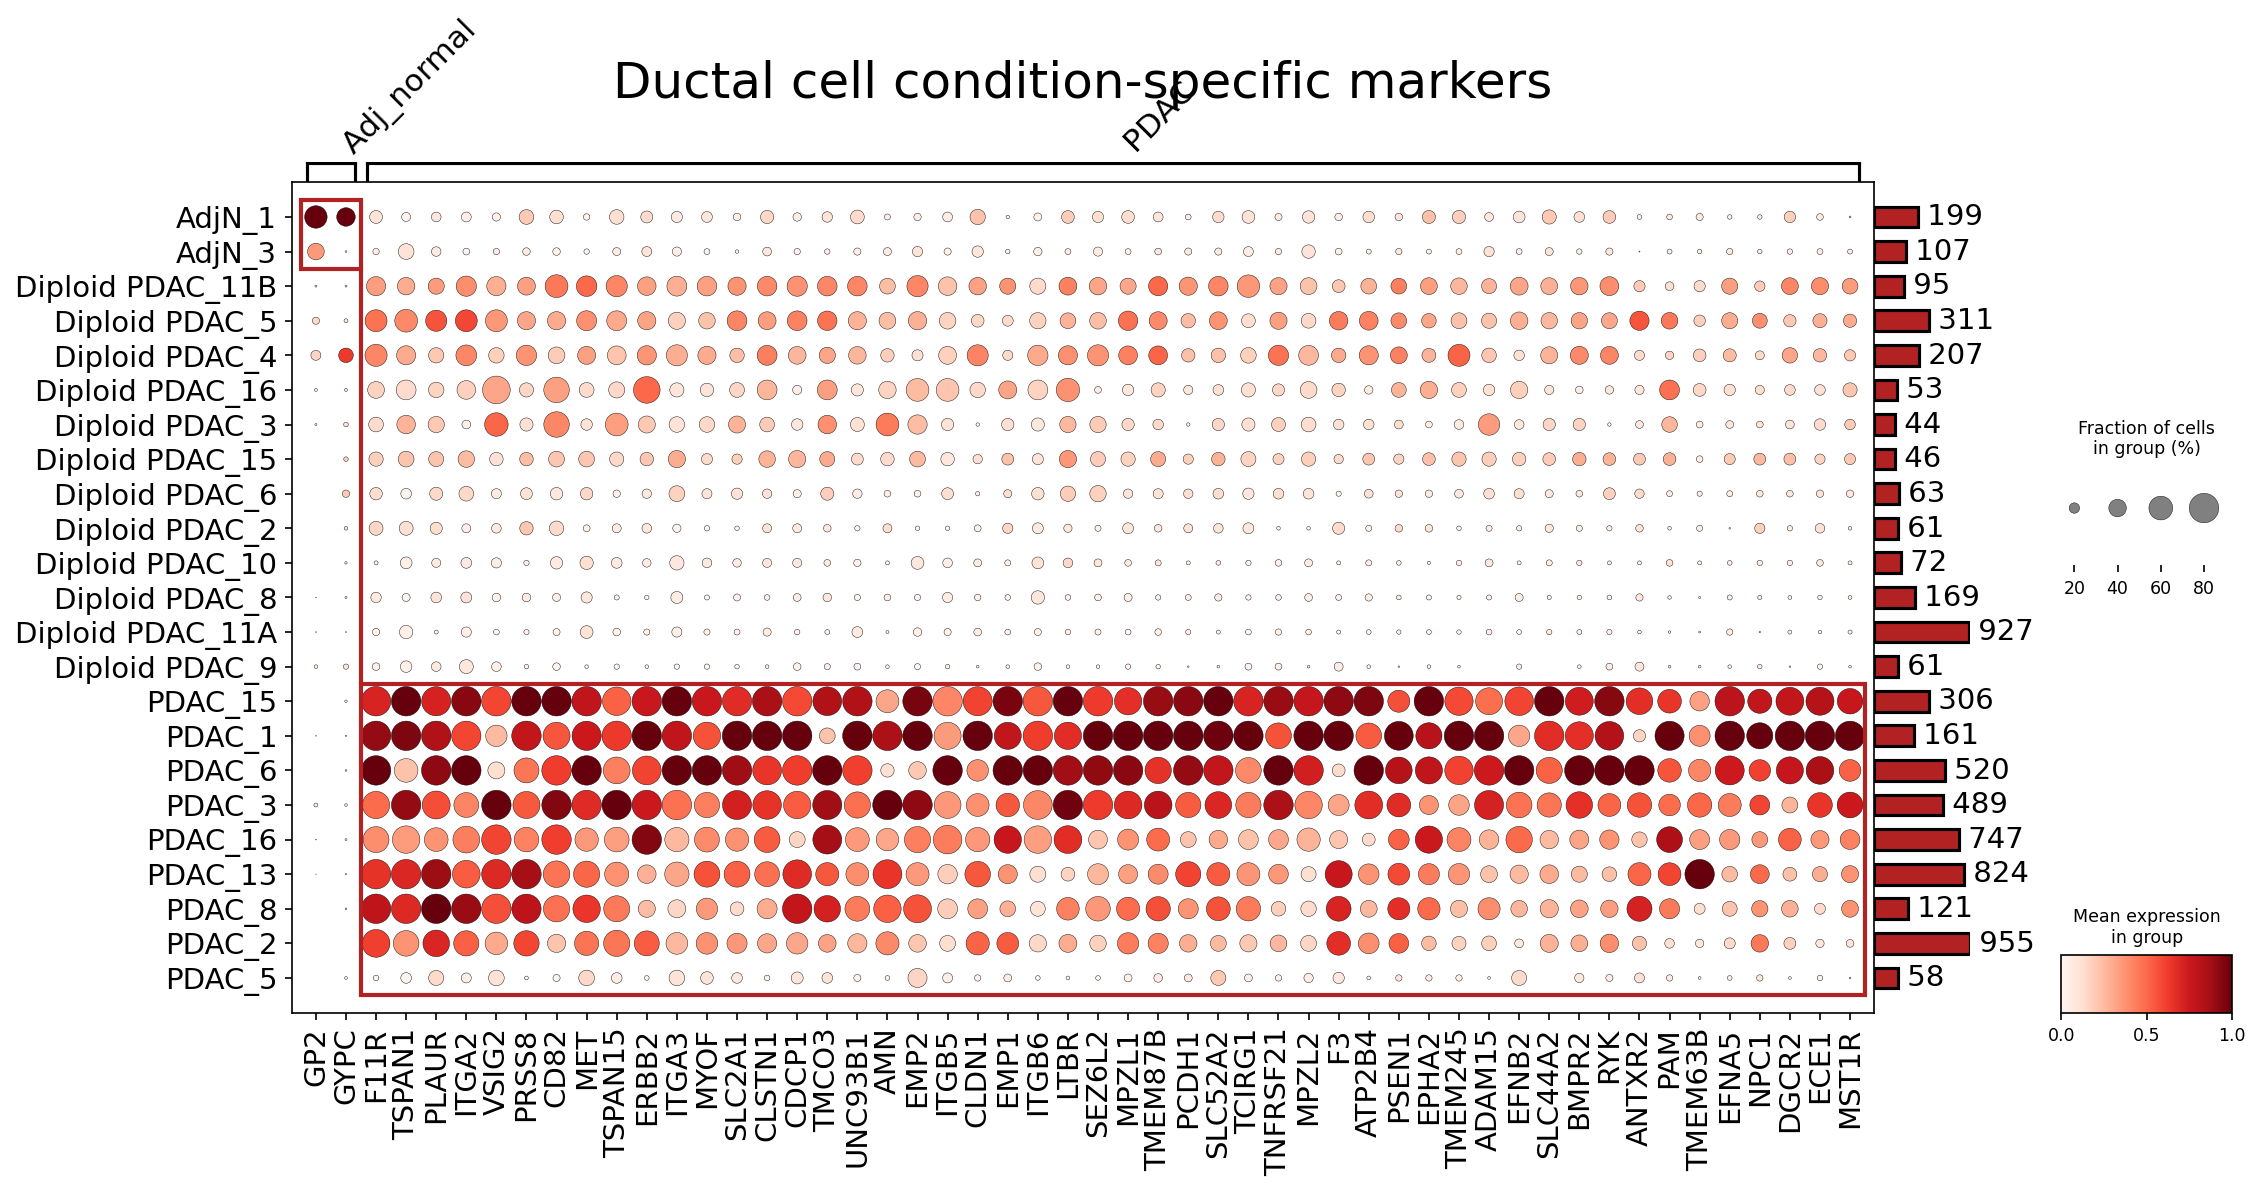
[Analysis Visualization Results]...
Analysis Overview
This analysis aimed to identify condition-specific surfaceome markers in Ductal cells, the tumor-origin cell type in Pancreatic Ductal Adenocarcinoma (PDAC). The plot_markers_and_expression_dot tool was used to visualize the expression of up to 50 surfaceome markers in Ductal cells across individual samples, categorized by their condition (Adj_normal vs. PDAC). The results provide insights into potential cell surface proteins that differentiate cancerous ductal cells from their normal counterparts.
Visual Summary
The dot plot clearly illustrates a striking difference in surfaceome marker expression between Ductal cells from "Adj_normal" and "PDAC" samples.
- Distinct Expression Patterns: Ductal cells from "Adj_normal" samples (AdjN_1, AdjN_3) show very low to negligible expression (small, faint dots or no dots) for almost all the identified markers. In stark contrast, Ductal cells from "PDAC" samples, including both "Diploid PDAC" and "PDAC" groups, exhibit high expression levels (dark red dots) in a large fraction of cells (large dot size) for a significant number of these surfaceome genes. This indicates a strong upregulation of these surface markers in pancreatic cancer ductal cells.
- Pan-PDAC Upregulation: The majority of the identified markers are broadly upregulated across most, if not all, PDAC samples, suggesting a common set of dysregulated surface proteins in cancerous ductal cells, regardless of their inferred ploidy status (Diploid PDAC vs. PDAC).
- Key Upregulated Markers: Prominent examples of genes with high expression and prevalence in PDAC ductal cells include *GP2*, *GPC3*, *TSPAN1*, *PLAUR*, *VSIG2*, *PRSS8*, *CD82*, *MET*, *ERBB2*, *ITGA3*, *SLC2A1*, *CDCP1*, *EMP1*, *EMP2*, *ITGB6*, *EPHA2*, *ADAM15*, *EFNB2*, and *MST1R*, among many others. These markers are nearly absent in adjacent normal ductal cells but show strong, widespread expression in PDAC.
- Sample Variability: While most PDAC samples show a consistent pattern of high expression for these markers, some variability in expression intensity and fraction of expressing cells can be observed between individual PDAC samples. The number of cells per group, indicated by the bar on the right, shows a wide range across samples, which is accounted for by the dot size (fraction of cells) and color (mean expression).
Biological Interpretation
The significant upregulation of a broad panel of surfaceome markers in PDAC ductal cells compared to adjacent normal ductal cells points towards profound changes in the cell surface proteome during malignant transformation. These surface proteins play critical roles in cell adhesion, signaling, immune evasion, and nutrient transport, all of which are fundamental processes in cancer biology.
Oncogenic Signaling and Growth:
- MET (Mesenchymal-Epithelial Transition factor) is a receptor tyrosine kinase frequently overexpressed or activated in PDAC, promoting cell proliferation, survival, invasion, and metastasis. Its upregulation aligns with its known role as an oncogene in various cancers. GeneCards: MET
- ERBB2 (HER2) is another well-known receptor tyrosine kinase involved in cell growth and differentiation. While famously amplified in breast and gastric cancers, its expression in PDAC can also contribute to aggressive phenotypes. GeneCards: ERBB2
- EPHA2 is a receptor tyrosine kinase that can promote tumor cell growth, survival, and migration, often acting as an oncogene in cancer progression. GeneCards: EPHA2
Cell Adhesion, Migration, and Invasion:
- ITGA3 and ITGB6 are integrin subunits. Integrins are cell surface receptors that mediate cell-extracellular matrix (ECM) and cell-cell interactions. Dysregulation of integrins like ITGA3 and ITGB6 is common in cancer, facilitating tumor cell invasion, migration, and metastasis. ITGB6, in particular, is often associated with epithelial-mesenchymal transition (EMT) and fibrosis in PDAC. GeneCards: ITGA3, GeneCards: ITGB6
- ADAM15 (ADAM metallopeptidase domain 15) is a disintegrin and metalloproteinase that can modulate cell adhesion, migration, and proteolysis, processes critical for tumor invasion. GeneCards: ADAM15
- CDCP1 (CUB domain containing protein 1) is a transmembrane protein implicated in various cancers, promoting cell survival, invasion, and metastasis. GeneCards: CDCP1
Other Noteworthy Markers:
- PLAUR (Plasminogen Activator, Urokinase Receptor) is a key player in pericellular proteolysis, facilitating tumor invasion and metastasis by activating plasminogen. GeneCards: PLAUR
- GPC3 (Glypican-3) is a cell surface proteoglycan that can promote cell proliferation and survival, and its overexpression is linked to various cancers, including hepatocellular carcinoma, and may play a role in PDAC. GeneCards: GPC3
- EMP1 and EMP2 (Epithelial Membrane Protein 1 and 2) are tetraspan-like proteins that can affect cell growth, adhesion, and migration and are often dysregulated in cancer. GeneCards: EMP1, GeneCards: EMP2
The robust and widespread upregulation of these surfaceome markers in PDAC ductal cells suggests a coordinated phenotypic shift in the cell surface landscape that supports cancer-specific functions.
Clinical or Translational Implications
The identification of a comprehensive panel of highly upregulated surfaceome markers in PDAC ductal cells has significant clinical and translational implications:
- Diagnostic and Prognostic Biomarkers: These markers could serve as highly specific diagnostic or prognostic indicators for PDAC. Detecting their expression on circulating tumor cells (CTCs) or in biopsies could help distinguish PDAC from benign conditions or identify aggressive disease subsets.
- Therapeutic Targets: As these are surfaceome markers, they are highly accessible for targeted therapies. Antibodies, antibody-drug conjugates (ADCs), or CAR T-cell therapies could be developed to specifically target cancer cells expressing these proteins while sparing normal cells. For example, MET and ERBB2 already have established therapeutic strategies in other cancers, and their expression in PDAC ductal cells suggests potential for repurposing or developing PDAC-specific inhibitors.
- Imaging and Drug Delivery: Surface markers can also be exploited for molecular imaging of tumors or for targeted delivery of chemotherapeutic agents directly to cancer cells, reducing systemic toxicity.
- Patient Stratification: The differential expression of specific markers among PDAC samples, even within the "PDAC" group, could potentially be used to stratify patients for personalized treatment approaches.
Further validation through immunohistochemistry on tissue microarrays or flow cytometry on patient samples would be crucial to confirm these findings and assess their clinical utility.
16. Macrophage Condition-Specific Surfaceome Markers in Pancreatic Cancer
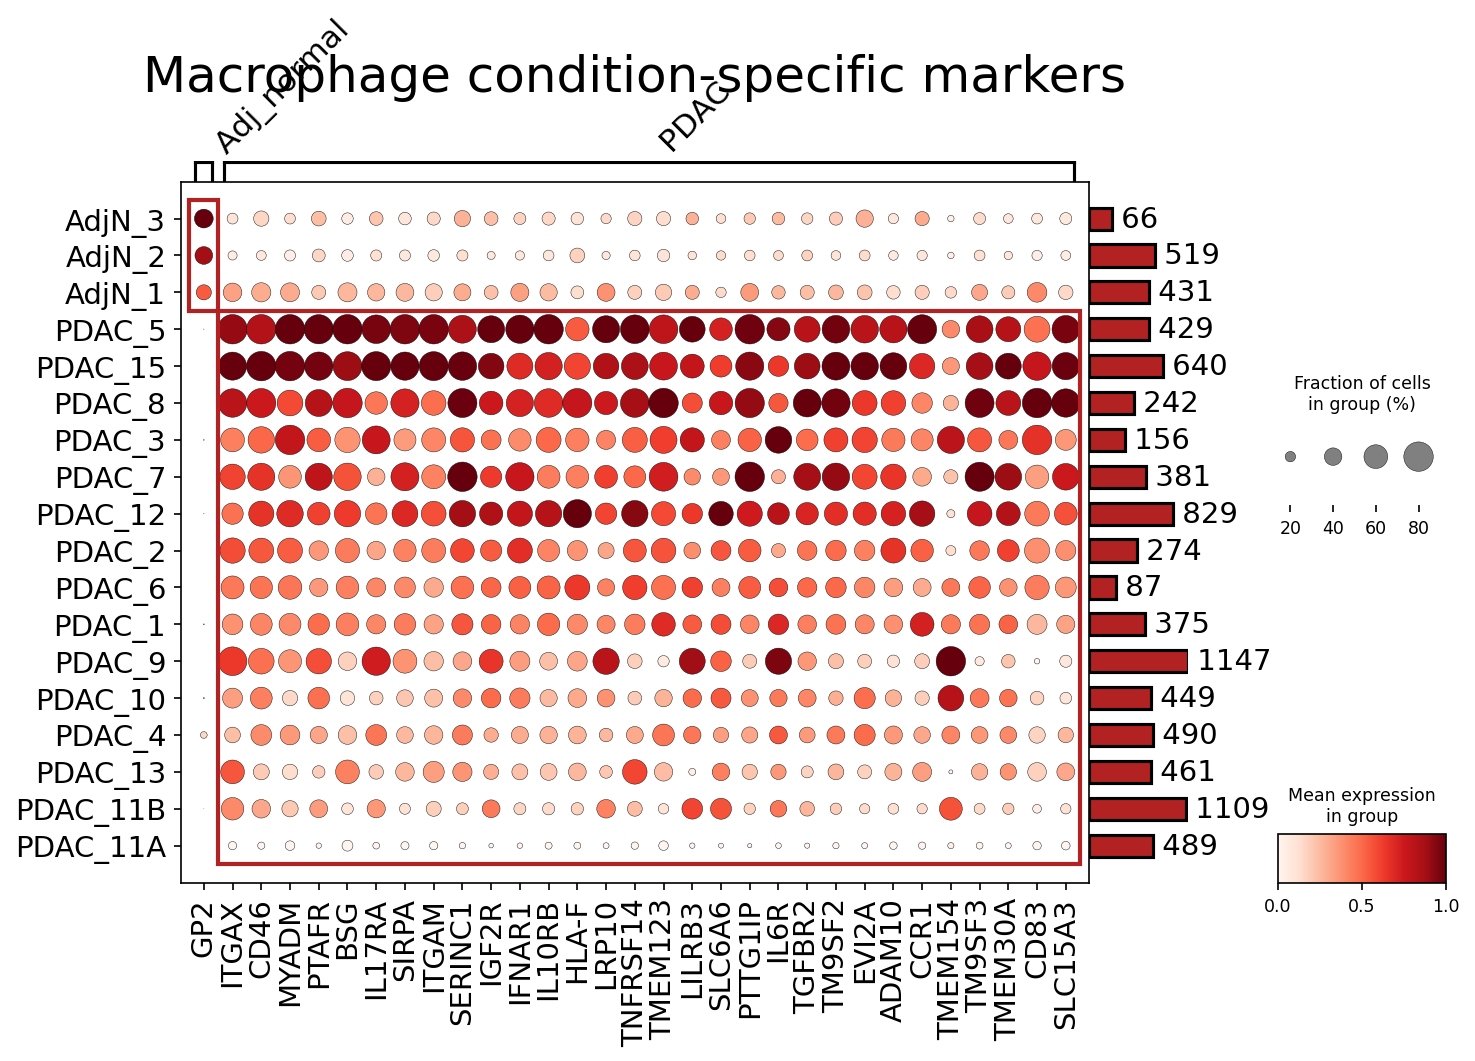
[Analysis Visualization Results]...
Analysis Overview
This analysis aimed to identify surfaceome markers that distinguish macrophages from pancreatic ductal adenocarcinoma (PDAC) tissue compared to adjacent normal pancreatic tissue (Adj_normal) samples. The dot plot visualizes the expression of up to 50 top differentially expressed surfaceome genes in macrophages across individual patient samples, grouped by condition. The size of each dot represents the fraction of cells within that sample expressing the gene, while the color intensity indicates the mean expression level.
Visual Summary
The dot plot clearly segregates macrophage populations based on their gene expression profiles according to the tissue origin.
- Condition-Specific Expression Patterns: A striking pattern emerges where macrophages from PDAC samples exhibit high expression (dark red color) and high prevalence (large dot size) for a distinct set of surfaceome markers. Conversely, macrophages from adjacent normal samples show very low to no expression (light color, small/absent dots) for these same markers.
- PDAC-Associated Macrophage Markers: A large group of genes, including ITGAX, CD46, MYADM, PTAFR, BSG, IL17RA, SIRPA, ITGAM, SEMA4A, IFNGR1, IL10RB, HLA-F, LRP10, TNFRSF14, LILRB3, IL6R, TGFBR2, CCR1, CD83, and several TMEM genes, are robustly upregulated and widely expressed in macrophages across most PDAC samples. Some PDAC samples (e.g., PDAC_5, PDAC_15, PDAC_8, PDAC_12) show particularly strong and broad upregulation of these markers.
- Adjacent Normal Macrophage Markers: In contrast, macrophages from adjacent normal samples (AdjN_1, AdjN_2, AdjN_3) show very low expression of the genes prominently expressed in PDAC. The gene GP2 shows relatively higher expression in adjacent normal macrophages compared to PDAC macrophages, although its overall expression and prevalence are moderate.
- Sample Heterogeneity: While there's a clear condition-specific signature, some heterogeneity exists within the PDAC group. For example, PDAC_1, PDAC_9, PDAC_10, PDAC_4, PDAC_13, PDAC_11B, and PDAC_11A show somewhat weaker or more sporadic expression of some of the markers compared to the top PDAC samples like PDAC_5 or PDAC_15.
- Cell Count Information: The bar charts on the right indicate the number of macrophage cells identified in each sample, ranging from 66 (AdjN_3) to 1147 (PDAC_9), providing context for the robustness of the expression measurements per sample.
Biological Interpretation
The observed differential expression of surfaceome markers points to a significant phenotypic shift in macrophages within the PDAC tumor microenvironment compared to those in adjacent normal pancreatic tissue. This suggests the presence of distinct macrophage populations with potentially different functional roles.
Macrophages in the PDAC microenvironment appear to adopt a tumor-associated macrophage (TAM) phenotype, characterized by the upregulation of several pro-tumorigenic and immunosuppressive markers:
Immune Evasion and Suppression:
- SIRPA (CD172a): This is a critical "don't eat me" signal receptor, interacting with CD47 on cancer cells to inhibit phagocytosis by macrophages. Its high expression suggests a role in tumor immune evasion [GeneCards: GeneCards].
- IL10RB (IL-10 receptor B): Upregulation of a component of the IL-10 receptor complex indicates increased responsiveness to IL-10, a potent immunosuppressive cytokine often abundant in the tumor microenvironment, promoting an M2-like, pro-tumorigenic phenotype in TAMs [GeneCards: GeneCards].
- TGFBR2 (TGF-beta receptor 2): Elevated expression of this receptor suggests that PDAC macrophages are highly responsive to TGF-beta, a key cytokine in the TME that promotes immunosuppression, fibrosis, and M2 polarization [GeneCards: GeneCards].
Pro-tumorigenic and Inflammatory Roles:
- BSG (CD147, Basigin): This glycoprotein is known to promote tumor growth, invasion, angiogenesis, and glycolysis in cancer. Its high expression on TAMs further supports their pro-tumorigenic functions [GeneCards: GeneCards].
- IL6R (IL-6 receptor): Responsiveness to IL-6, a pro-inflammatory and pro-tumorigenic cytokine, can promote TAM survival and M2 polarization [GeneCards: GeneCards].
- ITGAX (CD11c) & ITGAM (CD11b): These integrins are expressed on various myeloid cells and are involved in adhesion, migration, and phagocytosis, often associated with activated or differentiated myeloid cells, including TAMs [GeneCards: GeneCards], [GeneCards: GeneCards].
- CCR1 (Chemokine receptor type 1): Chemokine receptors like CCR1 facilitate the recruitment of immune cells, including monocytes and macrophages, to the tumor site in response to chemokines produced by cancer cells or other stromal cells [GeneCards: GeneCards].
Macrophage Activation and Differentiation Markers:
- CD46: A complement regulatory protein, often highly expressed in cancer and immune cells to evade complement-mediated lysis [GeneCards: GeneCards].
- IFNGR1 (IFN-gamma receptor 1): While IFN-gamma typically drives M1 polarization, its sustained expression in the TME can lead to complex macrophage states or even exhaustion, or it might be a response to initial anti-tumor immunity that becomes subverted [GeneCards: GeneCards].
- CD83: While often associated with mature dendritic cells, CD83 can also be expressed on activated macrophages and B cells, suggesting a state of activation or specific differentiation in TAMs [GeneCards: GeneCards].
The relatively low expression of most of these markers in adjacent normal macrophages suggests a quiescent or homeostatic macrophage state in healthy tissue. The presence of GP2 in adjacent normal macrophages is interesting. GP2 is known as a marker for M cells in Peyer's patches and is a major component of pancreatic zymogen granules. Its surface expression on adjacent normal macrophages could indicate a specific interaction with healthy pancreatic acinar cells or involvement in maintaining pancreatic homeostasis, potentially through phagocytosis of zymogen granule components or cellular debris [GeneCards: GeneCards].
Clinical or Translational Implications
The identification of these condition-specific surfaceome markers on macrophages in PDAC has several potential clinical implications:
- Biomarkers for Diagnosis/Prognosis: The distinct expression profiles could serve as a diagnostic tool to distinguish PDAC from non-malignant conditions or as prognostic indicators for disease progression and patient outcome.
- Therapeutic Targets: Surface markers like SIRPA (CD47-SIRPA axis), BSG (CD147), IL6R, and TGFBR2 are already under investigation as therapeutic targets in various cancers, including PDAC. Targeting these molecules on TAMs could modulate their pro-tumorigenic functions, potentially enhancing anti-tumor immunity or directly inhibiting tumor growth.
- Drug Delivery: These highly expressed surface proteins could be utilized for targeted drug delivery to TAMs. For example, antibody-drug conjugates or CAR-macrophage therapies could be designed to specifically recognize and eliminate or reprogram pro-tumorigenic TAMs in PDAC.
- Flow Cytometry/Immunohistochemistry: The identified surfaceome markers provide a robust panel for characterizing TAMs in PDAC using techniques like flow cytometry or immunohistochemistry in clinical samples, allowing for better classification and stratification of patients.
- Understanding Macrophage Plasticity: Further research into the upstream regulators of these markers could reveal pathways crucial for TAM polarization in PDAC, potentially leading to novel strategies to reprogram TAMs towards an anti-tumorigenic phenotype.
17. Condition-Specific Surfaceome Markers in Pancreatic Cancer CD4+ T cells
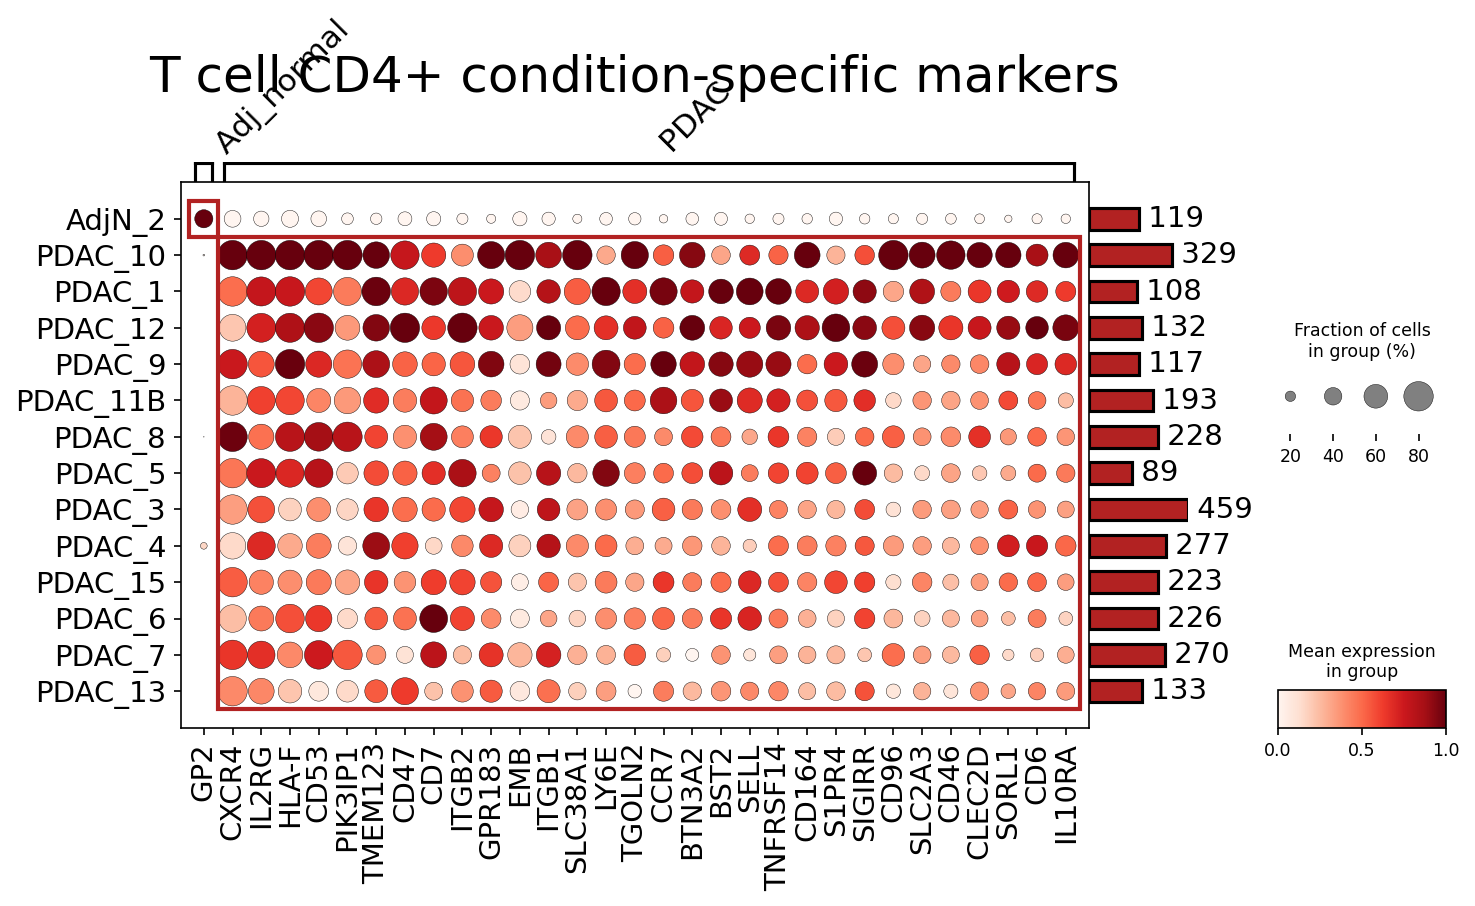
[Analysis Visualization Results]...
Analysis Overview
This analysis aimed to identify surfaceome markers that are differentially expressed in CD4+ T cells between pancreatic ductal adenocarcinoma (PDAC) and adjacent normal (Adj_normal) pancreatic tissues. The single-cell RNA sequencing (scRNA-seq) data, spanning 26871 cells and 23239 genes from human pancreas, was interrogated for CD4+ T cells. The plot_markers_and_expression_dot tool was used to visualize up to 50 significant surfaceome markers per condition, prioritizing those that are distinctively expressed. The dot plot displays both the mean expression level (color intensity) and the fraction of cells expressing the gene (dot size) across individual samples within each condition.
Visual Summary
The dot plot clearly differentiates the surfaceome marker profiles of CD4+ T cells from adjacent normal tissue (AdjN_2) versus PDAC samples.
- Distinct Expression Patterns: The Adj_normal sample (AdjN_2) shows a markedly different profile, with most of the displayed markers exhibiting very low or no expression (small, pale or white dots). In stark contrast, CD4+ T cells from PDAC samples generally display higher mean expression (darker red dots) and a greater fraction of cells expressing these markers (larger dots).
- PDAC Enrichment: The vast majority of the identified surfaceome markers are upregulated in CD4+ T cells within the PDAC microenvironment. Notable examples with consistently high expression and prevalence across many PDAC samples include HLA-F, CD53, CD47, ITGB2, ITGB1, CD7, TMEM123, PIK3IP1, GPR183, and EMB.
- Inter-sample Heterogeneity in PDAC: While many markers are broadly elevated in PDAC, there is considerable variability among individual PDAC samples. For instance, genes like CXCR4, IL2RG, GPR183, and EMB show high expression in some PDAC samples (e.g., PDAC_10, PDAC_1) but lower or variable expression in others (e.g., PDAC_5, PDAC_4). This suggests patient-specific differences in the CD4+ T cell response or microenvironment.
- Number of Cells per Group: The bar chart on the right indicates the number of CD4+ T cells analyzed per sample, ranging from 89 to 459 cells, providing confidence in the group-level statistics.
Biological Interpretation
The observed surfaceome marker landscape points towards significant alterations in CD4+ T cell phenotypes and functions within the PDAC tumor microenvironment compared to adjacent normal tissue.
- Immune Checkpoints and Evasion: Several identified markers are directly implicated in immune evasion and modulation of T cell responses:
- CD47 (Cluster of Differentiation 47) is a "don't eat me" signal that prevents phagocytosis of cancer cells and is often overexpressed in various cancers. Its upregulation on PDAC CD4+ T cells might reflect a broader immune suppressive environment or altered T cell-macrophage interactions. GeneCards: CD47
- HLA-F (Major Histocompatibility Complex, Class I, F) is a non-classical MHC class I molecule, and its expression in cancer can contribute to immune escape by modulating NK cell and T cell responses. PubMed search: HLA-F immune evasion cancer
- CD96 (Cluster of Differentiation 96) is an immune checkpoint receptor, similar to PD-1 and CTLA-4, that can inhibit T and NK cell anti-tumor activity. GeneCards: CD96
- IL10RA (Interleukin 10 Receptor Subunit Alpha) is the receptor for IL-10, a potent immunosuppressive cytokine. Upregulation of IL10RA suggests CD4+ T cells in PDAC are highly responsive to IL-10, potentially leading to an exhausted or regulatory phenotype. GeneCards: IL10RA
Cell Adhesion and Migration:
- ITGB1 (Integrin Beta 1) and ITGB2 (Integrin Beta 2) are integrin subunits crucial for cell-extracellular matrix and cell-cell adhesion, respectively. Their upregulation may reflect enhanced T cell adhesion and infiltration into the dense PDAC tumor stroma. PubMed search: integrin T cell migration cancer
- CXCR4 (C-X-C Motif Chemokine Receptor 4) and GPR183 (G Protein-Coupled Receptor 183, also known as EBI2) are chemokine receptors involved in guiding lymphocyte migration. Their differential expression suggests altered trafficking and positioning of CD4+ T cells within the PDAC microenvironment. GeneCards: CXCR4
T cell Activation and Signaling:
- CD53 (Cluster of Differentiation 53) is a tetraspanin involved in immune cell activation and signaling.
- IL2RG (Interleukin 2 Receptor Subunit Gamma) is the common gamma chain, essential for the signaling of several cytokine receptors (IL-2, -4, -7, -9, -15, -21), indicating altered cytokine responsiveness.
- TNFRSF14 (Tumor Necrosis Factor Receptor Superfamily Member 14, also known as HVEM) is a receptor involved in co-stimulation or co-inhibition of T cells, depending on its ligand, contributing to the complexity of T cell regulation in cancer.
Clinical or Translational Implications
The identified surfaceome markers hold significant promise for both diagnostic and therapeutic applications in PDAC.
- Biomarkers for PDAC-Associated CD4+ T Cells: The consistently upregulated markers such as HLA-F, CD47, ITGB1, ITGB2, and CD96 in PDAC CD4+ T cells could serve as valuable biomarkers to identify and characterize tumor-infiltrating lymphocytes (TILs) in PDAC. These markers could be assessed by flow cytometry or immunohistochemistry on patient biopsies to stratify patients, monitor disease progression, or evaluate treatment response.
Potential Therapeutic Targets:
- CD47: Given its role as a "don't eat me" signal, blocking CD47 with antibodies is an active area of cancer therapy research, aiming to promote tumor cell phagocytosis. Its expression on CD4+ T cells warrants further investigation into how anti-CD47 therapies might also modulate the T cell compartment.
- CD96: As a known immune checkpoint, CD96 represents a potential target for immune checkpoint blockade strategies to enhance anti-tumor immunity in PDAC, similar to anti-PD-1/PD-L1 therapies. PubMed search: CD96 immune checkpoint therapy cancer
- IL10RA: Targeting the IL-10/IL10RA axis could be a strategy to counteract immunosuppression in the PDAC microenvironment, potentially reactivating anti-tumor T cell responses.
- CXCR4: Given its role in cell migration, blocking CXCR4 could inhibit tumor cell metastasis and modulate immune cell trafficking, thereby impacting the tumor microenvironment.
- Heterogeneity and Personalized Medicine: The observed inter-patient variability in marker expression underscores the need for personalized approaches in PDAC. Phenotyping CD4+ T cells based on these surface markers could help tailor immunotherapies to individual patients, potentially leading to more effective treatments.
18. Ductal Cell Cycle Genes Show Significant Upregulation in Pancreatic Ductal Adenocarcinoma (PDAC)
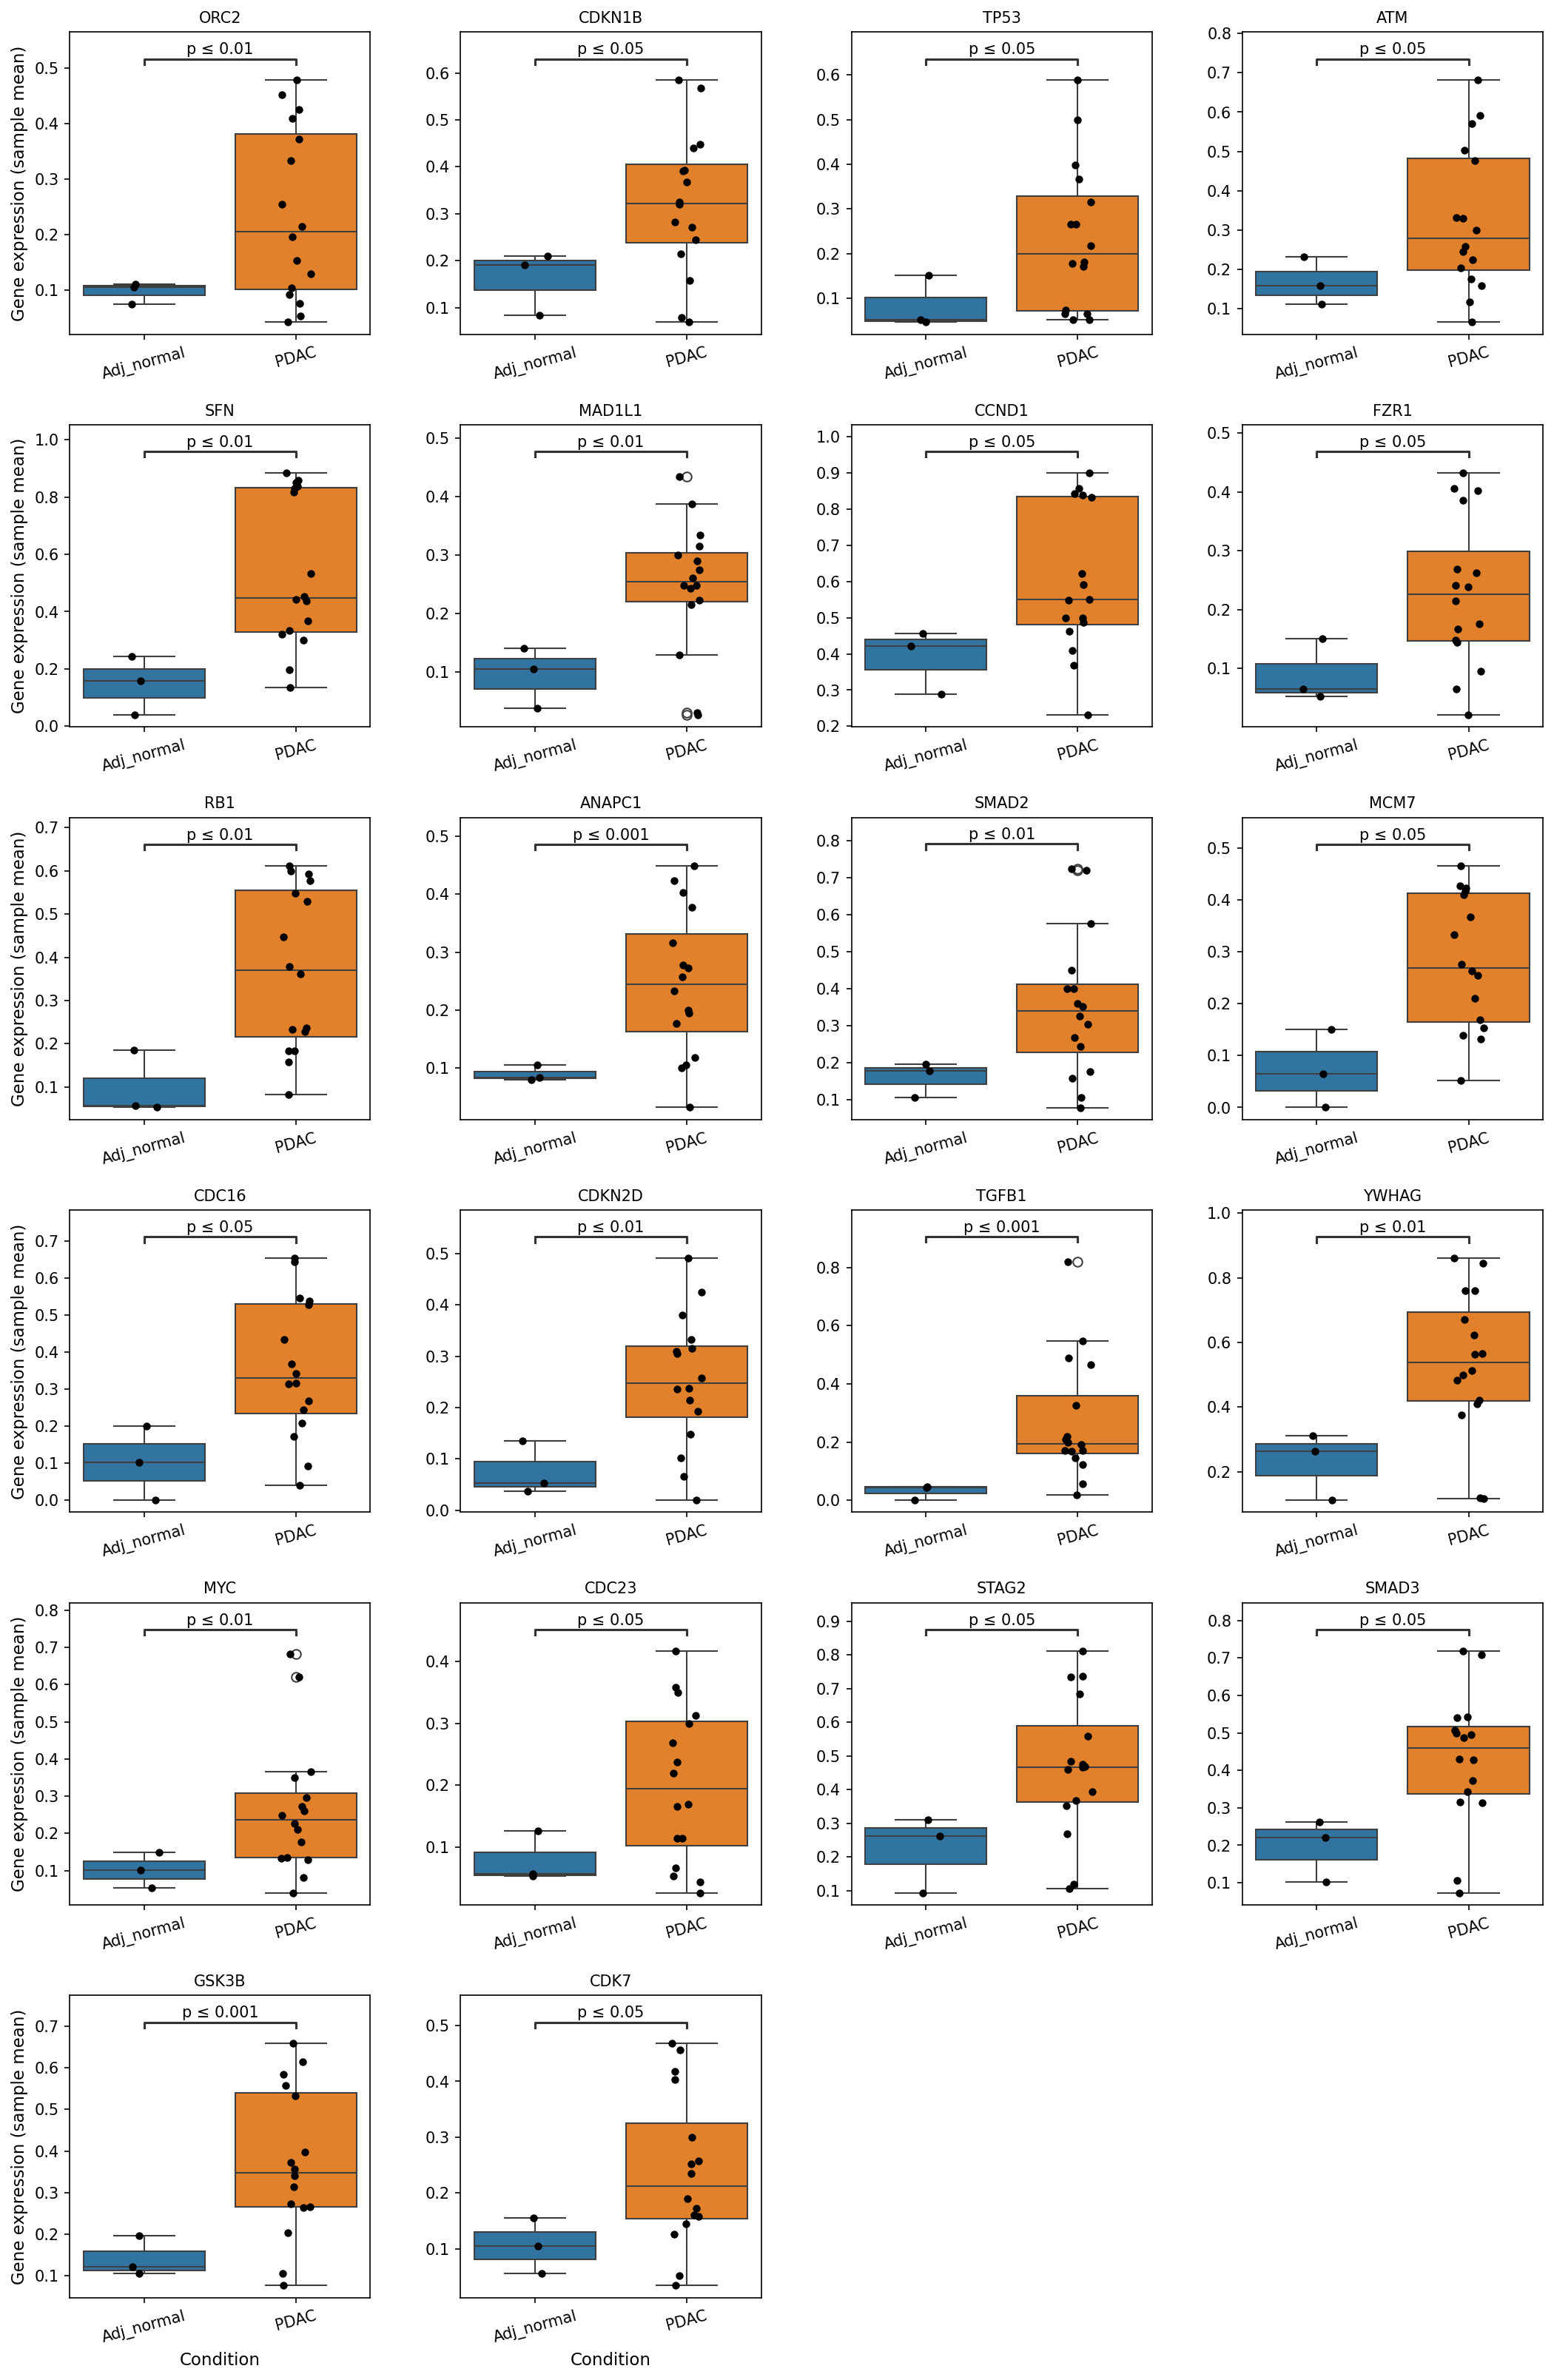
[Analysis Visualization Results]...
Analysis Overview
This analysis investigates the differential expression of genes related to the Cell Cycle pathway in Ductal cells, comparing the Pancreatic Ductal Adenocarcinoma (PDAC) condition to the Adjacent Normal (Adj_normal) condition. The findings are presented as box plots showing gene expression distributions across samples, along with statistical significance for the observed differences.
Visual Summary
The visualization displays box plots for 24 distinct cell cycle-related genes, comparing their expression in Ductal cells from Adj_normal versus PDAC samples.
- Consistent Upregulation in PDAC: For all 24 genes presented, there is a clear and statistically significant upregulation of expression in Ductal cells from PDAC samples compared to Adj_normal samples. The p-values for these differences are consistently low (p ≤ 0.05, p ≤ 0.01, or p ≤ 0.001), indicating high statistical confidence.
- Increased Variability in PDAC: In addition to elevated median expression, Ductal cells from PDAC samples often exhibit a wider distribution of gene expression values (larger interquartile range and greater spread of individual data points) for many of these genes, suggesting increased cellular heterogeneity in the tumor microenvironment.
- Key Genes Highlighted: Genes such as ORC2, CDKN1B, TP53, ATM, SFN, MAD1L1, CCND1, FZR1, RB1, ANAPC1, SMAD2, MCM7, CDC16, CDKN2D, TGFB1, YWHAG, MYC, CDC23, STAG2, SMAD3, GSK3B, and CDK7 are prominently displayed, all showing this characteristic pattern of increased expression in PDAC.
Biological Interpretation
The observed widespread upregulation of cell cycle-related genes in Ductal cells within PDAC is a strong indicator of enhanced proliferative activity and represents a fundamental hallmark of cancer. Considering that Ductal cells are identified as the tumor origin cell type in this dataset, these findings directly reflect the transformed state of the tumor cells.
- Accelerated Cell Proliferation: Genes involved in DNA replication (e.g., ORC2, MCM7 [UniProt: P25205, Q14164]), cell cycle progression (e.g., CCND1 [GeneCards: CDND1], CDK7 [UniProt: P50613]), and mitosis (e.g., ANAPC1, FZR1, CDC16, CDC20, CDC23 – components of the Anaphase-Promoting Complex/Cyclosome, APC/C) are significantly upregulated. This collective upregulation points to a highly active cell division cycle, driving tumor growth.
- Oncogenic Drive: The upregulation of MYC [GeneCards: MYC], a potent oncogene, further supports the notion of an aggressive proliferative phenotype. MYC plays a central role in regulating cell growth, division, and metabolism, and its overexpression is frequently associated with various cancers, including PDAC.
- DNA Damage and Checkpoint Responses: Genes like ATM [GeneCards: ATM], a critical regulator of DNA damage response, and SFN (14-3-3 sigma) [GeneCards: SFN], involved in cell cycle arrest and apoptosis, are also upregulated. This could indicate that while proliferation is rampant, the cells are also experiencing increased DNA damage and replication stress, leading to activation of checkpoint pathways as an attempt to maintain genomic integrity or as a consequence of genomic instability.
- Complex Role of Tumor Suppressors: The increased expression of classic tumor suppressor genes such as TP53 [GeneCards: TP53], RB1 [GeneCards: RB1], CDKN1B (p27) [UniProt: P46527], and CDKN2D (p19) [UniProt: P30280] in PDAC Ductal cells warrants careful interpretation. While typically downregulated or inactivated in cancer, their upregulation here could signify several possibilities:
- Mutant Protein Accumulation: For TP53, upregulation can often reflect the accumulation of a stabilized mutant p53 protein that has lost its tumor-suppressive function and may even gain oncogenic properties.
- Stress Response: Cells might be increasing expression of these genes as a compensatory mechanism to counter uncontrolled proliferation or cellular stress, though their function might be abrogated downstream.
- Context-Dependent Roles: The roles of these genes in specific cancer contexts can be complex, and their elevated mRNA levels do not always directly translate to functional tumor suppression, especially when other pro-proliferative pathways are highly active.
- TGF-beta Signaling Activation: The significant upregulation of TGFB1 [GeneCards: TGFB1], SMAD2 [GeneCards: SMAD2], and SMAD3 [GeneCards: SMAD3] suggests increased activity of the TGF-beta signaling pathway. While TGF-beta can act as a tumor suppressor in early stages, in advanced PDAC, it often switches to a pro-tumorigenic role, promoting epithelial-mesenchymal transition (EMT), invasion, metastasis, and immunosuppression [PubMed Search: TGFB1 PDAC EMT].
Clinical or Translational Implications
The findings underscore the highly proliferative nature of Ductal cells in PDAC, a key driver of tumor growth and aggressiveness.
- Therapeutic Targets: The widespread upregulation of numerous cell cycle regulators presents a rich landscape for therapeutic intervention. Targeting specific cyclin-dependent kinases (CDKs), components of the APC/C, or upstream drivers like MYC could be effective strategies to inhibit tumor cell proliferation in PDAC. For example, CDK inhibitors are already established or in development for various cancers [PubMed Search: CDK inhibitors cancer therapy].
- DNA Damage Response Vulnerabilities: The co-upregulation of DNA damage response genes (e.g., ATM) alongside high proliferation might indicate that these cells operate under significant replication stress. This could make PDAC cells particularly vulnerable to therapies that induce further DNA damage or inhibit DNA repair mechanisms, potentially synergizing with conventional chemotherapies.
- TGF-beta Pathway Targeting: The activation of TGF-beta signaling, implicated in PDAC progression and metastasis, suggests that inhibitors of this pathway could be beneficial, especially in conjunction with therapies targeting cell proliferation or the immune microenvironment [PubMed Search: TGFB1 inhibitors PDAC].
- Prognostic and Predictive Biomarkers: High expression of these cell cycle genes could serve as prognostic markers for aggressive disease or predictive markers for response to therapies that specifically target cell division. Further investigation into the functional consequences of the upregulated tumor suppressors (TP53, RB1, CDKN1B, CDKN2D) is crucial to understand their precise role in PDAC pathogenesis and potential for therapeutic exploitation.
19. Ductal and Acinar Cell Gene Ontology (GSA) Analysis in Pancreatic Conditions
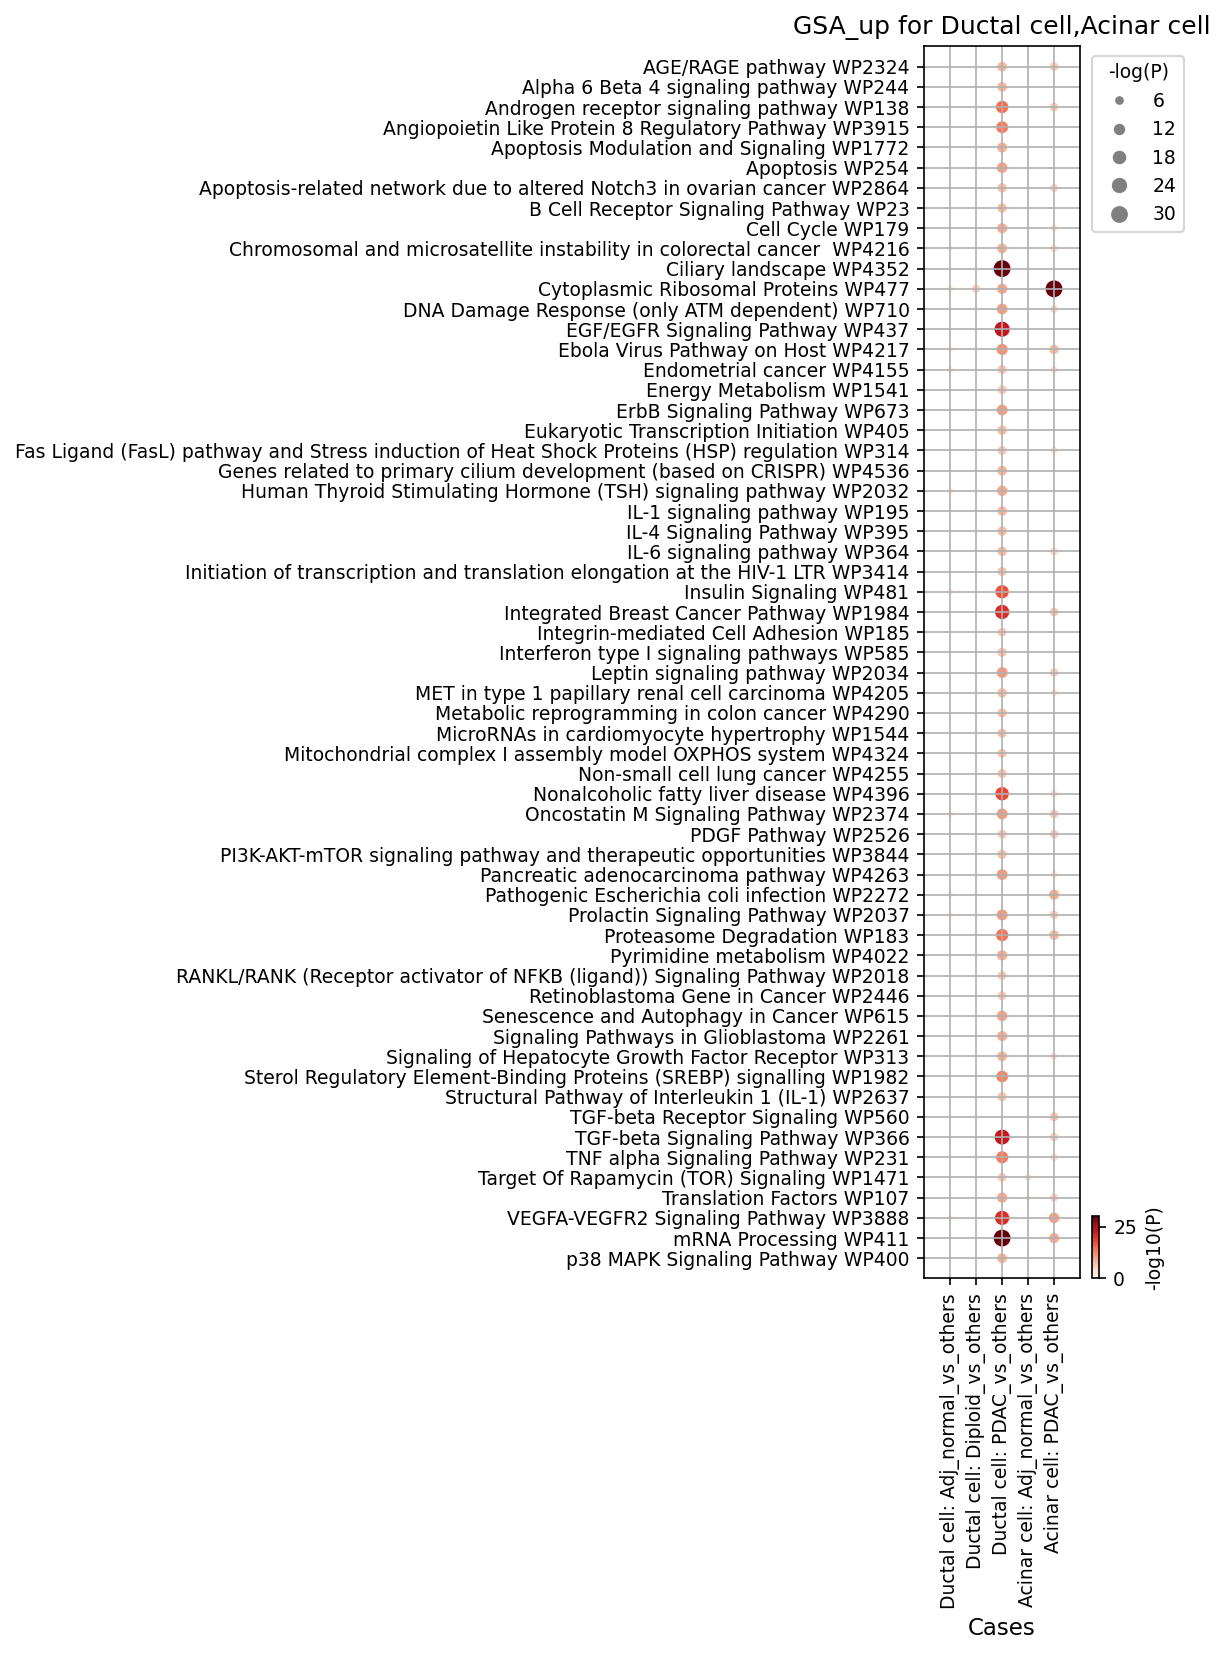
[Analysis Visualization Results]...
Analysis Overview
This analysis investigates Gene Ontology (GO) pathway enrichment (specifically for upregulated genes, GSA_up) in Ductal cells and Acinar cells. The comparisons are performed across different conditions (Adj_normal vs others, PDAC vs others) and for Ductal cells, also by ploidy status (Diploid vs others). Ductal cells are explicitly identified as the tumor origin cell type for Pancreatic Ductal Adenocarcinoma (PDAC). The results are presented as a dot plot, where dot size and color intensity reflect the statistical significance (-log10(p-value)) of pathway enrichment.
Visual Summary
The visualization provided is a dot plot, not a bar plot as requested by the user query, illustrating Gene Ontology pathway enrichment. Each row represents a specific GO pathway, and each column represents a comparison case (e.g., "Ductal cell: PDAC_vs_others"). The size and color intensity of each dot correspond to the negative logarithm of the adjusted p-value (-log10(P)), with larger, darker red dots indicating more significant enrichment.
Key visual observations include:
- Ductal cell: PDAC_vs_others shows the most significant and widespread pathway enrichment, characterized by numerous large, dark red dots across a broad range of pathways.
- Ductal cell: Adj_normal_vs_others and Ductal cell: Diploid_vs_others columns exhibit very few and generally less significant enrichments, with smaller, lighter dots or no dots for most pathways.
- Acinar cell: Adj_normal_vs_others and Acinar cell: PDAC_vs_others columns also show limited and less significant pathway enrichment compared to PDAC Ductal cells. Some pathways, like "Mitochondrial complex I assembly model OXPHOS system WP4324", show moderate enrichment in Acinar cells.
Biological Interpretation
The GSA_up analysis highlights distinct biological processes activated in Ductal and Acinar cells, particularly in the context of PDAC.
Ductal Cells in PDAC Exhibit Extensive Oncogenic Activation:
- The most prominent finding is the robust enrichment of a wide array of cancer-associated pathways in Ductal cells from PDAC samples ("Ductal cell: PDAC_vs_others"). This is highly consistent with Ductal cells being the origin of PDAC.
- Genomic Instability and DNA Repair: Pathways like "DNA Damage Response (only ATM dependent) WP710" and "Chromosomal and microsatellite instability in colorectal cancer WP4216" are strongly enriched. This indicates that malignant ductal cells are characterized by increased genomic instability and active DNA repair mechanisms, key features of cancer development and progression. PubMed search: DNA damage response pancreatic cancer
- Cell Proliferation and Growth Signaling: Pathways such as "Cell Cycle WP179", "EGF/EGFR Signaling Pathway WP437", "PI3K-AKT-mTOR signaling pathway and therapeutic opportunities WP3844", "Target Of Rapamycin (TOR) Signaling WP1471", and "mRNA Processing WP411" are highly active. These pathways drive uncontrolled cell growth, proliferation, protein synthesis, and metabolic reprogramming, all essential for tumor expansion. GeneCards: EGFR, GeneCards: PIK3CA
- Tumor Microenvironment and Angiogenesis: "VEGFA-VEGFR2 Signaling Pathway WP107" indicates active angiogenesis, crucial for tumor blood supply. "TGF-beta Receptor Signaling WP560" and "TNF alpha Signaling Pathway WP231" suggest active remodeling of the tumor microenvironment, which can promote cancer cell invasion and immune evasion. PubMed search: Pancreatic cancer TGF-beta signaling
- Evasion of Apoptosis: "Apoptosis Modulation and Signaling WP1772" points to mechanisms allowing cancer cells to evade programmed cell death, a hallmark of cancer.
- Direct Cancer Relevance: The enrichment of "Pancreatic adenocarcinoma pathway WP4263" directly confirms the relevance of these findings to the disease.
Normal/Diploid Ductal Cells Show Minimal Oncogenic Signatures:
- In contrast, "Ductal cell: Adj_normal_vs_others" and "Ductal cell: Diploid_vs_others" columns show very limited and less significant pathway activation. This indicates that these specific cancer-associated pathways are largely confined to the malignant, likely aneuploid, ductal cells found in PDAC.
- Some modest enrichment of immune/inflammatory pathways (e.g., IL-1, IL-4, IL-6 signaling) in normal ductal cells might reflect baseline physiological responses or mild inflammatory processes in the normal pancreatic tissue.
Acinar Cells Exhibit Stress Responses Rather Than Transformation:
- Acinar cells, even within the PDAC context ("Acinar cell: PDAC_vs_others"), do not show the same widespread oncogenic pathway activation as PDAC Ductal cells. This supports the known ductal origin of PDAC.
- However, "Mitochondrial complex I assembly model OXPHOS system WP4324" is moderately enriched in both normal and PDAC acinar cells, potentially reflecting their high metabolic demands for enzyme production, or metabolic adaptation/stress induced by the tumor microenvironment.
- Pathways such as "Apoptosis Modulation and Signaling WP1772", "Senescence and Autophagy in Cancer WP615", "p38 MAPK Signaling Pathway WP400", and "TGF-beta Receptor Signaling WP560" show mild enrichment in PDAC acinar cells. This suggests that acinar cells, while not directly transformed, are responsive to the tumor microenvironment, undergoing stress, senescence, or attempting adaptive changes via paracrine signaling.
Clinical or Translational Implications
The distinct pathway enrichments observed have several important clinical and translational implications for PDAC:
- Identification of Therapeutic Targets: The strong activation of key signaling pathways like EGF/EGFR, PI3K-AKT-mTOR, and VEGFA-VEGFR2 in malignant Ductal cells reaffirms their potential as therapeutic targets in PDAC. Existing drugs or novel agents targeting these pathways could be investigated for efficacy, potentially in combination therapies to overcome resistance. PubMed search: PI3K/AKT/mTOR inhibitors pancreatic cancer
- Biomarker Discovery: The specific gene sets contributing to the highly enriched pathways in PDAC Ductal cells, especially those related to DNA damage response and genomic instability, could serve as diagnostic, prognostic, or predictive biomarkers. For example, markers of DNA damage response might identify tumors susceptible to PARP inhibitors or platinum-based chemotherapy.
- Understanding PDAC Pathogenesis: The findings underscore the central role of genomic instability, unchecked proliferation, and active microenvironmental remodeling in PDAC development. This comprehensive view of activated pathways provides a molecular fingerprint of the disease, aiding in understanding its aggressive nature.
- Targeting the Tumor Microenvironment: While acinar cells are not the origin of PDAC, their observed stress responses and activation of pathways like TGF-beta signaling within the tumor context suggest they are active participants in the tumor microenvironment. Modulating the responses of these bystander cells might represent an indirect therapeutic strategy to influence tumor growth or metastasis.
20. Gene Set Enrichment Analysis (GSEA) of Pancreatic Cell Types in PDAC
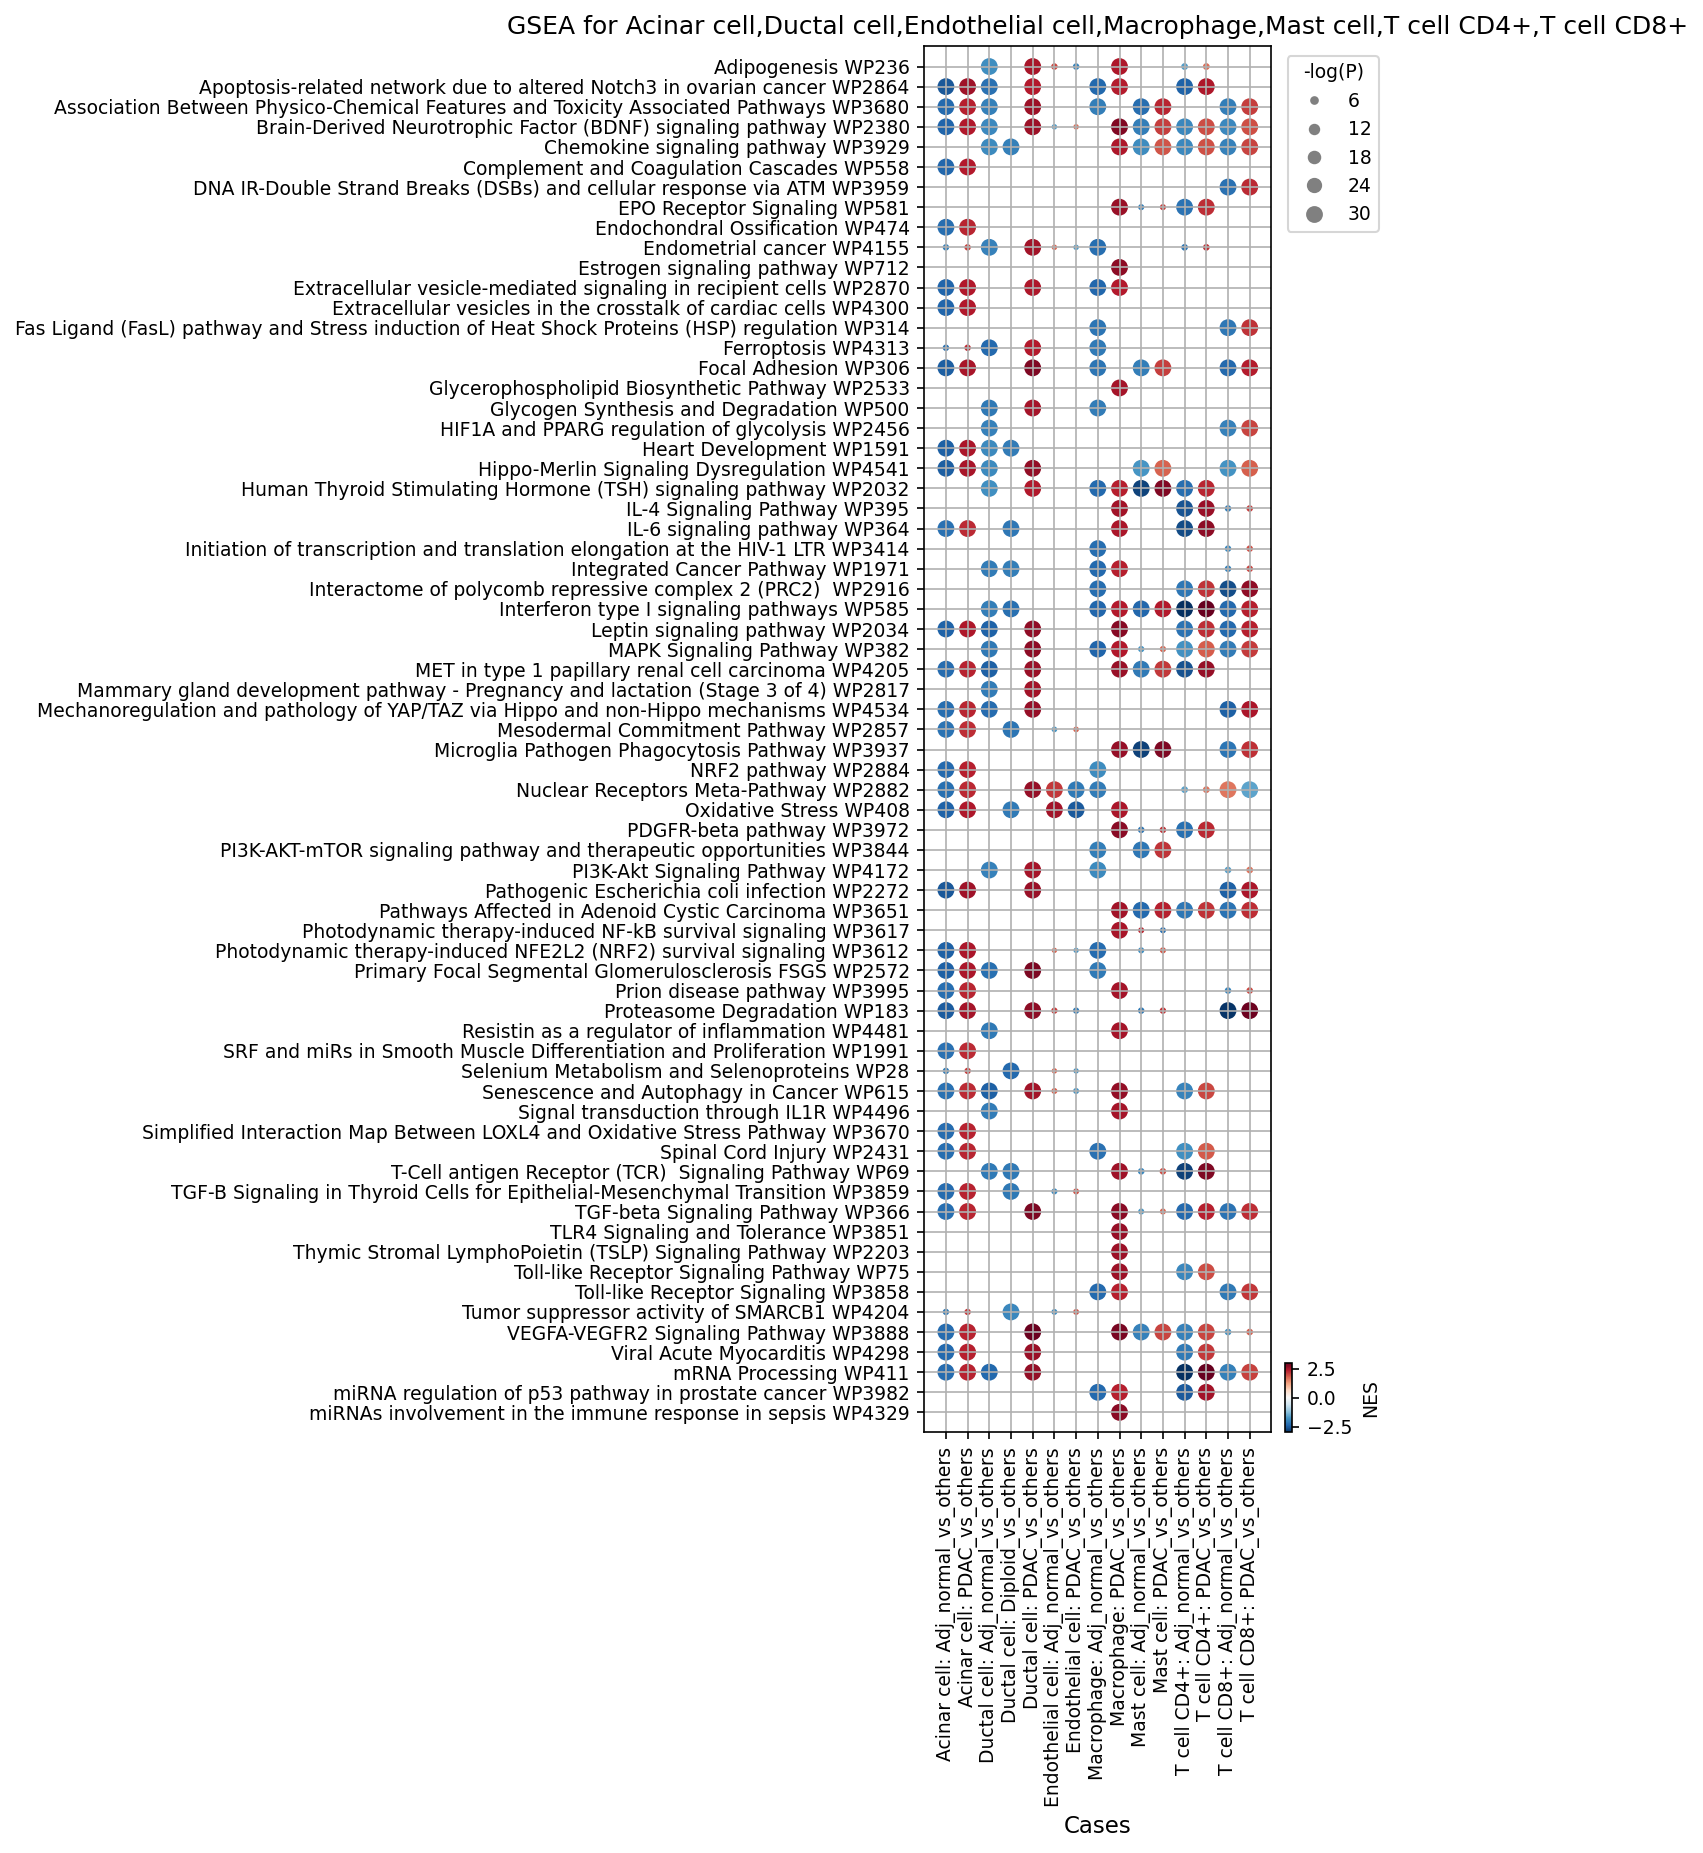
[Analysis Visualization Results]...
Analysis Overview
This analysis presents Gene Set Enrichment Analysis (GSEA) results for key cell types within the pancreas, comparing their transcriptional profiles in different conditions. The dot plot visualizes the enrichment or depletion of various biological pathways across Acinar cells, Ductal cells, Endothelial cells, Macrophages, Mast cells, CD4+ T cells, and CD8+ T cells. The comparisons include cells from adjacent normal tissue ("Adj_normal_vs_others"), Pancreatic Ductal Adenocarcinoma (PDAC) tissue ("PDAC_vs_others"), and specifically, diploid Ductal cells ("Diploid_vs_others") against all other cells in the dataset. Normalized Enrichment Score (NES) indicates the direction and magnitude of pathway enrichment (red for upregulation, blue for downregulation), while dot size reflects statistical significance (-log(p-value)).
Visual Summary
The GSEA dot plot effectively summarizes the pathway activity across various cell types and conditions.
- Widespread Pathway Alterations in PDAC: Compared to adjacent normal tissues, cell types derived from PDAC samples generally exhibit a higher number and stronger enrichment/depletion of pathways, indicated by larger and more intensely colored dots. This suggests substantial transcriptional reprogramming within the tumor microenvironment (TME).
- Consistently Upregulated Pathways in PDAC: Several pathways are consistently upregulated (red dots) across multiple cell types in PDAC, including "CHEMOKINE signaling pathway", "Complement and Coagulation Cascades", "MAPK Signaling Pathway", "PI3K-Akt Signaling Pathway", and "Toll-like Receptor Signaling". This indicates a broad activation of inflammatory, pro-survival, and immune-modulatory processes within the PDAC TME.
- Metabolic Reprogramming: The "HIF1A and PPARG regulation of glycolysis" pathway shows significant upregulation in Ductal, Endothelial, and T cells from PDAC, highlighting widespread metabolic shifts characteristic of cancer and its microenvironment.
- Angiogenesis: "VEGFA-VEGFR2 Signaling Pathway" is prominently upregulated in Ductal, Endothelial, and Mast cells in PDAC, reflecting active angiogenesis.
- Ductal Cell Ploidy Differences: The "Ductal cell: Diploid_vs_others" column shows a distinct pattern. While it shares many upregulated pathways with "Ductal cell: PDAC_vs_others" (e.g., Chemokine signaling, HIF1A/PPARG, PI3K-AKT-mTOR), the enrichments are often less pronounced. This suggests that even diploid ductal cells within the tumor context exhibit oncogenic pathway activation, but perhaps with different magnitudes or specific pathway subsets compared to the broader PDAC ductal cell population which likely includes aneuploid cells.
- Immune Cell Activation: Macrophages, Mast cells, and both CD4+ and CD8+ T cells in PDAC show strong upregulation of immune-related pathways (e.g., Chemokine, IL-4/IL-6, Interferon type I, TLR signaling, Microglia Pathogen Phagocytosis for Macrophages; TCR signaling for CD8+ T cells), indicating an active, though potentially dysregulated, immune response.
- Common Downregulation: The "Thymic Stromal LymphoPoietin (TSLP) Signaling Pathway" appears consistently downregulated (blue dots) in Ductal cells, CD4+ T cells, and CD8+ T cells from PDAC, suggesting a potential shared suppressive mechanism.
Biological Interpretation
The GSEA results provide a comprehensive view of the biological processes dysregulated in various pancreatic cell types in the context of PDAC. The interpretation is based on comparing specific cell types in a given condition (e.g., PDAC) against all other cells in the dataset, effectively highlighting their unique molecular signatures.
Common Dysregulations Across PDAC Cell Types
- Inflammation and Immune Response: The pervasive upregulation of "CHEMOKINE signaling pathway," "Complement and Coagulation Cascades," and "Toll-like Receptor Signaling" across Ductal, Endothelial, Macrophage, Mast, CD4+ T, and CD8+ T cells in PDAC underscores a highly inflammatory tumor microenvironment. This persistent inflammation can promote tumor growth, angiogenesis, and immune evasion. PubMed search: Pancreatic cancer inflammation signaling
- Oncogenic Signaling Cascades: Key pro-survival and proliferative pathways such as "MAPK Signaling Pathway" and "PI3K-Akt Signaling Pathway" are significantly activated in Ductal cells (tumor cells) and also show enrichment in supporting cells like Endothelial cells, suggesting cross-talk and adaptation within the TME. These pathways are central to cancer cell growth and resistance to therapy. GeneCards: PI3K-Akt Signaling Pathway
- Metabolic Reprogramming: "HIF1A and PPARG regulation of glycolysis" is strongly upregulated in Ductal, Endothelial, and T cells in PDAC. This reflects the "Warburg effect," a metabolic shift towards aerobic glycolysis that fuels rapid cancer cell proliferation and provides building blocks for biomass synthesis, and also affects TME cells.
Ductal Cell Insights (Tumor Origin)
- PDAC Ductal Cells: Exhibit broad activation of cancer hallmarks including "DNA IR-Double Strand Breaks (DSBs) and cellular response via ATM" (indicating DNA damage and repair mechanisms), "Senescence and Autophagy in Cancer" (contributing to tumor cell survival), and "VEGFA-VEGFR2 Signaling Pathway" (promoting angiogenesis). The "Apoptosis-related network due to altered Notch3" pathway, although named for ovarian cancer, highlights Notch signaling dysregulation, a common feature in PDAC contributing to proliferation and survival. PubMed search: Notch signaling PDAC
- Diploid Ductal Cells in the Tumor Context: These cells show enrichment in several oncogenic pathways similar to PDAC ductal cells (e.g., Chemokine signaling, PI3K-AKT-mTOR, VEGF-VEGFR2), but often with lower NES. The specific upregulation of "Estrogen signaling pathway" and "Mammary gland development pathway" in diploid ductal cells might suggest the presence of a unique subpopulation with altered hormonal responses or stem-like properties, possibly representing pre-malignant states or specific differentiation trajectories within the tumor. "miRNA regulation of p53 pathway" is also notably active, implying sophisticated regulatory mechanisms affecting a critical tumor suppressor even in diploid cells.
Immune Cell Dynamics
- Macrophages (TAMs): Display a highly activated, pro-tumorigenic phenotype with strong enrichment in "IL-4 Signaling Pathway," "Interferon type I signaling pathway," "Microglia Pathogen Phagocytosis Pathway," and "Oxidative Stress." This is consistent with tumor-associated macrophages (TAMs) adopting an M2-like phenotype, which promotes tumor growth, immune suppression, and angiogenesis in PDAC. PubMed search: Macrophages PDAC microenvironment
- T Cells (CD4+ and CD8+): Both T cell subsets show upregulation of pathways related to immune activation (Chemokine, Complement, Interferon type I, MAPK, TLR signaling). Notably, "T cell antigen Receptor (TCR) Signaling Pathway" is upregulated in CD8+ T cells, suggesting an attempt at anti-tumor response or chronic stimulation leading to exhaustion. However, the consistent downregulation of "Thymic Stromal LymphoPoietin (TSLP) Signaling Pathway" across T cells and Ductal cells hints at a potential mechanism of immune evasion or altered immune landscape in the TME. TSLP typically promotes Th2 inflammation, so its suppression could reflect a shift in cytokine milieu.
- Mast Cells: Demonstrate activation of "IL-6 Signaling Pathway" and "VEGFA-VEGFR2 Signaling Pathway," indicating their involvement in inflammation and angiogenesis, contributing to tumor progression.
Stromal and Endothelial Cell Contributions
- Endothelial Cells: In PDAC, these cells show significant upregulation of pathways essential for tumor angiogenesis and inflammation, including "CHEMOKINE signaling pathway," "HIF1A and PPARG regulation of glycolysis," "PI3K-Akt Signaling Pathway," and "VEGFA-VEGFR2 Signaling Pathway." This highlights their crucial role in supporting tumor growth by forming new blood vessels and interacting with immune cells.
Acinar Cell Changes
- PDAC Acinar Cells: Show upregulation of "Adipogenesis," "Glycerophospholipid Biosynthetic Pathway," and "HIF1A and PPARG regulation of glycolysis," indicating metabolic adaptations. This could be related to Acinar-to-Ductal Metaplasia (ADM), a precursor lesion for PDAC, or a reactive state of acinar cells to the tumor presence. The downregulation of "Extracellular vesicle-mediated signaling" pathways might point to altered intercellular communication in the affected acinar cells.
Clinical or Translational Implications
The comprehensive GSEA results reveal several therapeutically targetable pathways and potential biomarkers in PDAC:
- Targeting Oncogenic Signaling: The consistent activation of PI3K-AKT-mTOR and MAPK signaling pathways across tumor cells and the TME reinforces their established role in PDAC pathogenesis. Pharmacological inhibition of these pathways, alone or in combination, represents a promising therapeutic strategy. PubMed search: PI3K-AKT-mTOR inhibitors PDAC
- Modulating the TME: The widespread upregulation of Chemokine signaling, Complement cascades, and Toll-like Receptor signaling pathways highlights the inflammatory nature of the PDAC TME. Targeting specific chemokines or TLRs could disrupt pro-tumor inflammation, reduce immune cell infiltration, and potentially enhance anti-tumor immunity.
- Anti-Angiogenic Strategies: The strong activation of VEGFA-VEGFR2 signaling in Ductal, Endothelial, and Mast cells suggests that anti-angiogenic therapies could be beneficial in PDAC, potentially reducing tumor blood supply and growth.
- Metabolic Vulnerabilities: The pronounced enrichment of HIF1A and PPARG regulation of glycolysis across multiple cell types identifies metabolic reprogramming as a core feature. Targeting glycolytic pathways or HIF1A could selectively impair cancer cell energy metabolism and impact TME cells.
- Immune Modulators: The specific patterns of immune cell activation and the downregulation of TSLP signaling offer insights for immunotherapy. Strategies aimed at reversing TSLP suppression or re-directing T cell responses through other pathways could improve anti-tumor immunity.
- Ploidy-Specific Therapies: The distinct pathway enrichments observed in diploid ductal cells suggest that molecular profiling for ploidy status might inform personalized treatment approaches, particularly in earlier disease stages or for specific subsets of tumor cells.
21. Discussion
The comprehensive single-cell analysis of pancreatic tissue provides critical insights into the pathology of Pancreatic Ductal Adenocarcinoma (PDAC), highlighting fundamental differences from adjacent normal tissue.
Aneuploid ductal cells consistently emerge as the malignant population, exhibiting widespread genomic instability with recurrent amplifications, notably affecting regions harboring oncogenes like EGFR (7q) and EIF3E/GSDMD (8q) (Sections 1, 4, 5, 10). This genomic rewiring is a hallmark of PDAC, driving its aggressive proliferation and providing a molecular fingerprint of the disease.
Profound remodeling of the tumor microenvironment (TME) is a central finding. Cell population shifts indicate a significant expansion of ductal cells (tumor cells) and an infiltration of diverse immune (macrophages, T cells, ILCs) and stromal components (fibroblasts, stellate cells) within PDAC samples (Section 6). The T cell compartment in PDAC shows a notable decrease in cytotoxic T cells and an increase in naive T cells, T follicular helper (Tfh) cells, and ILCreg, collectively suggesting a shift toward an immunosuppressive state (Sections 7, 9).
An interesting and potentially notable finding is the observed predominance of M1-like macrophages in PDAC samples compared to adjacent normal tissue (Section 8). While tumor-associated macrophages (TAMs) in many solid tumors, including PDAC, are often characterized by an M2-like, pro-tumoral and immunosuppressive phenotype, this observation could indicate a sustained pro-inflammatory state, a context-dependent functional impairment of these M1-like cells, or specific molecular subtypes of PDAC. Further investigation into their functional state and polarization in the PDAC TME is warranted.
Cell-cell interaction (CCI) analysis further illuminates the intricate communication network within the PDAC TME (Sections 11, 12, 13, 14). Aneuploid ductal cells engage in extensive autocrine/paracrine signaling, including oncogenic EGFR (AREG-EGFR, TGFA-EGFR) and EMT-promoting TGFB1-TGFBR1 interactions, driving their self-sufficiency and invasiveness. Macrophages play a central role, engaging in immune-modulatory interactions with T cells (e.g., CD86-CD28/CTLA4) and establishing immunosuppressive axes (e.g., SIRPA-CD47, HLA-E-NKG2A) that contribute to immune evasion. Integrin-mediated interactions are also prominent, facilitating cell adhesion, migration, and stromal remodeling crucial for tumor invasion and metastasis.
Gene set enrichment analyses (GSA and GSEA) reveal widespread activation of oncogenic, inflammatory, and metabolic reprogramming pathways across various PDAC cell types (Sections 19, 20). Malignant ductal cells display robust enrichment of DNA damage response, cell cycle, PI3K-AKT-mTOR, MAPK, and VEGFA-VEGFR2 signaling pathways, indicative of uncontrolled proliferation and angiogenesis. Macrophages adopt a pro-tumorigenic phenotype with activated IL-4, IFN-I, TLR signaling, and oxidative stress pathways. Metabolic shifts towards glycolysis (HIF1A/PPARG regulation) are also observed across multiple cell types.
The upregulation of numerous cell cycle-related genes (e.g., ORC2, MYC, CCND1) in PDAC ductal cells directly correlates with their enhanced proliferative activity (Section 18). Furthermore, condition-specific surfaceome marker analyses identify distinct panels of highly upregulated surface proteins on PDAC ductal cells (e.g., MET, ERBB2, ITGB6, PLAUR) and macrophages (e.g., SIRPA, BSG, IL6R, TGFBR2) (Sections 15, 16, 17). These cell-surface molecules not only delineate altered cellular phenotypes but also represent highly accessible targets for therapeutic intervention.
In summary, this single-cell analysis provides a multi-faceted view of PDAC, characterized by malignant ductal cell genomic instability and hyperproliferation, a profoundly reprogrammed immunosuppressive and pro-tumorigenic TME, and a complex network of oncogenic and inflammatory cell-cell interactions. These findings collectively offer a rich resource for understanding PDAC pathogenesis and identifying novel diagnostic, prognostic, and therapeutic strategies.
Hypotheses:
- The observed M1 macrophage dominance in PDAC samples indicates a functionally impaired pro-inflammatory response, rather than an effective anti-tumor immune response, due to the highly immunosuppressive PDAC microenvironment.
- The recurrent CNVs in EGFR, EIF3E, and GSDMD in aneuploid ductal cells are critical drivers of tumor proliferation and survival, and targeting these pathways will significantly impact tumor growth.
- The elevated cell-cell interactions involving integrin pathways and immune checkpoints (e.g., CD47-SIRPA, HLA-E-NKG2A) between aneuploid ductal cells and macrophages actively promote immune evasion and metastatic potential in PDAC.
Potential therapeutic targets:
- EGFR: Frequently amplified in PDAC, promoting proliferation, survival, and migration, and exhibiting strong autocrine/paracrine signaling in aneuploid ductal cells. Evidence: CNV analysis shows frequent amplification of 7q14.1:7q21.12 (EGFR) in PDAC Ductal cells (up to ~67% frequency, Section 4). CCI analysis shows strong AREG-EGFR and TGFA-EGFR interactions within Aneuploid Ductal cells (Section 11). GSA shows EGF/EGFR Signaling Pathway enrichment in PDAC Ductal cells (Section 19). Upregulation of ERBB2, another EGFR family member, also seen in Ductal cell surfaceome (Section 15). Validation: Evaluate efficacy of EGFR-targeted therapies (e.g., gefitinib, erlotinib) in PDAC patient subsets with EGFR amplifications, potentially in combination with other treatments.
- CD47/SIRPA axis: CD47 acts as a 'don't eat me' signal, inhibiting phagocytosis by macrophages, contributing to immune evasion. Upregulated in PDAC tumor cells and CD4+ T cells. SIRPA is the macrophage receptor. Evidence: CCI analysis (Sections 12, 13, 14) shows strong SIRPA-CD47 interactions (e.g., Mac|Mac, Mac|T CD8+). Section 17 highlights CD47 upregulation on PDAC CD4+ T cells. Section 16 shows SIRPA upregulation on PDAC macrophages. Validation: Test anti-CD47 antibodies or SIRPA inhibitors to promote macrophage phagocytosis of tumor cells and enhance anti-tumor immunity in PDAC models.
- TGF-beta signaling (TGFB1/TGFBR1): TGF-beta signaling promotes immunosuppression, fibrosis, epithelial-mesenchymal transition (EMT), and tumor progression in PDAC. Evidence: CCI analysis (Section 11) shows strong TGFB1-TGFBR1 interactions within Aneuploid Ductal cells and also with macrophages. GSA also shows TGF-beta Receptor Signaling pathway enrichment in PDAC Ductal cells (Section 19). Section 16 shows TGFBR2 upregulation on PDAC macrophages. Validation: Evaluate TGF-beta pathway inhibitors (e.g., galunisertib) in PDAC models, especially in combination with immunotherapies or agents targeting fibrosis.
- HLA-E/NKG2A axis: HLA-E engaging NKG2A on T and NK cells suppresses anti-tumor immunity, allowing tumor cells to evade immune surveillance. Evidence: CCI analysis (Sections 12, 14) shows HLA-E-CD94:NKG2A (Mac|T CD8+) and HLA-E_KLRC1 (Mac|T CD8+) interactions in PDAC. Section 17 highlights HLA-F (another MHC class I molecule) upregulation on PDAC CD4+ T cells, suggesting broader MHC class I immune evasion mechanisms. Validation: Develop or repurpose therapies targeting HLA-E or NKG2A to reactivate T/NK cell responses in PDAC.
- MET: MET is a receptor tyrosine kinase frequently overexpressed or activated in PDAC, promoting cell proliferation, survival, invasion, and metastasis. Highly accessible surfaceome marker. Evidence: Dot plot (Section 15) shows strong upregulation of MET as a surfaceome marker in PDAC Ductal cells compared to normal. Validation: Develop antibodies or antibody-drug conjugates (ADCs) targeting MET, or evaluate MET inhibitors in PDAC models and patient cohorts.
- ITGB6 (Integrin Beta 6): ITGB6 is an integrin subunit crucial for cell-extracellular matrix interactions, often associated with epithelial-mesenchymal transition (EMT), fibrosis, tumor invasion, and metastasis in PDAC. Highly accessible surfaceome marker. Evidence: Dot plot (Section 15) shows strong upregulation of ITGB6 as a surfaceome marker in PDAC Ductal cells compared to normal. CCI analysis (Sections 12, 14) shows various integrin-mediated interactions in PDAC. Validation: Develop antibodies or inhibitors targeting ITGB6 to disrupt tumor-stroma interactions and inhibit tumor invasion/metastasis in PDAC models.
- PI3K-AKT-mTOR pathway: This pathway is consistently activated in PDAC Ductal cells and other TME cells, driving proliferation, survival, and metabolic reprogramming, central to cancer cell growth and resistance to therapy. Evidence: GSA (Section 19) shows strong enrichment of 'PI3K-AKT-mTOR signaling pathway' in PDAC Ductal cells. GSEA (Section 20) confirms 'PI3K-Akt Signaling Pathway' upregulation across multiple PDAC cell types (Ductal, Endothelial, Macrophage, T cells). Cell cycle genes show high expression in PDAC Ductal cells (Section 18). Validation: Evaluate PI3K/AKT/mTOR inhibitors, alone or in combination, in PDAC models and patient cohorts to inhibit tumor proliferation and survival.
- MAPK signaling pathway: A key pro-survival and proliferative pathway consistently activated in PDAC, driving cell growth and resistance to therapy. Evidence: GSEA (Section 20) confirms 'MAPK Signaling Pathway' upregulation across multiple PDAC cell types (Ductal, Endothelial, Macrophage, T cells). Validation: Evaluate MAPK pathway inhibitors (e.g., MEK inhibitors), alone or in combination with other therapies, in PDAC models and patient cohorts.
Follow-up validation ideas:
- Perform in vitro co-culture experiments with PDAC cells and patient-derived M1-like macrophages to assess their functional anti-tumor activity (e.g., cytokine production, phagocytosis, T cell activation capacity) under TME-mimicking conditions.
- Use CRISPR/Cas9 or small molecule inhibitors to target EGFR, EIF3E, or GSDMD in PDAC cell lines (preferably with corresponding amplifications) and assess effects on cell proliferation, survival, and invasion in vitro and in patient-derived xenograft (PDX) models.
- Employ neutralizing antibodies or genetic knockdowns to disrupt identified cell-cell interactions (e.g., CD47-SIRPA, integrins, TGFB1-TGFBR1) in relevant in vitro (e.g., 3D organoids, co-cultures) and in vivo (e.g., orthotopic PDAC models) models to evaluate their impact on tumor growth, metastasis, and immune modulation.
- Apply spatial transcriptomics or multiplexed imaging (e.g., IMC, CyTOF) to patient PDAC samples to spatially resolve the identified cell types, marker expression, and cell-cell interactions in situ, confirming their co-localization and validating functional hypotheses.
- Correlate the expression of identified surfaceome markers (e.g., MET, ERBB2, SIRPA, CD96) or the activity of enriched pathways (e.g., PI3K-AKT-mTOR, MAPK) in patient biopsies with clinical outcomes (e.g., survival, response to therapy) to establish their prognostic or predictive value.
Limitations:
Single-cell RNA-seq captures mRNA, not protein levels or post-translational modifications, which can be critical for protein function. CellPhoneDB analysis infers cell-cell interactions based on ligand-receptor expression; actual functional interactions require experimental validation. Ploidy inference (Aneuploid/Diploid) is based on gene expression patterns (CNV estimates) and might not capture all genomic alterations or mosaicism. The 'unassigned' cells remain, and while they show some malignant characteristics, their precise identity is unclear. The observed M1 macrophage dominance in PDAC (Section 8) contradicts common understanding (M2 dominance) in many solid tumors, requiring further functional validation.
22. Query List
- Show UMAPs colored by condition, sample, celltype_major, celltype_minor, ploidy_dec, and celltype_subset in 2 columns, and save it.
- Show expression of CD3D, CD4, CD8A, CD79A, MS4A1, MZB1, CD14, LYZ, FBLN1, NOTCH3, EPCAM, MUC1, CD34 on UMAP, along with minor celltype annotation. Set ncols=4 and save it.
- Show the overall Celltype_subset marker expression dot plot and save it. Keep target_cell as None and keep the other arguments at their default values.
- Show a CNV heatmap for Ductal cell (tumor-origin) and unassigned cells, grouped by sample, along with a summary of significantly amplified copy number regions, and save it.
- Show CNV patterns on UMAP, including major celltype, minor celltype, ploidy results, condition, and sample in 2 columns, and save it.
- Show population bar plot for minor cell types and save it.
- Show subset population bar plot for T cells and save it.
- Show subset population bar plot for macrophages and save it.
- If there are significant differences between conditions in T cell subset population, show them as box plots and save them. Determine ncols appropriately based on the total number of panels.
- Show a ploidy population bar plot for Ductal cell (tumor-origin) and unassigned cells, and save it.
- Show cell-cell interaction patterns per condition, focusing on Ductal cell, Fibroblast, Macrophage, T cell CD4+, and T cell CD8+, up to 80 interactions per condition, and save it.
- Show cell-cell interactions by condition and save the result. Select at most 80 cell-cell interactions for each condition.
- Show cell-cell interactions for genes related to immune checkpoint and cell cycle pathways, and save it.
- Find statistically significant differences in cell-cell interactions between conditions for major immune and stromal cells, show them as a dot plot, set max_n_items_per_group = 25, and save it.
- Show the condition-specific markers for tumor-origin cells (Ductal cell) as a dot plot and save the result. Use only surfaceome markers, up to 50 markers per condition.
- Extract condition-specific markers for macrophages, show them as a dot plot, include only surfaceome markers, up to 50 per condition, and save it.
- Extract condition-specific markers for CD4 T cells, show them as a dot plot, include only surfaceome markers, up to 50 per condition, and save it.
- For genes related to the Cell cycle pathway, find statistically significant differences in expression between conditions for Ductal cell, Macrophage, and T cell CD8+, show them as box plots, set max_n_items_to_plot = 24, and determine ncols such that the width x height ratio is approximately 2x3, and save it.
- Show Gene Ontology (GSA) analysis results as a bar plot for Ductal cell and Acinar cell, and save it.
- Show Gene set enrichment analysis (GSEA) results as a dot plot for Acinar cell, Ductal cell, Endothelial cell, Macrophage, Mast cell, T cell CD4+, T cell CD8+. Use 'RdBu_r' for color map, set n_pws_to_show = 80, and save it.