Single-Cell Transcriptomic and Intercellular Communication Landscape in Human Pancreas Across Type 1 Diabetes Progression
This report characterizes the cellular composition and molecular changes in the human pancreas through the progression of Type 1 Diabetes (T1D), from autoantibody-positive (AAB+) individuals to established T1D patients, compared to non-diabetic controls. Key findings include a significant reduction of Beta cells in T1D, widespread inflammatory and immune activation across all pancreatic cell types, and a profound disruption of islet cell-cell communication in overt T1D. Notably, the AAB+ state exhibits early signs of pan-pancreatic immune activation and specific dysregulation of TGF-beta signaling, highlighting early pathogenic events beyond direct Beta cell attack.
Contents
- Dataset overview
- UMAP Visualization of Pancreatic Single-Cell RNA-seq Data by Condition, Sample, and Cell Type
- Gene Expression Profile and Minor Cell Type Annotation on UMAP
- Celltype_subset Marker Gene Expression Dot Plot Interpretation
- Cell Type Population Analysis in Pancreatic Samples Across Diabetes Conditions
- Pancreatic Cell-Cell Interaction Dynamics in Diabetes Progression
- Immune Checkpoint and Cell Cycle Pathway-Related Cell-Cell Interactions in Pancreatic T1D Progression
- Condition-Specific Cell-Cell Interaction Patterns in Pancreatic Cell Types
- Fibroblast Condition-Specific Surfaceome Markers in Pancreatic Disease
- Upregulated Gene Ontology Pathways in Pancreatic Cell Types Across Diabetes Conditions
- Gene Set Enrichment Analysis Reveals Widespread Pancreatic Dysfunction and Inflammatory Activation in Type 1 Diabetes and Autoantibody-Positive States
- Discussion
- Query List
0. Dataset overview
Dataset Summary
- Data Type: Single-cell RNA-seq data (AnnData format).
- Dimensions: Contains 87,200 cells and 30,501 genes.
- Species & Tissue: Human pancreas.
- Conditions: Three experimental conditions: 'type1_diabetes', 'non_diabetic', 'autoantibody_positive'. 'non_diabetic' is the reference condition for differential analyses.
- Cell Types: Annotated at major, minor, and subset levels, including 'Acinar cell', 'Ductal cell', 'Stromal cell', 'Alpha cell', 'Delta cell', 'Beta cell', 'Fibroblast', 'Stellate cell', and 'unassigned'.
- Observation Columns (Cell Metadata): Includes 'sample', 'donor', 'condition', 'sex', 'celltype_major', 'celltype_minor', 'celltype_subset', and 'cluster', among others.
Precomputed Results
- Cell-Cell Interaction (CCI): Results available per condition and per sample ('CCI', 'CCI_sample').
- Differential Expression Genes (DEG): Results available per celltype_minor, comparing conditions against others ('DEG') or against the 'non_diabetic' reference ('DEG_vs_ref').
- Gene Set Enrichment Analysis (GSEA): Results available per celltype_minor, comparing conditions against others ('GSEA') or against the 'non_diabetic' reference ('GSEA_vs_ref').
- Gene Ontology (GO) / Gene Set Analysis (GSA): Up-regulated results available per celltype_minor, comparing conditions against others ('GSA_up') or against the 'non_diabetic' reference ('GSA_vs_ref_up').
1. UMAP Visualization of Pancreatic Single-Cell RNA-seq Data by Condition, Sample, and Cell Type
[Analysis Visualization Results]...
Analysis Overview
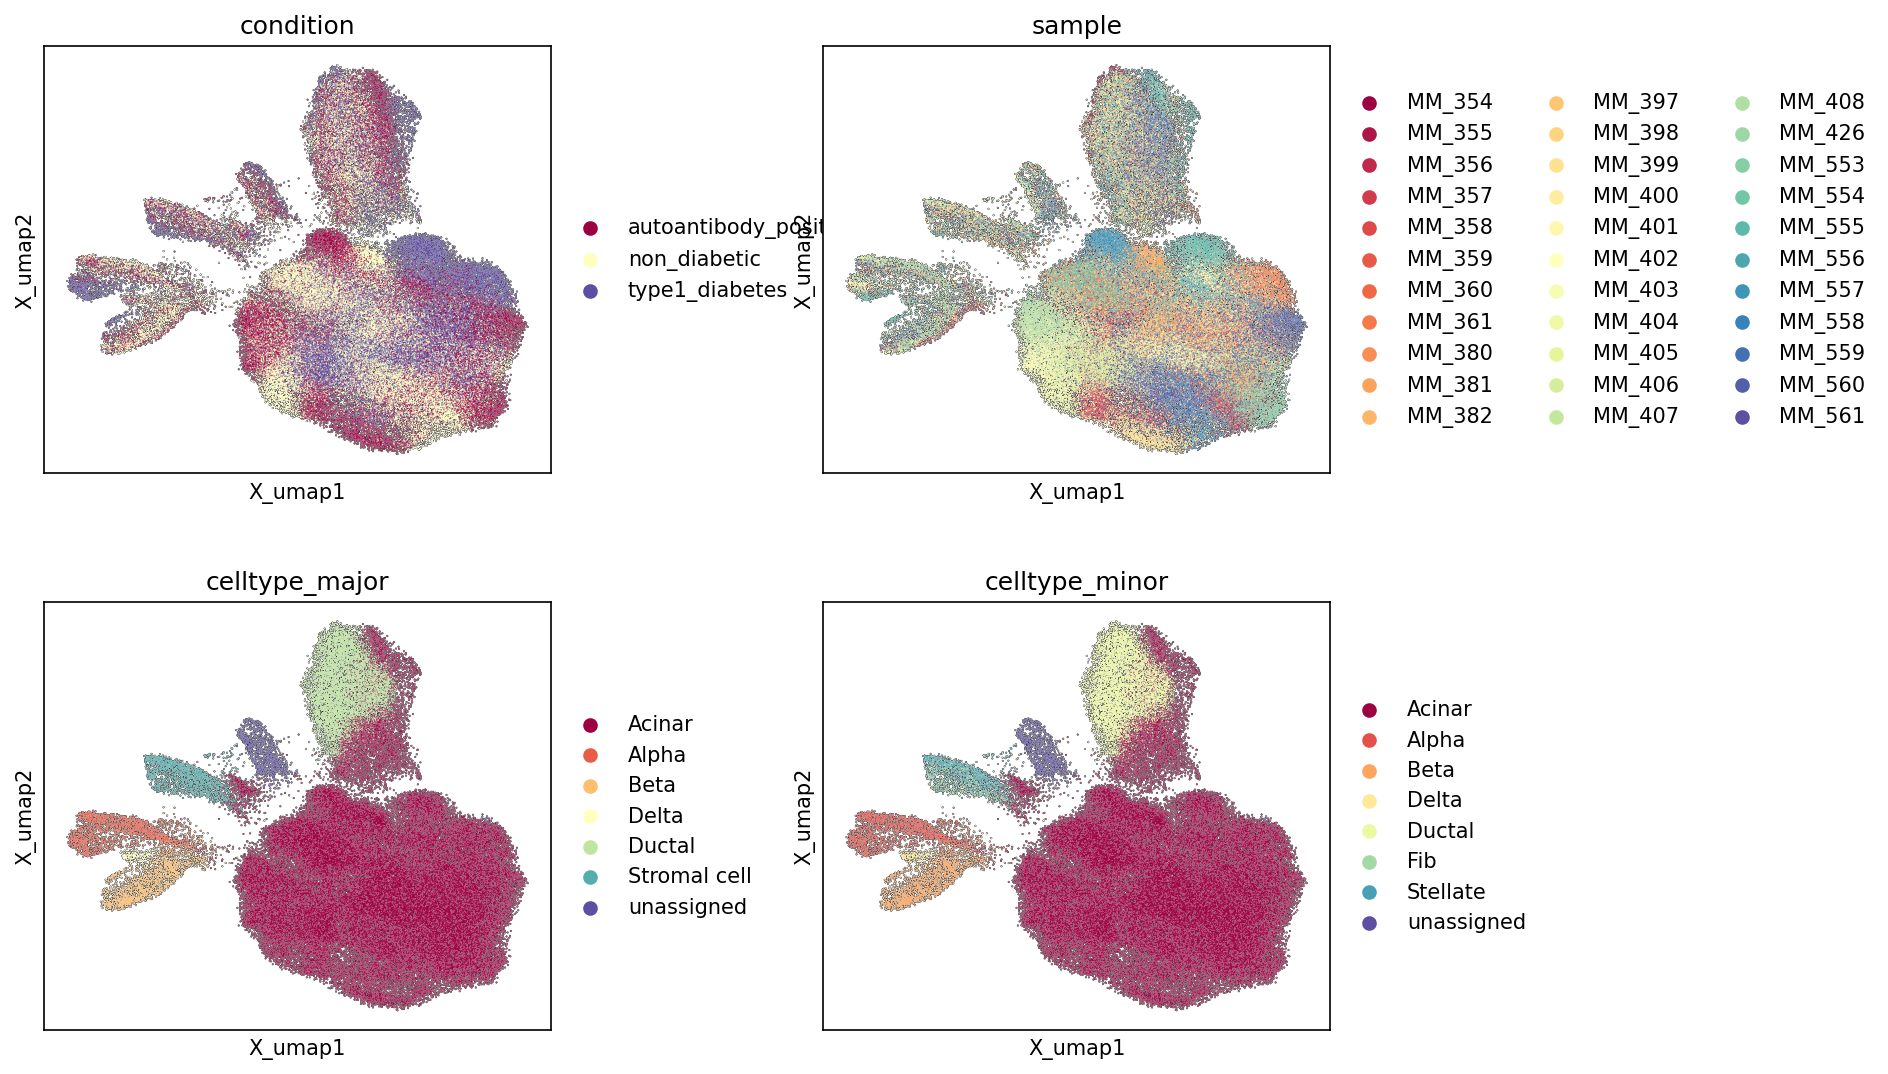
This analysis presents Uniform Manifold Approximation and Projection (UMAP) plots of single-cell RNA-seq data from the human pancreas, showcasing the global transcriptomic landscape colored by different metadata categories: disease condition, individual sample, major cell type, and minor cell type. These plots are essential for assessing data quality, cell type annotation accuracy, and the presence of technical variability (e.g., batch effects) or biological variation associated with disease conditions.
Visual Summary
The UMAP plots provide a comprehensive overview of the dataset's structure:
- Condition UMAP: Cells from 'non_diabetic' individuals appear widely distributed across the major clusters, forming a substantial component of the largest central cluster. 'type1_diabetes' and 'autoantibody_positive' cells show a noticeable co-localization, particularly in certain peripheral clusters, suggesting shared disease-associated transcriptional states. While conditions are largely intermixed within the main pancreatic parenchymal cell clusters (e.g., Acinar cells), there are regions, particularly a cluster towards the upper right of the UMAP space, that show a higher enrichment of 'autoantibody_positive' and 'type1_diabetes' cells.
- Sample UMAP: The distribution of individual samples across the UMAP space indicates good integration of data. Cells from different samples are generally intermixed within the major clusters, rather than forming sample-specific isolated clusters. This suggests that technical batch effects related to individual samples are minimal and unlikely to confound biological interpretations.
- Celltype_major UMAP: This plot clearly demonstrates distinct clustering of major pancreatic cell types. Acinar cells constitute the largest and most densely populated cluster. Pancreatic islet cells—Alpha, Beta, and Delta cells—form distinct but spatially proximal clusters, indicating their related developmental origin and functional roles within the islets. Ductal cells and Stromal cells also form well-defined, separate clusters. An 'unassigned' category is present, which mostly co-localizes with the region enriched in 'type1_diabetes' and 'autoantibody_positive' conditions.
- Celltype_minor UMAP: This plot refines the cell type annotations, maintaining the overall structure seen in the 'celltype_major' plot. The key refinement is the breakdown of 'Stromal cell' (from celltype_major) into 'Fibroblast' and 'Stellate cell', which appear as distinct but related populations within the broader stromal compartment. Acinar, Alpha, Beta, Delta, and Ductal cell clusters remain consistent with the major cell type annotations, confirming the robustness of these classifications. The 'unassigned' population also persists in a similar spatial location.
Biological Interpretation
The UMAP visualizations provide critical insights into the biological structure of the pancreatic single-cell dataset:
- Robust Cell Type Identification: The clear separation of major and minor cell types into distinct clusters confirms the high quality and specificity of the cell type annotations. This robust classification is foundational for accurate cell-type-specific differential expression, pathway analysis, and cell-cell interaction studies. The hierarchical annotation from celltype_major to celltype_minor (e.g., Stromal cell splitting into Fibroblast and Stellate) is biologically sound, reflecting the heterogeneity within stromal compartments of the pancreas. [Reference: Pancreatic Cell Types - GeneCards: GeneCards]
- Minimal Sample-Specific Batch Effects: The intermixing of cells from different samples within biological clusters (rather than forming sample-specific clumps) suggests successful removal or mitigation of technical variability. This enhances confidence that any observed differences between conditions are likely to be biological rather than artifacts of sample processing or sequencing.
- Condition-Associated Cell States:
- The intermingled distribution of conditions within the large Acinar cell cluster suggests that the fundamental transcriptional identity of Acinar cells may be largely preserved across 'non_diabetic', 'autoantibody_positive', and 'type1_diabetes' states, at least at this global transcriptional level.
- The observed enrichment of 'type1_diabetes' and 'autoantibody_positive' cells in specific, often peripheral, UMAP regions (particularly the top-right cluster) is a significant finding. This suggests that certain cell populations or states are disproportionately represented or transcriptionally altered in individuals with or at risk for Type 1 Diabetes. This region prominently features cells annotated as 'unassigned', which could represent immune infiltrates (common in Type 1 Diabetes pathogenesis) or specific disease-perturbed pancreatic cell states not fitting into standard annotations. [Reference: Type 1 Diabetes Pathogenesis - PubMed: Link]
- Implications for Disease Mechanisms: The distinct clustering of various islet cell types (Alpha, Beta, Delta) is crucial for studying Type 1 Diabetes, where Beta cells are the primary targets of autoimmune destruction. Although Beta cells (yellow in celltype_major/minor) are predominantly found in the central region shared across conditions, the specific enrichment of 'type1_diabetes' and 'autoantibody_positive' cells in the 'unassigned' cluster warrants further investigation. This 'unassigned' population could be critical for understanding early disease progression or immune responses.
Clinical or Translational Implications
The UMAP analysis provides a foundational understanding of the cellular landscape in Type 1 Diabetes:
- Identifying Disease-Relevant Cell Populations: The enrichment of 'type1_diabetes' and 'autoantibody_positive' cells in specific 'unassigned' clusters highlights potential populations of interest for further investigation. These could include novel cell states, stressed pancreatic cells, or crucial immune cell infiltrates that are not yet explicitly annotated but are highly relevant to disease pathogenesis. Detailed characterization of these 'unassigned' cells could reveal new biomarkers or therapeutic targets.
- Context for Downstream Analyses: The validated cell type annotations and the absence of major batch effects set a strong basis for subsequent differential expression, cell-cell interaction, and pathway analyses. These downstream analyses can now confidently focus on identifying specific molecular changes within each cell type under 'autoantibody_positive' and 'type1_diabetes' conditions relative to 'non_diabetic' controls, particularly in the islet cells and potentially the 'unassigned' populations.
2. Gene Expression Profile and Minor Cell Type Annotation on UMAP
[Analysis Visualization Results]...
Analysis Overview
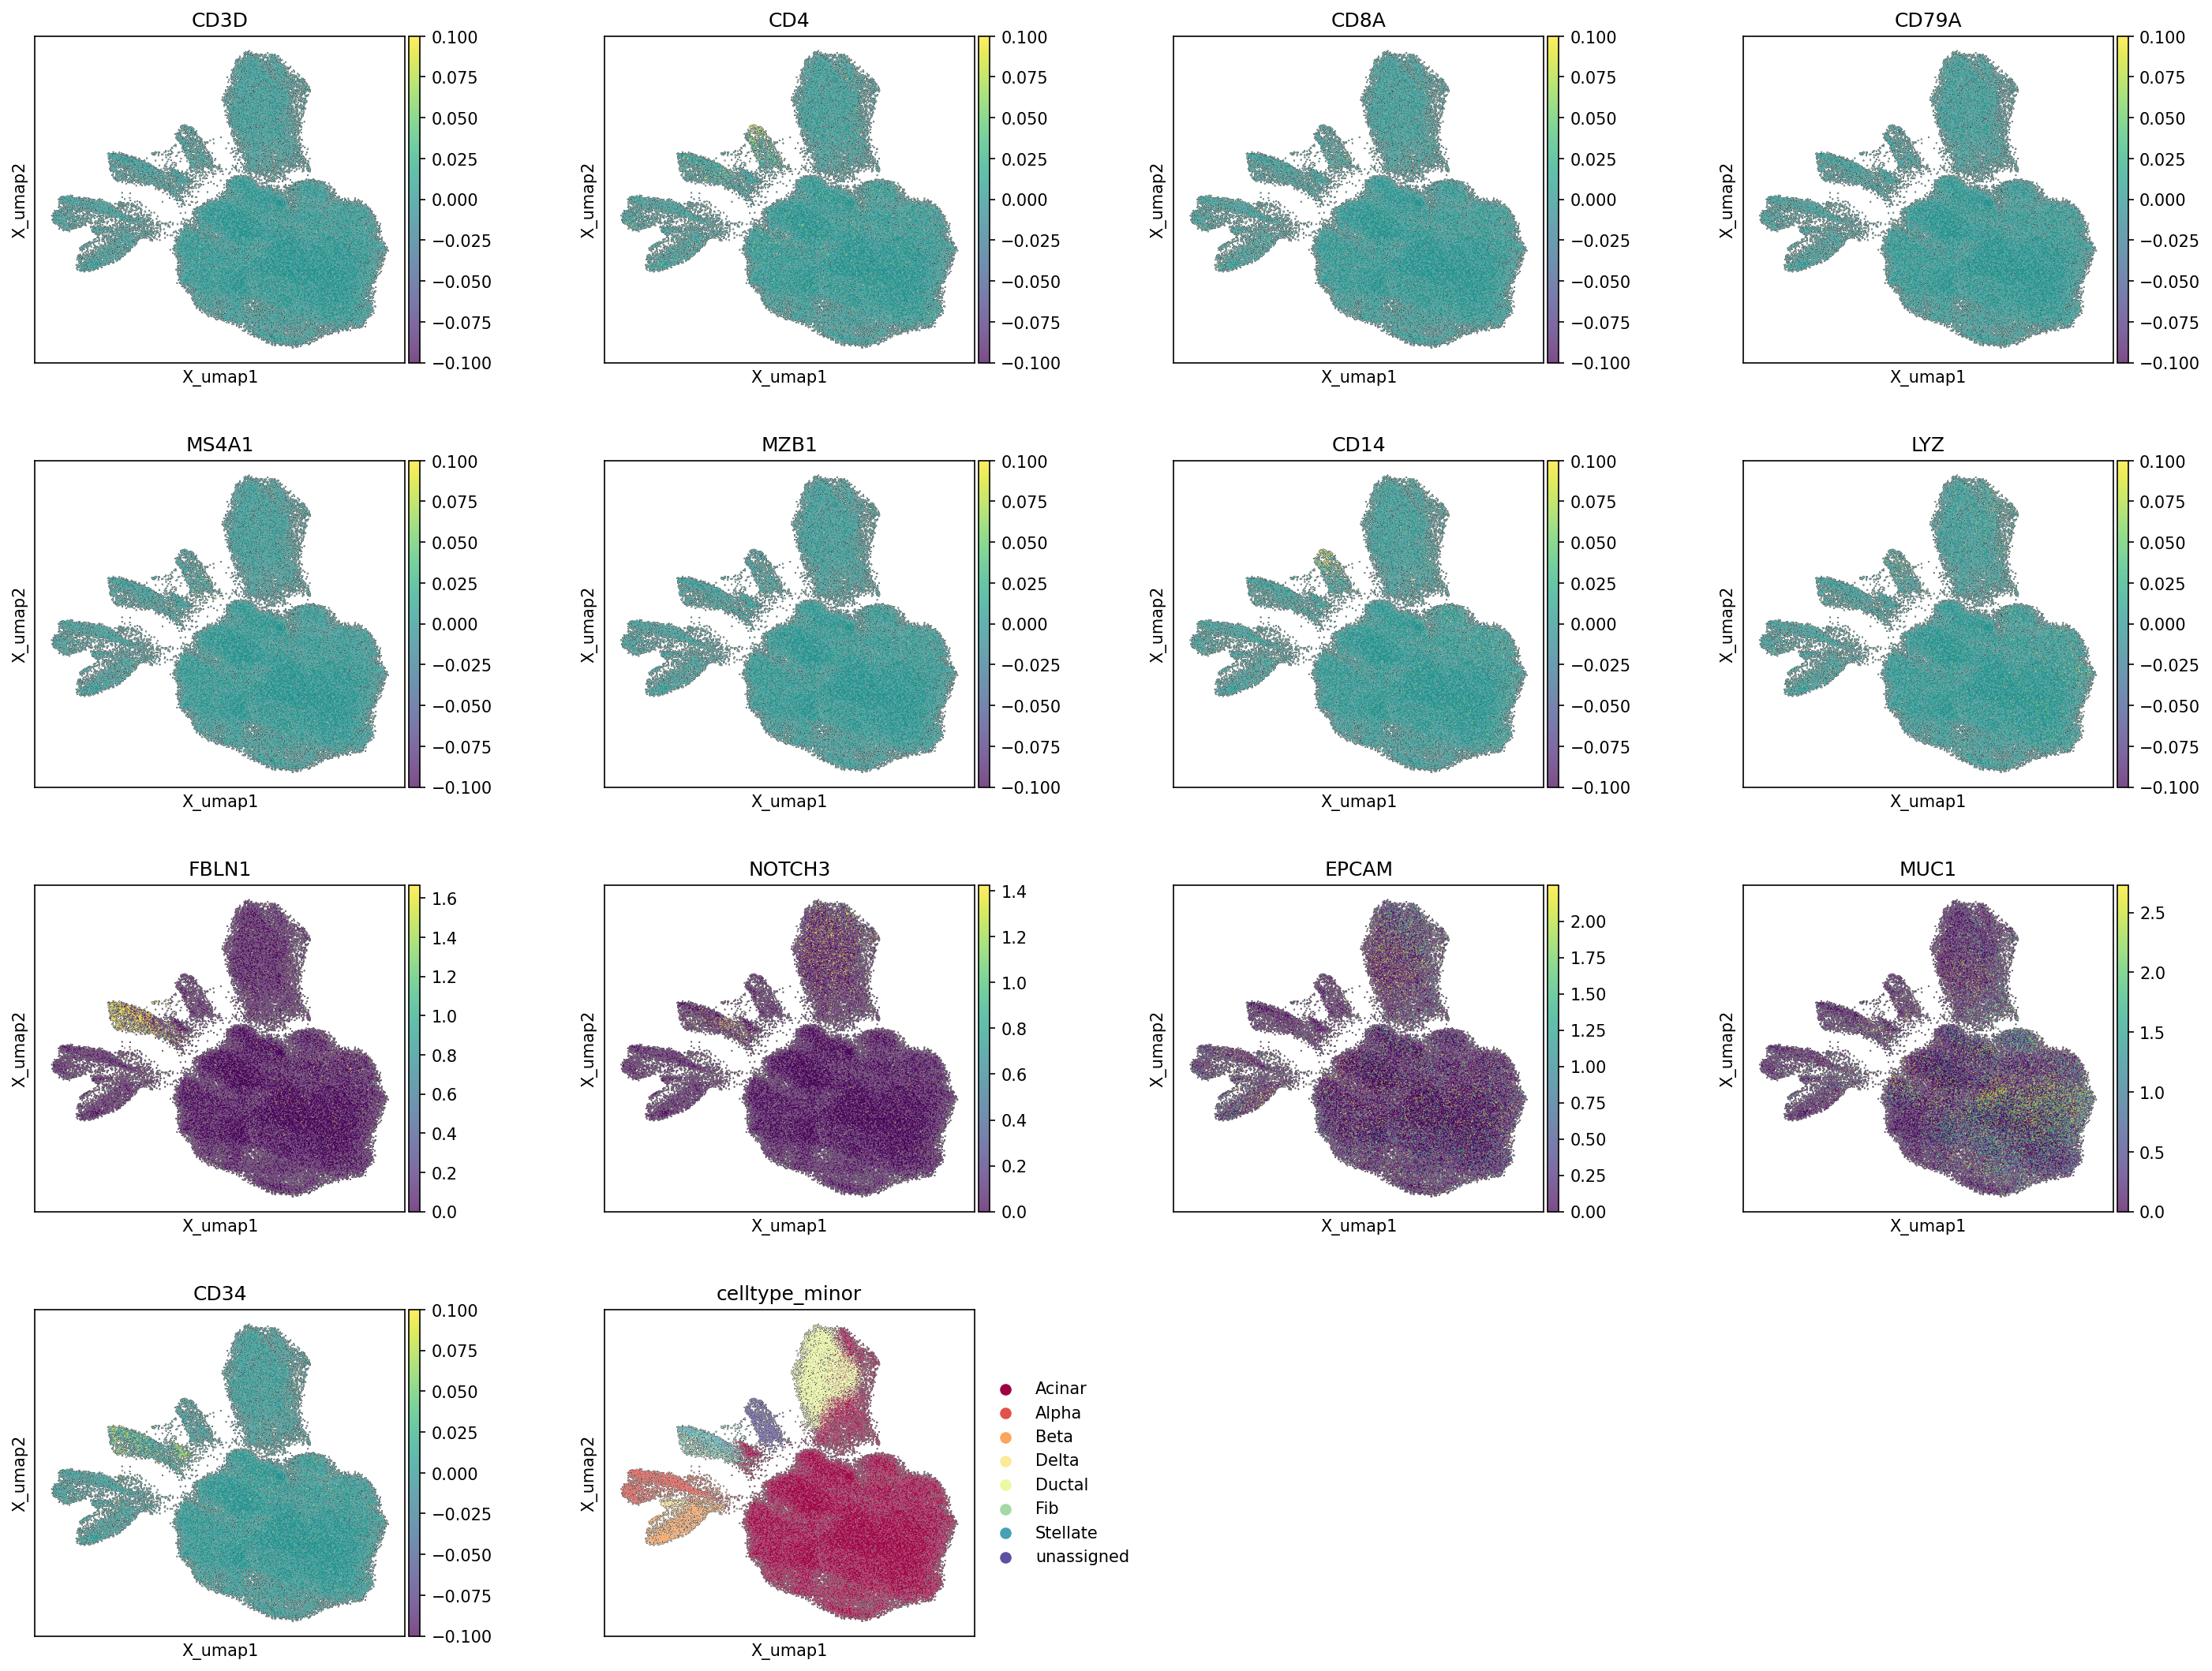
This analysis visualizes the expression of a panel of specific marker genes (CD3D, CD4, CD8A, CD79A, MS4A1, MZB1, CD14, LYZ, FBLN1, NOTCH3, EPCAM, MUC1, CD34) on a UMAP embedding generated from human Pancreas single-cell RNA-seq data. Alongside gene expression, the UMAP is also annotated by celltype_minor, allowing for direct visual assessment of cell type identities and the distribution of marker gene expression across different populations. The primary goal is to evaluate the quality of existing cell type annotations and confirm cell identities based on known marker gene expression patterns.
Visual Summary
The UMAP plots display the distribution of 87,200 cells in a 2-dimensional embedding. Each subplot is colored either by the expression level of a specific gene (ranging from low/teal to high/yellow-purple) or by the assigned celltype_minor annotation.
- celltype_minor Annotation: The celltype_minor UMAP plot reveals several distinct and well-separated clusters. A large cluster in the lower right represents "Acinar cells". The upper-central region contains interconnected clusters of "Alpha cell", "Beta cell", and "Delta cell" (pancreatic islet cells). The left arm of the embedding features clusters for "Ductal cell", "Fibroblast", and "Stellate cell". A small, less defined cluster is labeled "unassigned".
- Immune Cell Markers (CD3D, CD4, CD8A, CD79A, MS4A1, MZB1, CD14, LYZ): These genes, typically associated with various immune cell types, show very sparse and low-level expression across the entire UMAP. While a few scattered cells exhibit faint yellow signals, there are no distinct, prominent clusters that strongly express these markers and align with any of the major celltype_minor annotations. The maximum expression values on the color scales for these markers are consistently low (around 0.1), suggesting that either these immune cell types are rare in the dataset, highly dispersed, or not robustly captured and annotated at the celltype_minor level.
Stromal Cell Markers (FBLN1, NOTCH3)
- FBLN1 shows strong and specific expression primarily within the "Fibroblast" and "Stellate cell" clusters (the green and blue clusters on the left arm of the UMAP), confirming their identity as stromal populations.
- NOTCH3 displays moderate expression, predominantly localized to a subset of cells within the stromal compartment (overlapping with Fibroblast/Stellate regions) and some other scattered cells, indicating potential heterogeneity or specific functions within the stromal population.
Epithelial Cell Markers (EPCAM, MUC1)
- EPCAM exhibits widespread and high expression across all major pancreatic epithelial cell types, including "Acinar", "Alpha", "Beta", "Delta", and "Ductal" cells. This pattern effectively delineates the epithelial compartment from the stromal cells and confirms EPCAM's role as a general epithelial marker 1.
- MUC1 shows strong expression localized mainly within the "Ductal cell" cluster, with some lower expression also observed in Acinar cells. This is consistent with MUC1's known association with pancreatic ductal epithelium 2.
- Endothelial/Hematopoietic Marker (CD34): CD34 displays sparse and relatively low expression in scattered cells, primarily within or adjacent to the stromal cell compartments. This expression pattern suggests the presence of a minor population, potentially endothelial cells or other hematopoietic/mesenchymal progenitors, but it does not form a distinct, well-defined cluster 3.
Biological Interpretation
The UMAP visualization, combined with the expression patterns of these marker genes, provides critical insights into the cellular landscape and annotation quality of the pancreatic single-cell dataset.
- Robust Annotation of Pancreatic Epithelial and Stromal Cells: The expression of FBLN1, EPCAM, and MUC1 strongly validates the celltype_minor annotations for Fibroblasts, Stellate cells, and the various epithelial cell types (Acinar, Ductal, Alpha, Beta, Delta). FBLN1 is a key extracellular matrix protein and a reliable marker for pancreatic fibroblasts and stellate cells 4. EPCAM consistently marks the entire epithelial compartment, encompassing both the exocrine (acinar, ductal) and endocrine (islet) populations. The concentrated expression of MUC1 in ductal cells further confirms their identity. The localized expression of NOTCH3 within stromal clusters points towards functional or developmental heterogeneity within these mesenchymal populations, potentially marking specific stromal subsets or pericytes 5.
- Limited Representation of Immune Cell Populations: A significant observation is the very low and dispersed expression of classical immune cell markers. This indicates that major immune cell populations (e.g., T cells, B cells, macrophages) are either present in very low numbers in this dataset, not forming well-defined clusters in this embedding, or were potentially filtered out during upstream processing. Given the data context includes conditions like 'type1_diabetes' and 'autoantibody_positive', which are characterized by immune cell infiltration and activity in the pancreas, the absence of clear immune cell clusters at the celltype_minor level is a critical point for further consideration.
- Presence of Minor Vascular/Progenitor Cells: The sparse detection of CD34 suggests the presence of a minor population that could include endothelial cells (lining blood vessels) or other mesenchymal stem/progenitor cells, which are typically found within the stromal niche of tissues. These cells do not form a prominent cluster, implying they are either rare or broadly distributed.
Annotation Notes
- The celltype_minor annotations for the major pancreatic epithelial and stromal cell types are well-supported by the specific expression patterns of the investigated marker genes, affirming the quality and accuracy of these assignments.
- The current celltype_minor annotation appears to primarily focus on the parenchymal and resident stromal cells of the pancreas. Further refinement or a dedicated annotation pass for immune cells might be necessary if immune dynamics are a central aspect of the biological questions, especially considering the disease conditions in the dataset (Type 1 Diabetes, autoantibody positivity) which are known to involve significant immune activity.
- The "unassigned" cluster does not show strong or unique enrichment for any of the tested markers, suggesting it may represent a heterogeneous group, cells of low quality, or populations requiring a different set of markers for proper identification.
---
References:
- EPCAM GeneCards: Epithelial Cell Adhesion Molecule. https://www.genecards.org/cgi-bin/carddisp.pl?gene=EPCAM
- MUC1 GeneCards: Mucin 1, Cell Surface Associated. https://www.genecards.org/cgi-bin/carddisp.pl?gene=MUC1
- CD34 GeneCards: CD34 Molecule. https://www.genecards.org/cgi-bin/carddisp.pl?gene=CD34
- FBLN1 GeneCards: Fibulin 1. https://www.genecards.org/cgi-bin/carddisp.pl?gene=FBLN1
- NOTCH3 GeneCards: Notch Receptor 3. https://www.genecards.org/cgi-bin/carddisp.pl?gene=NOTCH3
3. Celltype_subset Marker Gene Expression Dot Plot Interpretation

[Analysis Visualization Results]...
Analysis Overview
This analysis presents a dot plot illustrating the expression of key marker genes across different celltype_subset populations identified in the Pancreas single-cell RNA-seq dataset. The primary goal of this visualization is to validate the assigned cell type annotations by demonstrating the specific and enriched expression of known canonical markers for each cell population. The analysis identified potential surfaceome-only markers for this plot, which is useful for cell identification and potentially for cell sorting or therapeutic targeting strategies.
Visual Summary
The dot plot displays celltype_subset groups on the y-axis and marker genes on the x-axis, with genes grouped by the cell type they are intended to mark. Each dot's size represents the fraction of cells within a group that express a particular gene, while its color intensity indicates the mean expression level of that gene within the group (darker red signifies higher mean expression). Red boxes visually highlight the primary marker genes for each respective celltype_subset, indicating strong, specific expression. A legend on the right clarifies the mapping of dot size to the percentage of expressing cells and color intensity to mean expression values. The total number of cells for each celltype is also provided on the right.
Biological Interpretation
The visualization effectively demonstrates distinct gene expression profiles that strongly support the current celltype_subset annotations within the human Pancreas dataset.
- Acinar cells: These cells show robust and highly specific expression of canonical acinar cell markers, including genes involved in digestive enzyme synthesis and secretion such as *PRSS1* (Trypsin 1) GeneCards: PRSS1, *CPA1* (Carboxypeptidase A1), *AMY2B* (Amylase Alpha 2B), and *PNLIPRP1* (Pancreatic Lipase Related Protein 1). The high expression levels and prevalence of these markers confirm the identity of the acinar cell population.
- Alpha cells: Characterized by the prominent expression of *GCG* (Glucagon) GeneCards: GCG, the primary hormone produced by these cells. Other markers like *RFX6* (Regulatory Factor X6), a key transcription factor for islet cell development, and *SLC30A8* (Solute Carrier Family 30 Member 8), involved in zinc transport for insulin crystal formation, are also highly expressed, consistent with their established identity.
- Beta cells: These cells display high and specific expression of *INS* (Insulin) GeneCards: INS, the hallmark hormone of beta cells. Other important markers include *IAPP* (Islet Amyloid Polypeptide), *PCSK1* (Proprotein Convertase Subtilisin/Kexin Type 1), and *NKX6-1* (NK Homeobox Family 6 Member 1), a crucial transcription factor for beta cell function and identity. The co-expression of *SLC30A8* with alpha cells is also notable, reflecting its general role in islet zinc homeostasis.
- Delta cells: These cells are distinctly marked by *SST* (Somatostatin) GeneCards: SST, the primary hormone secreted by delta cells, along with *PCSK1*, which is involved in processing pro-somatostatin. This expression pattern confirms the delta cell population.
- Ductal cells: Key markers such as *CFTR* (Cystic Fibrosis Transmembrane Conductance Regulator) GeneCards: CFTR, *KRT7* (Keratin 7), and *ANXA4* (Annexin A4) show high and specific expression in this population, consistent with their epithelial nature and role in fluid and electrolyte transport.
- Fibroblast cells: These stromal cells are identified by the expression of classic mesenchymal markers, including *DCN* (Decorin) GeneCards: DCN, *COL1A1* (Collagen Type I Alpha 1 Chain), *COL3A1* (Collagen Type III Alpha 1 Chain), *FAP* (Fibroblast Activation Protein), and *PDGFRA* (Platelet-Derived Growth Factor Receptor Alpha). This profile clearly distinguishes them as fibroblasts involved in extracellular matrix production.
- Stellate cells: Pancreatic stellate cells, which share mesenchymal characteristics with fibroblasts, exhibit prominent expression of markers such as *PDGFRA*, *SPARC* (Secreted Protein Acidic And Rich In Cysteine) GeneCards: SPARC, *COL1A1*, and *FN1* (Fibronectin 1). These markers are indicative of their roles in extracellular matrix remodeling and potential activation in pathological conditions.
The overall pattern shows high specificity, with most markers predominantly expressed in their assigned cell type, ensuring robust cell type identification. The surfaceome_only parameter applied during marker discovery further refines the selection of markers to those potentially accessible on the cell surface, which can be valuable for experimental validation or therapeutic targeting.
Annotation Notes
The dot plot provides strong evidence that the celltype_subset annotations are accurate and well-supported by canonical marker gene expression. Each cell type displays a unique and highly enriched set of genes, demonstrating good separation and clear identity for each population. This robust marker expression pattern validates the quality of the cell type assignments in the dataset, which is crucial for downstream differential expression and pathway analyses. The few instances of shared markers (e.g., *SLC30A8* across alpha and beta cells, *PCSK1* across beta and delta cells) are biologically meaningful and do not detract from the overall specificity of the cell type definitions.
4. Cell Type Population Analysis in Pancreatic Samples Across Diabetes Conditions
[Analysis Visualization Results]...
Analysis Overview
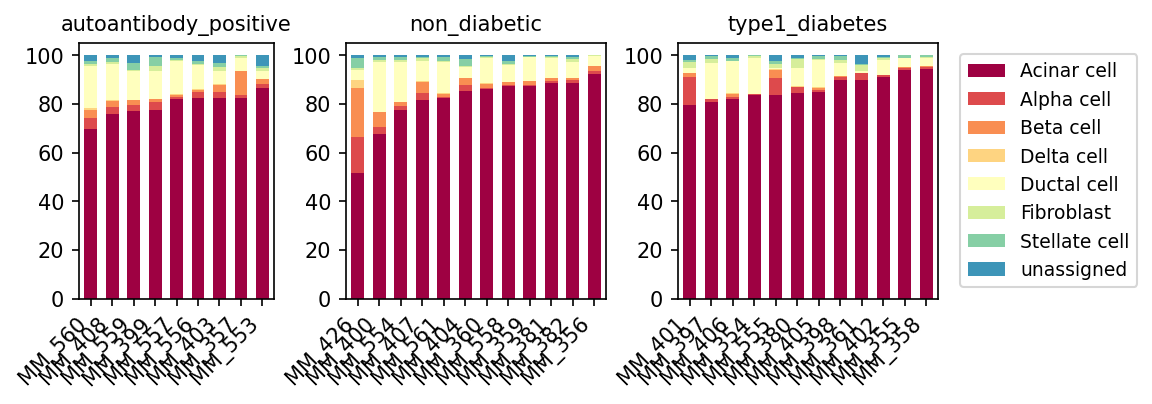
This analysis presents a bar plot illustrating the relative proportions of minor cell types within individual pancreatic samples, grouped by three distinct conditions: autoantibody-positive (a pre-diabetic state), non-diabetic (control), and type 1 diabetes. Each bar represents a single sample, and the stacked segments within each bar denote the percentage contribution of different cell types, providing a comprehensive overview of cellular composition heterogeneity across conditions and donors.
Visual Summary
The bar plot provides a clear visual representation of the cellular landscape across different pancreatic samples and conditions.
- Acinar cell dominance: Acinar cells (dark red) constitute the predominant cell type across all samples and conditions, typically accounting for 70-90% or more of the total cells. This is expected given their role as the major exocrine component of the pancreas.
- Beta cell reduction in Type 1 Diabetes: A notable observation is the visibly reduced proportion of Beta cells (orange) in samples from individuals with type 1 diabetes compared to non-diabetic and autoantibody-positive individuals. In several type 1 diabetes samples, the orange segment representing Beta cells is either very thin or almost absent.
- Alpha cell presence: Alpha cells (red) are consistently present across all conditions, appearing as a minor but distinct population. Their proportion seems relatively more preserved or even slightly increased in some type 1 diabetes samples, potentially due to the loss of Beta cells.
- Other cell types: Ductal cells (light yellow) represent a consistent, albeit smaller, proportion across all samples. Delta cells (light orange), Fibroblasts (light green), and Stellate cells (teal) are present in very minor proportions. The "unassigned" category (blue) is consistently small, indicating a high quality of cell type annotation.
- Sample variability: While general trends are observable per condition, there is also some variability in cell type proportions among individual samples within each condition, which is common in biological datasets.
Biological Interpretation
The observed cell type proportions align well with the known pathophysiology of type 1 diabetes (T1D) and the general cellular composition of the human pancreas.
- Pancreatic Exocrine Composition: The overwhelming dominance of Acinar cells reflects their functional role in producing digestive enzymes and constituting the majority of the pancreatic mass [1]. Ductal cells, involved in bicarbonate secretion and forming the pancreatic duct system, are also a significant exocrine component.
- Beta Cell Loss in Type 1 Diabetes: The dramatic reduction or near absence of Beta cells in the type 1 diabetes samples is a hallmark of the disease. T1D is an autoimmune condition characterized by the selective destruction of insulin-producing pancreatic Beta cells, leading to insulin deficiency and hyperglycemia [2]. This visual evidence strongly supports the immune-mediated pathogenesis of T1D.
- Alpha Cell Dynamics: While Beta cells are destroyed in T1D, Alpha cells, which produce glucagon, are generally more resistant to autoimmune attack. The relative preservation or even slight increase in Alpha cell proportion in T1D could be due to a numerical enrichment as Beta cells are lost, or it might reflect changes in islet architecture and cell-cell interactions [3]. Aberrant glucagon secretion from Alpha cells further contributes to hyperglycemia in T1D.
- Autoantibody-Positive State: Individuals who are autoantibody-positive but not yet diabetic represent a pre-diabetic stage with ongoing autoimmunity. The Beta cell proportions in this group appear more similar to non-diabetic controls, suggesting that overt Beta cell destruction might not be widespread in all samples at this specific stage of disease progression, or that compensatory mechanisms are still active. This group is critical for studying early disease mechanisms and interventions.
Clinical or Translational Implications
- Validation of Disease Model: The clear depletion of Beta cells in type 1 diabetes samples serves as a robust validation of the dataset's relevance for studying T1D pathology at a single-cell resolution.
- Understanding Disease Progression: The comparison between autoantibody-positive, non-diabetic, and type 1 diabetes conditions provides a foundation for investigating the cellular changes during T1D progression. Future analyses (e.g., DEG, GSEA) can explore how gene expression and cellular interactions shift in the remaining Beta cells or other cell types in the autoantibody-positive stage, potentially identifying early biomarkers or therapeutic targets.
- Therapeutic Strategies: Beyond insulin replacement, understanding the fate of Alpha cells and other endocrine and exocrine cells in T1D can inform strategies to manage glucagon dysregulation or preserve remaining pancreatic function [4].
---
References
- Pancreatic Anatomy & Histology:
PubMed Search: "human pancreas histology"
- Type 1 Diabetes Pathophysiology (Beta cell destruction):
PubMed Search: "type 1 diabetes beta cell destruction"
- Alpha Cell Function in Type 1 Diabetes:
PubMed Search: "alpha cell type 1 diabetes glucagon"
- Novel Therapies for Type 1 Diabetes:
PubMed Search: "type 1 diabetes novel therapies"
5. Pancreatic Cell-Cell Interaction Dynamics in Diabetes Progression
[Analysis Visualization Results]...
Analysis Overview
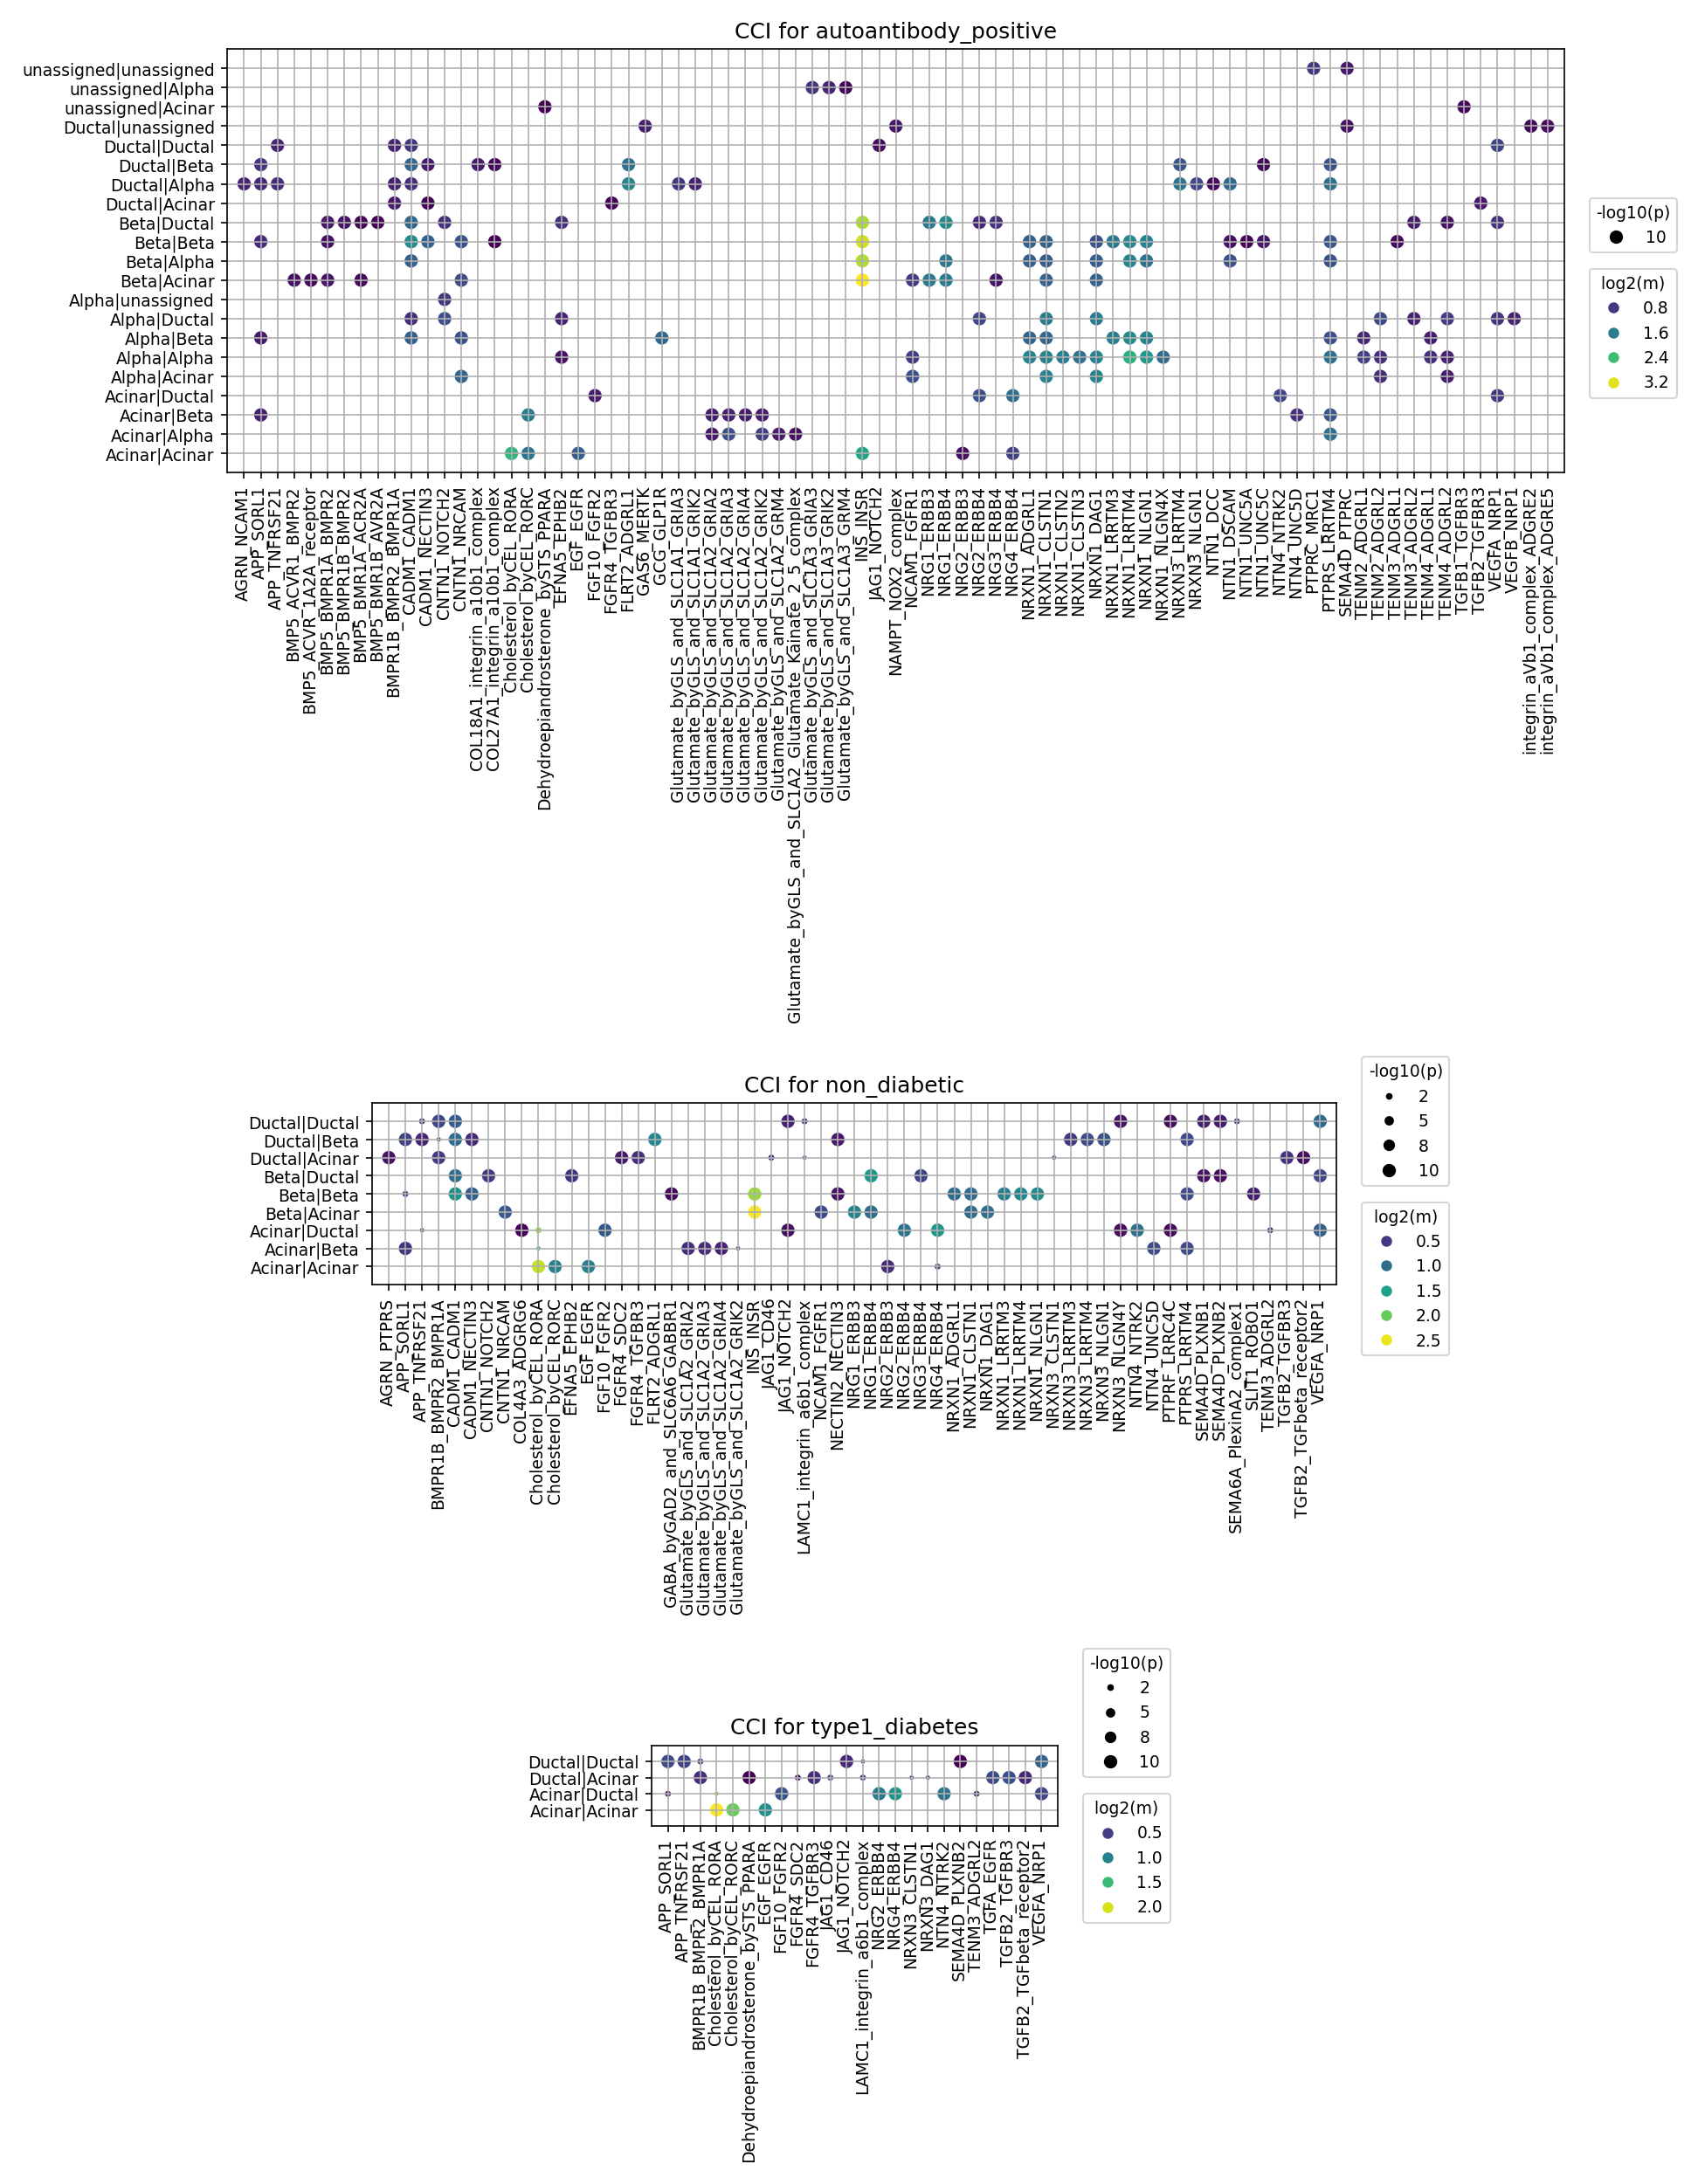
This analysis investigates cell-cell interaction (CCI) networks within the human pancreas across three distinct conditions: non_diabetic (healthy control), autoantibody_positive (a pre-diabetic state), and type1_diabetes (overt Type 1 Diabetes). CellPhoneDB was used to identify ligand-receptor interactions, and the results are visualized as dot plots, where dot size reflects interaction significance (-log10(p-value)) and color intensity indicates interaction strength (log2(mean)). The analysis focuses on the top 80 most significant interactions for each condition.
Visual Summary
The provided dot plots reveal distinct patterns of cell-cell communication for each condition:
- CCI for autoantibody_positive: This plot displays a rich and diverse network of cell-cell interactions, involving various cell types including Acinar, Alpha, Beta, Ductal, and their cross-interactions. Many interactions show high significance (large dots) and strong mean expression (bright yellow/green colors), suggesting active and widespread communication. Prominent interactions include those involving Glutamate complexes, NRG-ERBB signaling, NTN, SEMA, FGF, and LAMC1-integrin.
- CCI for non_diabetic: Similar to the autoantibody_positive condition, the non_diabetic pancreas exhibits a robust and diverse array of cell-cell interactions. This plot serves as a baseline, showing the homeostatic communication network. The types of interacting cell pairs and gene pairs are largely consistent with the autoantibody_positive state, also featuring strong Glutamate, NRG, NTN, SEMA, FGF, and LAMC1-integrin signaling.
- CCI for type1_diabetes: In stark contrast to the other two conditions, the plot for type1_diabetes shows a dramatic reduction in the number and diversity of detected cell-cell interactions. Crucially, interactions involving Alpha cells and Beta cells are almost entirely absent. The remaining interactions are predominantly restricted to exocrine compartments, specifically Acinar-Acinar, Acinar-Ductal, and Ductal-Ductal pairs. While fewer, some of these remaining interactions still show considerable strength and significance, for example, involving LAMC1-integrin complex, APP-SORL1, and specific FGF/NRG pathways.
Biological Interpretation
The observed changes in cell-cell interactions offer critical insights into the pathophysiology of Type 1 Diabetes:
- Severe Disruption of Islet Cell Communication in Type 1 Diabetes: The most striking finding is the near-complete absence of interactions involving Alpha and Beta cells in type1_diabetes. This is a direct cellular manifestation of the autoimmune destruction of insulin-producing beta cells, a hallmark of T1D, and the subsequent dysfunction or loss of other islet cell types. The lack of intercellular communication within and between islet cells profoundly impacts the functional integrity of the endocrine pancreas.
- Robust Communication Maintained in Pre-Diabetic State (Autoantibody Positive): In the autoantibody_positive condition, the pancreatic cell-cell communication network remains largely intact and diverse, resembling the non_diabetic state. This suggests that in the early stages of autoimmunity, before overt clinical diabetes, the fundamental cellular architecture and communication pathways are preserved, even while immune processes are initiating beta cell damage. Subtle quantitative differences in interaction strength or specific novel interactions in this phase would warrant further investigation to identify early disease markers.
- Persistence of Exocrine Interactions: While endocrine (islet) cell interactions are severely diminished in T1D, interactions within and between Acinar and Ductal cells largely persist. This indicates that the exocrine compartment, responsible for digestive enzyme production and ductal fluid secretion, maintains a greater degree of structural and functional integrity in T1D, though often exocrine insufficiency can occur later. Key adhesion (e.g., LAMC1-integrin) and growth factor signaling pathways (e.g., FGF, NRG) appear to maintain these interactions.
Key Ligand-Receptor Systems in Pancreatic Homeostasis and Disease:
- Glutamate Signaling (e.g., Glutamate_byGLS_and_SLC1A2_GRIA3 complexes): These interactions are prominent in non_diabetic and autoantibody_positive conditions across multiple cell types (Alpha, Beta, Ductal, Acinar). Glutamate acts as a neurotransmitter and plays roles in islet function, glucose sensing, and cell survival [PubMed search: Glutamate pancreatic islet function]. Its disappearance in T1D suggests a major disruption in neuro-endocrine communication or metabolic status.
- Neuregulin (NRG)-ERBB and Fibroblast Growth Factor (FGF) Signaling: Pathways like NRG1-ERBB3, NRG2-ERBB4, FGF10-FGFR2, and FGF4-TGFBR3 are active in healthy and autoantibody_positive pancreata. These pathways are crucial for pancreatic development, cell proliferation, survival, and regeneration, particularly for beta cells [GeneCards: ERBB3, ERBB4; PubMed search: FGF pancreatic beta cell]. Their reduced presence in T1D is expected given the cellular loss.
- Laminin-Integrin Adhesion (LAMC1_integrin_a6b1_complex): This interaction is notably strong and persistent across Acinar-Acinar and Acinar-Ductal pairs in all conditions, including T1D. This highlights the critical role of cell-extracellular matrix (ECM) and cell-cell adhesion mediated by integrins in maintaining the structural integrity and function of the exocrine pancreas [GeneCards: LAMC1].
- Notch Signaling (JAG1_NOTCH2): Present in non_diabetic and autoantibody_positive conditions, Notch signaling is essential for pancreatic development, cell fate decisions, and differentiation, particularly involving ductal and endocrine cell precursors [PubMed search: Notch signaling pancreas]. Its diminished role in T1D reflects the altered cellular landscape.
Clinical or Translational Implications
The analysis of cell-cell interactions provides direct insights relevant to therapeutic target prioritization and experimental validation in Type 1 Diabetes:
- Biomarkers for Disease Progression and Risk Stratification: The dramatic loss of islet-specific cell-cell interactions in T1D, and the potentially subtle dysregulations in the autoantibody_positive state, suggest that CCI profiles could serve as novel biomarkers. Monitoring the integrity and specific patterns of these networks in liquid biopsies or imaging could aid in identifying individuals at high risk for progression from autoantibody positivity to overt T1D, or in assessing disease severity and therapeutic response.
Therapeutic Target Prioritization to Restore Pancreatic Function:
- Islet Regeneration and Survival: In early-stage T1D or in individuals with autoantibodies, interventions aimed at preserving or restoring critical islet cell-cell communications could be highly beneficial. Modulating pathways like Glutamate signaling, Neuregulin (NRG)-ERBB, and FGF signaling could potentially support beta cell survival, proliferation, and function [PubMed search: glutamate receptor pancreas diabetes; PubMed search: neuregulin pancreatic beta cell]. These pathways represent promising targets for experimental validation in preclinical models.
- Modulating Inflammatory Environment: While not explicitly detailed here, if further analysis reveals specific immune-cell-mediated interactions (e.g., involving TGFB, SEMA) are dysregulated in the autoantibody_positive state, targeting these interactions could mitigate autoimmune destruction.
- Support for Exocrine Pancreas: The persistent LAMC1-integrin interactions in the exocrine compartment suggest its resilience. Understanding how to enhance these or other exocrine-specific interactions might provide strategies to prevent or treat exocrine insufficiency often associated with T1D.
- Experimental Validation: The identified ligand-receptor pairs and cell-cell interactions represent direct candidates for experimental validation in *in vitro* islet cultures, 3D organoid models, or *in vivo* animal models of diabetes. This could involve gain- or loss-of-function studies to confirm their role in beta cell survival, insulin secretion, and overall pancreatic function. Specific focus could be placed on the interactions that disappear in T1D or show quantitative changes in the autoantibody_positive group compared to non_diabetic controls.
6. Immune Checkpoint and Cell Cycle Pathway-Related Cell-Cell Interactions in Pancreatic T1D Progression
[Analysis Visualization Results]...
Analysis Overview
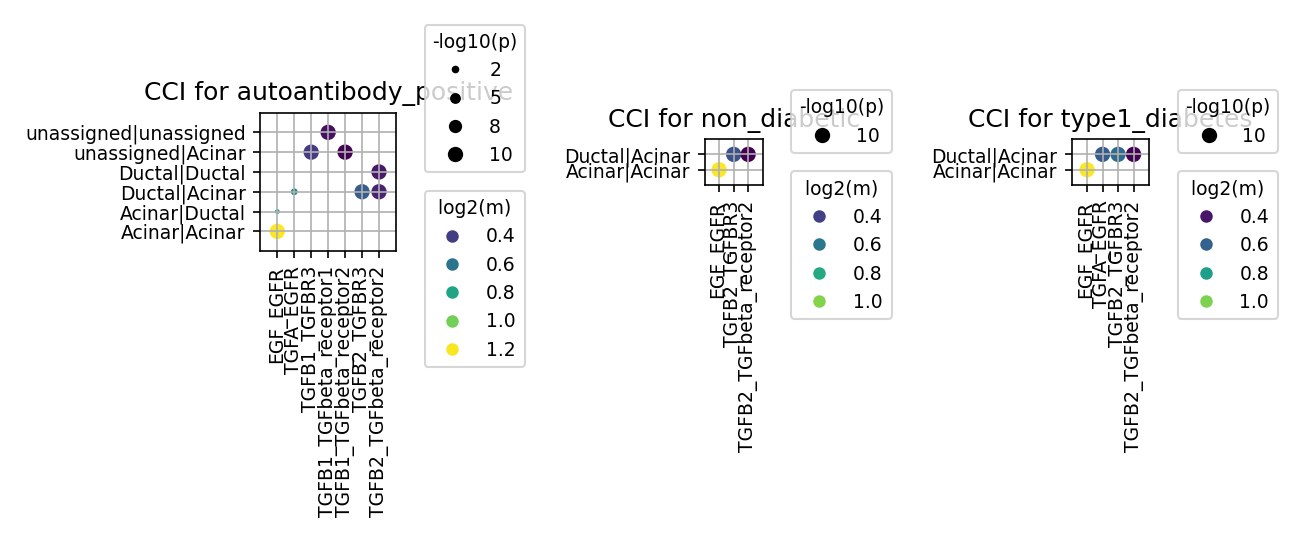
This analysis investigates cell-cell interactions (CCI) mediated by a predefined set of genes related to immune checkpoints and cell cycle pathways across different conditions in human pancreatic single-cell RNA-seq data. The conditions include autoantibody_positive (a pre-diabetic state), non_diabetic (control), and type1_diabetes (T1D). The plot_cci_dots tool was used to visualize significant ligand-receptor interactions, focusing on the mean expression (color intensity) and statistical significance (dot size) of these interactions between various pancreatic cell types.
Visual Summary
The dot plots display significant cell-cell interactions for gene pairs related to immune checkpoints and cell cycle regulation across the three conditions. Due to the broad filtering of target genes, only a few specific ligand-receptor pairs were found to be actively interacting in a statistically significant manner across the pancreatic cell types.
Consistent Interactions:
- EGF_EGFR signaling between Acinar cells (Acinar|Acinar) is consistently observed across all three conditions (autoantibody_positive, non_diabetic, type1_diabetes), showing high mean expression and strong significance (large yellow dots).
- TGFA_EGFR signaling between Ductal and Acinar cells (Ductal|Acinar) is also consistently present, albeit with moderate mean expression (green/light blue dots).
- These EGF/TGFA-EGFR interactions appear to represent a fundamental, stable intercellular communication axis in the exocrine pancreas regardless of diabetes status.
Condition-Specific Differences – Focus on TGF-beta Signaling:
- In non_diabetic and type1_diabetes conditions, only a limited set of TGFB2 interactions (TGFB2_TGFBR3 between Acinar|Acinar, and TGFB2_TGFbeta_receptor2 between Ductal|Acinar) are observed, generally with lower mean expression (dark blue/purple dots).
- A distinct and more extensive pattern of TGF-beta signaling is observed in the autoantibody_positive condition. This pre-diabetic state exhibits several unique TGF-beta interactions not prominently displayed in the other two conditions:
- TGFB1_TGFBR3 and TGFB1_TGFbeta_receptor1 (likely TGFBR1) interactions are detected between Ductal cells (Ductal|Ductal).
- TGFB2_TGFbeta_receptor2 (likely TGFBR2) and TGFB2_TGFBR3 interactions are notably prominent involving "unassigned" cells, both with "unassigned" cells (unassigned|unassigned) and with Acinar cells (unassigned|Acinar). Specifically, a strong TGFB2_TGFbeta_receptor2 interaction is seen between unassigned|unassigned cells, and a strong TGFB2_TGFbeta_receptor2 interaction between Ductal|Ductal cells.
- The autoantibody_positive group displays a broader repertoire of active TGF-beta ligand-receptor pairs (TGFB1 and TGFB2) and involves more diverse cell-cell interactions, including those with "unassigned" cell populations, compared to the non_diabetic and type1_diabetes groups.
Biological Interpretation
The analysis reveals that while basal growth factor signaling (EGF/TGFA-EGFR) remains constant, TGF-beta signaling pathways show differential activation patterns across the pancreatic conditions, particularly in the pre-diabetic autoantibody_positive state.
- Constitutive EGFR Signaling: The consistent presence and strength of EGF/TGFA-EGFR interactions between Acinar and Ductal cells across all conditions suggest that this pathway plays a fundamental role in maintaining pancreatic epithelial cell homeostasis, proliferation, and repair. Epidermal Growth Factor Receptor (EGFR) signaling is crucial for the development and maintenance of pancreatic tissue and can be involved in regeneration processes GeneCards: EGFR.
- Early TGF-beta Pathway Dysregulation in Pre-diabetes: The most striking finding is the expanded and distinct pattern of TGF-beta signaling in autoantibody_positive individuals.
- TGF-beta (Transforming Growth Factor beta) is a pleiotropic cytokine with critical roles in cell proliferation, differentiation, apoptosis, extracellular matrix production, and, notably, immune regulation, often acting as an immunosuppressant UniProt: P01137 (TGFB1).
- The detection of TGFB1 interactions, particularly within Ductal cells (Ductal|Ductal) and with "unassigned" cells, is significant. TGFB1 is a key mediator of immune tolerance and often upregulated in inflammatory and fibrotic conditions. Its activation could indicate early immune responses, inflammation, or tissue remodeling processes occurring in the pancreas of individuals developing T1D. PubMed search: TGFB1 type 1 diabetes pathogenesis.
- The involvement of "unassigned" cells in robust TGFB2 signaling in the autoantibody_positive group is a critical observation. These "unassigned" cells, which do not fall into major pancreatic cell types like Acinar or Ductal, might represent infiltrating immune cells (e.g., regulatory T cells which are potent producers of TGF-beta), activated stromal cells (e.g., fibroblasts or stellate cells involved in tissue repair/fibrosis), or early transitional cell states induced by autoimmune stress. Their active participation in TGF-beta signaling highlights a dynamic and possibly immune-mediated microenvironment in the pancreas prior to the onset of overt diabetes.
- Pathogenic Implications: The unique activation of TGF-beta signaling, especially TGFB1 and the broader engagement of TGFB2 involving distinct cell types like Ductal and "unassigned" cells in the autoantibody_positive state, suggests that dysregulation of this pathway could be an early event in T1D pathogenesis. This could contribute to altered immune surveillance, insulitis, or early damage to pancreatic tissue before significant beta-cell loss, distinguishing the pre-diabetic stage from both healthy and established diabetic states.
Clinical or Translational Implications
- Biomarker for T1D Risk: The distinct TGF-beta signaling profile in autoantibody_positive individuals could potentially serve as a novel biomarker for identifying individuals at higher risk of progressing to clinical T1D. Further investigation into the specific cell populations involved (especially the "unassigned" cells) and the precise molecular changes could refine this potential.
- Therapeutic Target Prioritization: Given TGF-beta's central role in immune regulation, inflammation, and fibrosis, the observed early activation in pre-diabetic individuals points to TGF-beta signaling as a potential therapeutic target. Modulating TGF-beta activity, either by inhibiting excessive pro-fibrotic or pro-inflammatory signaling (if such roles are confirmed) or by enhancing its immunosuppressive functions to promote tolerance, could represent an intervention strategy to prevent or delay T1D progression. However, the pleiotropic nature of TGF-beta demands careful consideration, as its roles can be context-dependent and even protective. PubMed search: TGF-beta modulation type 1 diabetes therapy.
- Experimental Validation and Cell Type Characterization: Future studies should focus on:
- Rigorously characterizing the "unassigned" cell population in autoantibody_positive individuals to identify their precise cellular identity and functional contributions to TGF-beta signaling.
- Validating these specific TGF-beta ligand-receptor interactions through in vitro or in vivo models of T1D, potentially using spatial transcriptomics or proteomic approaches to confirm physical interactions and functional consequences.
- Investigating the downstream effects of these altered TGF-beta interactions on pancreatic cell survival, immune cell recruitment, and functional changes in islet and exocrine compartments during the progression from autoantibody positivity to overt T1D.
7. Condition-Specific Cell-Cell Interaction Patterns in Pancreatic Cell Types
[Analysis Visualization Results]...
Analysis Overview
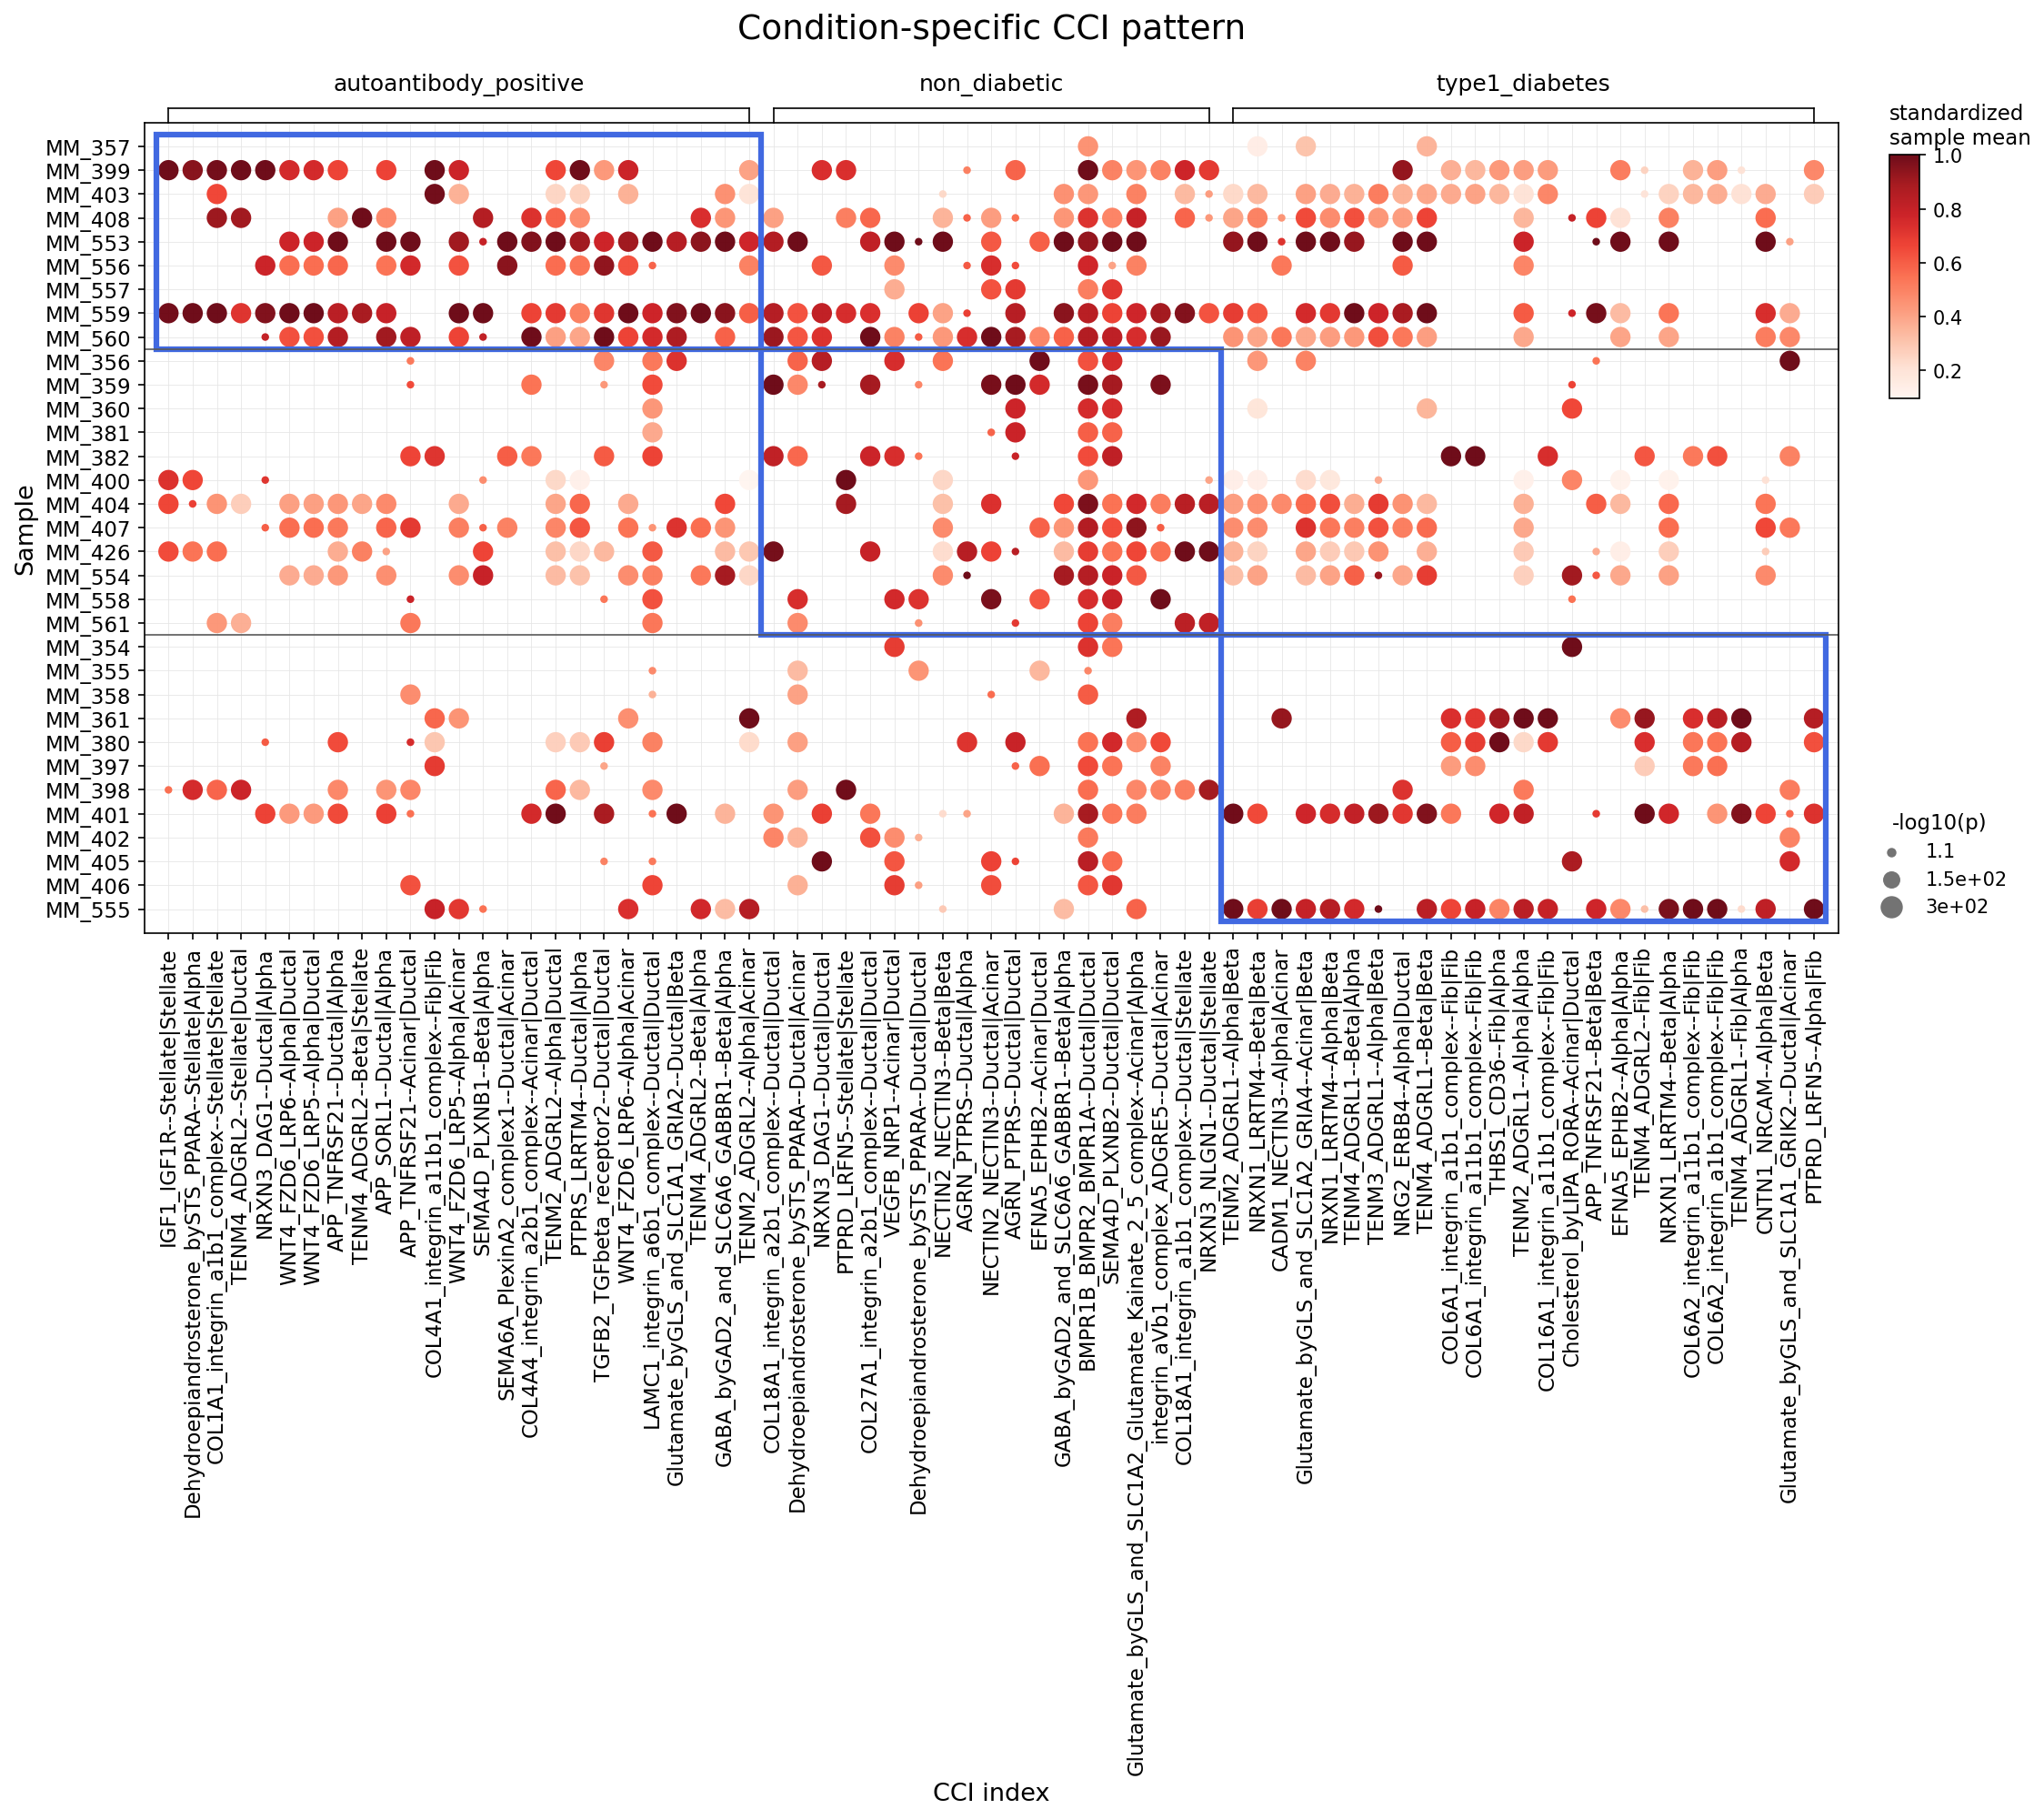
This analysis identifies statistically significant differences in cell-cell interactions (CCIs) across various pancreatic cell types under different conditions: autoantibody_positive, non_diabetic (reference), and type1_diabetes. The results are visualized as a dot plot, where the color intensity of each dot represents the standardized mean interaction strength across samples, and the size of the dot reflects the statistical significance (-log10(p-value)) of the interaction. The analysis focuses on key pancreatic cell types including Acinar cells, Ductal cells, Fibroblasts, Alpha cells, Stellate cells, Delta cells, and Beta cells. The max_n_items_per_group parameter was set to 25, displaying the top 25 most significantly different interactions for each condition.
Visual Summary
The dot plot clearly illustrates distinct patterns of cell-cell communication associated with each disease condition.
- Condition-Specific Clusters: Three prominent blue boxes highlight sets of CCIs that show enriched activity and significance primarily within a single condition, underscoring condition-specific communication networks.
- The left blue box encompasses CCIs that are particularly strong and significant in autoantibody_positive samples.
- The middle blue box highlights CCIs predominantly observed in non_diabetic (control) samples.
- The right blue box shows CCIs that are most pronounced in type1_diabetes samples.
- Interaction Strength and Significance: Darker red colors indicate higher standardized mean interaction strength, while larger dot sizes denote greater statistical significance (smaller p-value). This allows for quick identification of both potent and robust interactions.
- Sample Heterogeneity: While clear condition-specific patterns emerge, there is also some heterogeneity in interaction strength and significance among samples within the same condition, suggesting individual variability in pancreatic intercellular communication.
Biological Interpretation
The observed condition-specific CCI patterns provide critical insights into the dynamic interplay between pancreatic cell types during the progression of Type 1 Diabetes (T1D).
Autoantibody-Positive Condition (Pre-diabetic/Early Stage T1D)
- Upregulation of Stellate Cell Interactions: Several CCIs involving Stellate cells appear more active. Notably, IGF1_IGF1R--Stellate|Stellate and Dehydroepiandrosterone_bySTS_PPARA--Stellate|Stellate interactions are prominent. Pancreatic stellate cells are known to play a role in fibrosis and inflammation, and their activation has been implicated in various pancreatic diseases, including diabetes-related complications [1]. Altered IGF-1 signaling can influence cell growth, survival, and differentiation.
- Ductal-Alpha Cell Communication: Interactions like COL1A1_integrin_a1b1_complex--Ductal|Alpha suggest changes in extracellular matrix (ECM) interactions between these cell types. Integrins are crucial for cell-matrix and cell-cell adhesion and signaling [2].
- WNT and ADGRL2 Signaling: WNT4_FZD6_LRP6 and TENM4_ADGRL2 interactions, affecting multiple cell pairs (e.g., Ductal|Alpha, Ductal|Ductal, Alpha|Alpha, Stellate|Stellate), indicate dysregulation of developmental signaling pathways and cell adhesion, which could contribute to early pancreatic tissue remodeling or stress responses. Wnt signaling is critical for pancreatic development and regeneration, and its dysregulation can impact β-cell function [3].
Non-Diabetic Condition (Healthy Pancreas)
- Robust Beta-Alpha Cell Communication: A cluster of interactions involving Beta and Alpha cells, such as GABA_byGAD2_and_SLC6A6_GABBR1--Beta|Alpha, are strongly evident. GABA is an important paracrine regulator in islets, influencing both α and β cell function, typically inhibiting glucagon secretion and promoting insulin secretion [4]. The reduction of such interactions in diabetic conditions could signify a loss of healthy islet regulatory mechanisms.
- Ductal Cell Interactions: BMPR1B_BMPR2--Ductal|Alpha and AGRN_PTPRS--Ductal|Alpha suggest active signaling pathways related to morphogenesis, cell differentiation, and neurodevelopmental processes, which may be crucial for maintaining pancreatic homeostasis. BMP signaling is involved in pancreatic development and islet cell differentiation.
- Integrin and Glutamate Signaling: Interactions like COL18A1_integrin_a1b1_complex--Ductal|Alpha and Glutamate_byGLS_and_SLC1A2 (Acinar|Acinar, Ductal|Alpha, Ductal|Beta) highlight the importance of ECM-mediated signaling and glutamate signaling in a healthy pancreas. Glutamate signaling plays a role in islet cell function and glucose homeostasis.
Type 1 Diabetes Condition
- Altered Islet Cell Interactions: NRG2_ERBB4--Alpha|Alpha and TENM3_ADGRL1--Beta|Alpha show increased activity. ERBB4 signaling can modulate β-cell proliferation and survival. Disrupted communication between alpha and beta cells is a hallmark of T1D, affecting glucose homeostasis.
- Fibroblast-ECM Interactions: Several COL6A1_integrin_a1b1_complex interactions with Fibroblasts (e.g., Fibroblast|Fibroblast) are prominent, possibly indicating increased fibrosis or altered ECM remodeling in T1D. This could contribute to islet destruction or impaired function.
- Dysregulated Lipid/Metabolic Signaling: Cholesterol_byLIPA_RORA--Acinar|Ductal suggests changes in lipid metabolism and signaling pathways in T1D. RORA (Retinoic Acid Receptor-related Orphan Receptor Alpha) is a nuclear receptor involved in metabolism and immune responses [5].
- Cell Adhesion and Synaptic-like Interactions: EFNA5_EPHB2 (Alpha|Alpha, Fibroblast|Fibroblast), NRXN1_LRRTM4--Beta|Beta, and CNTN1_NRCAM--Alpha|Beta point towards dysregulation of ephrin signaling, neurexin/LRRTM4, and contactin/NRCAM pathways, which are critical for cell adhesion, axon guidance, and potentially islet architecture and function. Neurexins are key components of synaptic junctions and their presence in islets suggests complex communication mechanisms [6].
- Glutamate Signaling Shift: Glutamate_byGLS_and_SLC1A1 (Alpha|Alpha, Beta|Alpha, Ductal|Alpha) shows a distinct pattern compared to the non-diabetic condition, suggesting a shift in glutamate signaling pathways and its transporters, potentially impacting islet function and metabolic regulation.
Clinical or Translational Implications
The condition-specific CCI patterns reveal potential biological mechanisms driving T1D pathogenesis from the autoantibody-positive stage to overt diabetes.
- Early Biomarkers: CCIs identified in the autoantibody_positive group (e.g., those involving Stellate cells or specific WNT/ADGRL2 interactions) could serve as early indicators of disease progression, potentially enabling earlier intervention.
- Therapeutic Targets: Disruptions in key protective interactions (e.g., GABAergic signaling in non_diabetic islets) or heightened detrimental interactions (e.g., fibrotic or inflammatory pathways in type1_diabetes) could represent novel therapeutic targets. For instance, modulating specific integrin or growth factor pathways could potentially protect islet cells or mitigate fibrosis.
- Understanding Disease Progression: The distinct patterns highlight how intercellular communication changes as the pancreas transitions from a healthy state, through autoimmunity, to established T1D. This provides a more nuanced understanding of the disease, moving beyond individual cell responses to a systems-level perspective of tissue dysfunction.
References:
[1] Pancreatic Stellate Cells and Diabetes Mellitus. (PubMed Search: pancreatic stellate cells diabetes): https://pubmed.ncbi.nlm.nih.gov/?term=pancreatic+stellate+cells+diabetes
[2] Integrins. (GeneCards: integrin): https://www.genecards.org/cgi-bin/carddisp.pl?gene=Integrin
[3] Wnt signaling in pancreatic development and diabetes. (PubMed Search: wnt signaling pancreas diabetes): https://pubmed.ncbi.nlm.nih.gov/?term=wnt+signaling+pancreas+diabetes
[4] GABA in the pancreatic islet: a paracrine regulator of glucagon secretion. (PubMed Search: GABA pancreatic islet glucagon): https://pubmed.ncbi.nlm.nih.gov/?term=GABA+pancreatic+islet+glucagon
[5] RORα. (GeneCards: RORA): https://www.genecards.org/cgi-bin/carddisp.pl?gene=RORA
[6] Neurexins. (GeneCards: NRXN1): https://www.genecards.org/cgi-bin/carddisp.pl?gene=NRXN1
8. Fibroblast Condition-Specific Surfaceome Markers in Pancreatic Disease
[Analysis Visualization Results]...
Analysis Overview
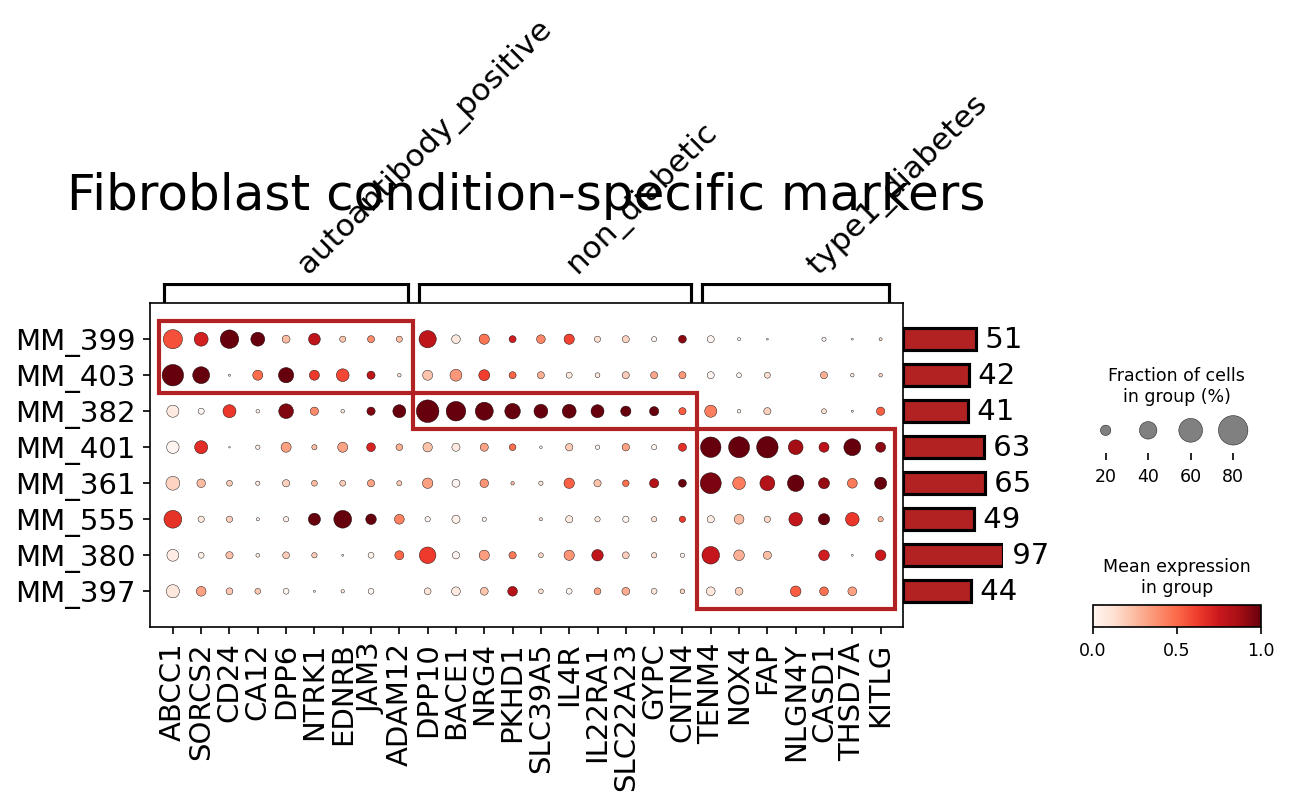
This analysis aimed to identify surfaceome-specific molecular markers within pancreatic Fibroblast cells that distinguish between different conditions: 'autoantibody_positive' (pre-diabetic or early autoimmune stage), 'non_diabetic' (healthy control), and 'type1_diabetes' (established disease). By focusing on surfaceome markers, the analysis prioritizes proteins that are accessible on the cell surface, making them prime candidates for cell-cell communication, immune modulation, and potential therapeutic targeting or biomarker development. The results are presented as a dot plot, illustrating both the mean expression level and the fraction of cells expressing each identified marker across the conditions.
Visual Summary
The dot plot clearly delineates distinct sets of surfaceome markers enriched in Fibroblast cells from each of the three studied conditions.
- 'autoantibody_positive' Fibroblasts: This group is characterized by the prominent expression and high prevalence of markers such as ABCC1, SORCS2, CD24, CA12, DPP6, NTRK1, EDNRB, and JAM3. These genes exhibit strong mean expression (darker red color) and are present in a significant fraction of cells (larger dot size) specifically within the 'autoantibody_positive' condition, with minimal expression in other conditions.
- 'non_diabetic' Fibroblasts: Fibroblasts from non-diabetic individuals display a unique signature including markers like ADAM12, DPP10, BACE1, NRG4, PKHD1, SLC39A5, IL4R, IL22RA1, SLC22A23, GYPC, CNTN4, TENM4, and NOX4. While some show moderate expression, genes such as ADAM12, DPP10, and IL4R exhibit notably higher mean expression and prevalence compared to other conditions.
- 'type1_diabetes' Fibroblasts: Fibroblasts from individuals with established Type 1 Diabetes are distinctly characterized by high expression and prevalence of FAP, NLGN4Y, CASD1, THSD7A, and KITLG. FAP (Fibroblast Activation Protein) stands out with exceptionally high mean expression and near-ubiquitous presence across these cells, strongly indicating a highly activated state. These markers are largely specific to the T1D condition.
Biological Interpretation
The condition-specific surfaceome markers in Fibroblasts provide insights into their functional states and roles in the evolving pancreatic microenvironment across diabetes progression.
- Fibroblast Activation in Type 1 Diabetes (T1D): The most striking finding is the strong upregulation of FAP in T1D fibroblasts. FAP is a well-established marker of activated fibroblasts and plays a critical role in extracellular matrix remodeling, inflammation, and fibrosis in various pathological contexts, including chronic inflammatory diseases and cancer. Its high expression in T1D suggests a pro-fibrotic and inflammatory phenotype in pancreatic fibroblasts, potentially contributing to islet destruction and impaired pancreatic function. GeneCards: FAP
- Immune and Inflammatory Engagement in Autoimmunity: In the 'autoantibody_positive' condition, markers like CD24 (involved in cell adhesion and immune regulation) and JAM3 (junctional adhesion molecule, involved in leukocyte transmigration) point towards active immune cell-fibroblast interactions. NTRK1 (receptor for NGF) and EDNRB (endothelin receptor) suggest altered neuro-immune interactions and potential early involvement in fibrosis or vascular changes, even before clinical diabetes onset. These findings highlight that fibroblasts are likely active participants in the autoimmune process targeting the pancreas.
- Homeostatic and Responsive Functions in Non-diabetic State: The 'non_diabetic' fibroblast signature includes markers like ADAM12 (a metalloproteinase involved in ECM remodeling and growth factor activation) and cytokine receptors such as IL4R and IL22RA1. This profile indicates that healthy pancreatic fibroblasts are actively involved in maintaining tissue homeostasis, remodeling the extracellular matrix, and are responsive to immune signals (e.g., IL-4 and IL-22) that can modulate their function in a non-pathological context.
- Novel Interaction Partners: Genes like NLGN4Y and KITLG in T1D, primarily known for neuronal roles or stem cell regulation respectively, could signify novel cell-cell communication pathways or altered cellular identities in pancreatic fibroblasts under disease conditions. KITLG (KIT Ligand, also known as Stem Cell Factor) can affect mast cell proliferation and survival, suggesting potential contributions to inflammation in T1D. GeneCards: KITLG
Clinical or Translational Implications
The identification of condition-specific surfaceome markers in pancreatic fibroblasts offers significant clinical and translational opportunities.
- Biomarker Discovery: The distinct surfaceome profiles could serve as novel diagnostic or prognostic biomarkers. For instance, high FAP expression in pancreatic fibroblasts might indicate the severity of fibrosis or disease progression in T1D. Markers from the 'autoantibody_positive' group could potentially help identify individuals at higher risk of progressing to clinical T1D or stratify them for early intervention strategies.
- Therapeutic Targets: As surface-expressed proteins, these markers are directly accessible for therapeutic modulation. The prominent upregulation of FAP in T1D fibroblasts makes it an attractive therapeutic target to attenuate fibrosis and inflammation in the pancreas. Inhibitors or antibodies targeting FAP are already in various stages of development for other fibrotic diseases and cancers, suggesting a potential for repurposing in T1D. Similarly, targeting specific cytokine receptors (e.g., IL4R) or adhesion molecules identified in early disease stages could modulate fibroblast-immune cell interactions and potentially slow down the autoimmune attack.
- Understanding Disease Pathogenesis: Further functional studies validating the roles of these specific markers in pancreatic fibroblast biology and T1D pathogenesis are warranted. This could involve exploring their contribution to altered ECM, immune cell recruitment, islet cell damage, or pancreatic dysfunction, potentially revealing new mechanisms of disease.
9. Upregulated Gene Ontology Pathways in Pancreatic Cell Types Across Diabetes Conditions
[Analysis Visualization Results]...
Analysis Overview
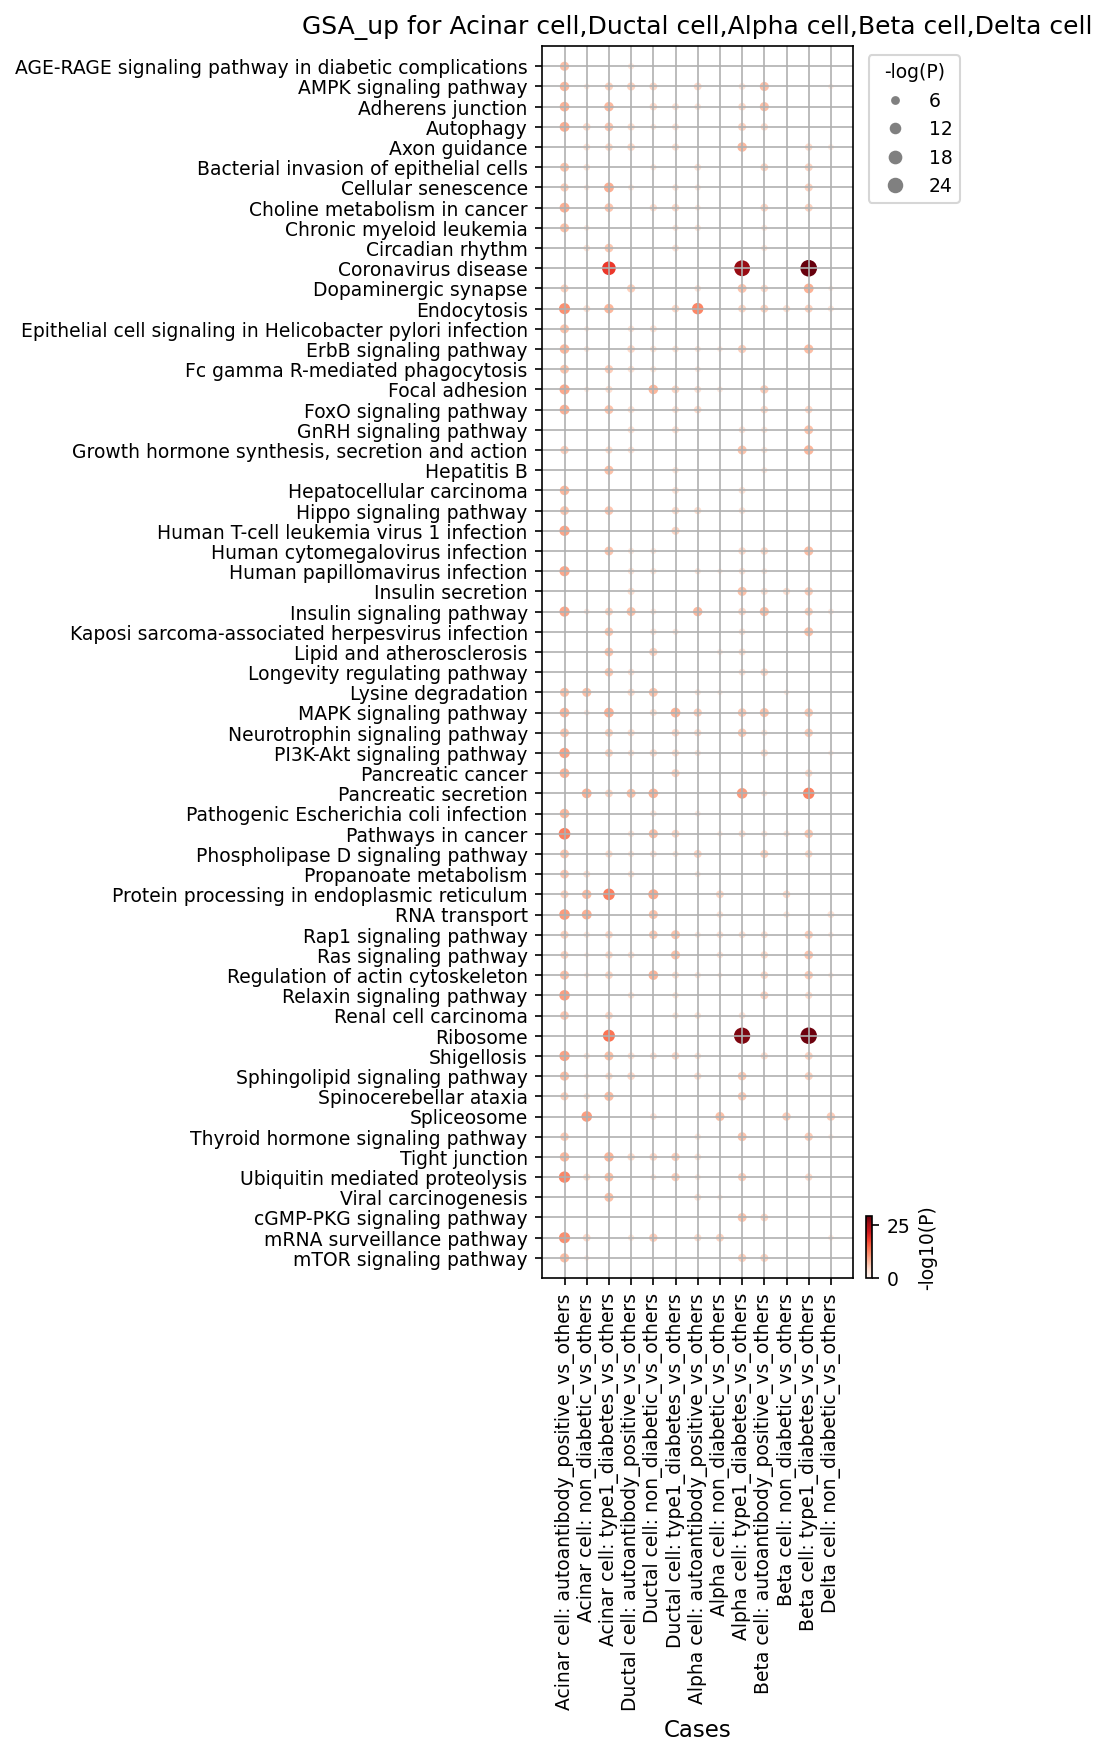
This analysis presents the Gene Ontology (GO) pathway enrichment results (GSA_up) for specific pancreatic cell types: Acinar cell, Ductal cell, Alpha cell, Beta cell, and Delta cell. The analysis compares each condition (autoantibody_positive, non_diabetic, type1_diabetes) against all other conditions combined ("vs_others") to identify significantly upregulated pathways. The results are visualized as a dot plot, where the size and color intensity of each dot correspond to the statistical significance of the pathway enrichment (-log(p-value)). This approach highlights pathways that are predominantly active in a given cell type under a particular condition relative to the broader context.
Visual Summary
The dot plot effectively illustrates the landscape of upregulated GO pathways across different pancreatic cell types and diabetes-related conditions.
- Pervasive Ribosomal Activity: A standout observation is the highly significant and widespread enrichment of the "Ribosome" pathway across Alpha and Beta cells in all three conditions (autoantibody_positive, non_diabetic, type1_diabetes), as well as in Ductal cells from non-diabetic individuals. This is evident from the largest and darkest dots representing this pathway.
- Type 1 Diabetes (T1D) Specific Stress Signatures: In Alpha and Beta cells from type1_diabetes individuals, there is a strong and significant upregulation of pathways indicative of cellular stress and dysfunction. These include "Protein processing in endoplasmic reticulum," "Cellular senescence," and "Tight junction," along with "Renal cell carcinoma" and "Coronavirus disease" pathways. Additionally, broad signaling pathways like "PI3K-Akt signaling pathway" and "MAPK signaling pathway" are notably active.
- Autoantibody-Positive State Insights: The autoantibody_positive condition in Alpha and Beta cells shows an enrichment pattern somewhat similar to that seen in overt T1D, with significant upregulation of "Ribosome" and "Coronavirus disease" pathways, though often with slightly lower statistical significance. "Endocytosis" is also prominent in autoantibody_positive Alpha cells, and "Pathogenic Escherichia coli infection" shows up in autoantibody_positive Beta cells.
- Non-Diabetic Cellular Activity: Non-diabetic Alpha and Beta cells exhibit strong enrichment for "Ribosome" and "Coronavirus disease" pathways. Non-diabetic Ductal cells show exceptional upregulation of the "Ribosome" pathway, alongside "Protein processing in endoplasmic reticulum," "MAPK signaling pathway," "Tight junction," and "Focal adhesion."
Cell Type-Specific Patterns
- Alpha and Beta cells consistently display the most robust and diverse pathway enrichments, particularly under T1D conditions.
- Ductal cells demonstrate significant ribosomal activity in the non-diabetic state, with some stress and structural pathway involvement in T1D.
- Acinar cells generally show fewer highly significant enrichments, though "Coronavirus disease" and "Protein processing in endoplasmic reticulum" are noteworthy in T1D.
- Delta cells reveal minimal significant pathway activity in the analyzed non-diabetic condition.
Biological Interpretation
The identified upregulated GO pathways offer crucial insights into the dynamic cellular processes within the human pancreas under healthy and diabetic conditions.
- High Protein Synthesis and Potential ER Stress: The widespread upregulation of the "Ribosome" pathway underscores a high demand for protein synthesis across various pancreatic cell types. In non-diabetic states, this likely reflects robust cellular function. However, the concurrent and highly significant enrichment of "Protein processing in endoplasmic reticulum" in Beta cells from type1_diabetes individuals strongly points to Endoplasmic Reticulum (ER) stress. Beta cells in T1D are under severe metabolic and inflammatory duress, leading to accumulation of misfolded proteins and activation of the unfolded protein response (UPR), a key mechanism contributing to beta-cell dysfunction and demise.
- Cellular Senescence in Diabetic Islets: The significant upregulation of "Cellular senescence" in Alpha and Beta cells during type1_diabetes suggests that these cells enter a state of irreversible growth arrest. Senescent cells in the islets can contribute to chronic inflammation and tissue damage through their senescence-associated secretory phenotype (SASP), potentially accelerating beta-cell loss and promoting islet pathology.
- Activation of Immune and Stress Response Pathways: The consistent enrichment of "Coronavirus disease" and "Pathogenic Escherichia coli infection" pathways in Alpha and Beta cells across autoantibody_positive and type1_diabetes conditions implies the activation of broad innate immune or antiviral defense mechanisms. While named after specific pathogens, these pathways often reflect general interferon-stimulated gene programs or pathogen recognition receptor signaling, which can be triggered by inflammation, viral infections (known to potentially contribute to T1D etiology), or cellular damage. The "Endocytosis" pathway in autoantibody_positive Alpha cells may also be linked to altered antigen processing or immune surveillance.
- Altered Cell Adhesion and Structural Integrity: The upregulation of "Tight junction" pathways in T1D Beta and Ductal cells, alongside "Focal adhesion" in non-diabetic Ductal cells, indicates changes in cell-cell and cell-matrix interactions. In the context of T1D, inflammation and cellular stress can compromise islet architecture, potentially altering the integrity of tight junctions in endocrine cells and ductal cells, thereby affecting barrier function and interactions with invading immune cells.
- Dysregulated Cellular Growth and Survival Signaling: The unexpected enrichment of the "Renal cell carcinoma" pathway in T1D Alpha and Beta cells, coupled with activation of "PI3K-Akt signaling" and "MAPK signaling pathway," suggests dysregulation of pathways governing cell proliferation, survival, and metabolic reprogramming. While not indicative of cancer, this could represent a maladaptive or failed regenerative attempt by stressed islet cells, contributing to their pathological state in T1D.
Clinical or Translational Implications
- Biomarker Discovery: The identified alterations in pathways, particularly ER stress and cellular senescence in Alpha and Beta cells, hold potential as early biomarkers for T1D progression or as indicators of therapeutic response.
- Therapeutic Avenues: Pathways implicated in ER stress and cellular senescence represent compelling therapeutic targets. Strategies aimed at ameliorating ER stress or clearing senescent cells from pancreatic islets could potentially preserve residual beta-cell function and slow disease progression in individuals at risk or in early stages of T1D.
- Insights into Early Pathogenesis: The shared pathway enrichments between the autoantibody_positive state and overt T1D suggest that critical cellular stress responses, immune activation, and metabolic shifts initiate early in the disease course, presenting a crucial window for preventative or early intervention strategies.
- Beyond Beta Cell-Centric Views: The involvement of Alpha and Ductal cells in these perturbed pathways underscores that T1D impacts multiple islet cell types and their microenvironment. Future therapeutic approaches may benefit from targeting shared stress pathways or intercellular communication across different islet cell populations.
- Environmental Triggers and Host Response: The enrichment of infection-related pathways supports the ongoing investigation into the role of viral infections as potential triggers or exacerbating factors in T1D. This highlights the importance of understanding specific viral agents and the host's antiviral responses in T1D pathogenesis.
In summary, this GSA analysis provides a comprehensive molecular snapshot of cellular responses in pancreatic islets during diabetes, revealing signatures of stress, immune activation, and metabolic dysregulation that are crucial for understanding T1D pathogenesis and identifying novel therapeutic targets.
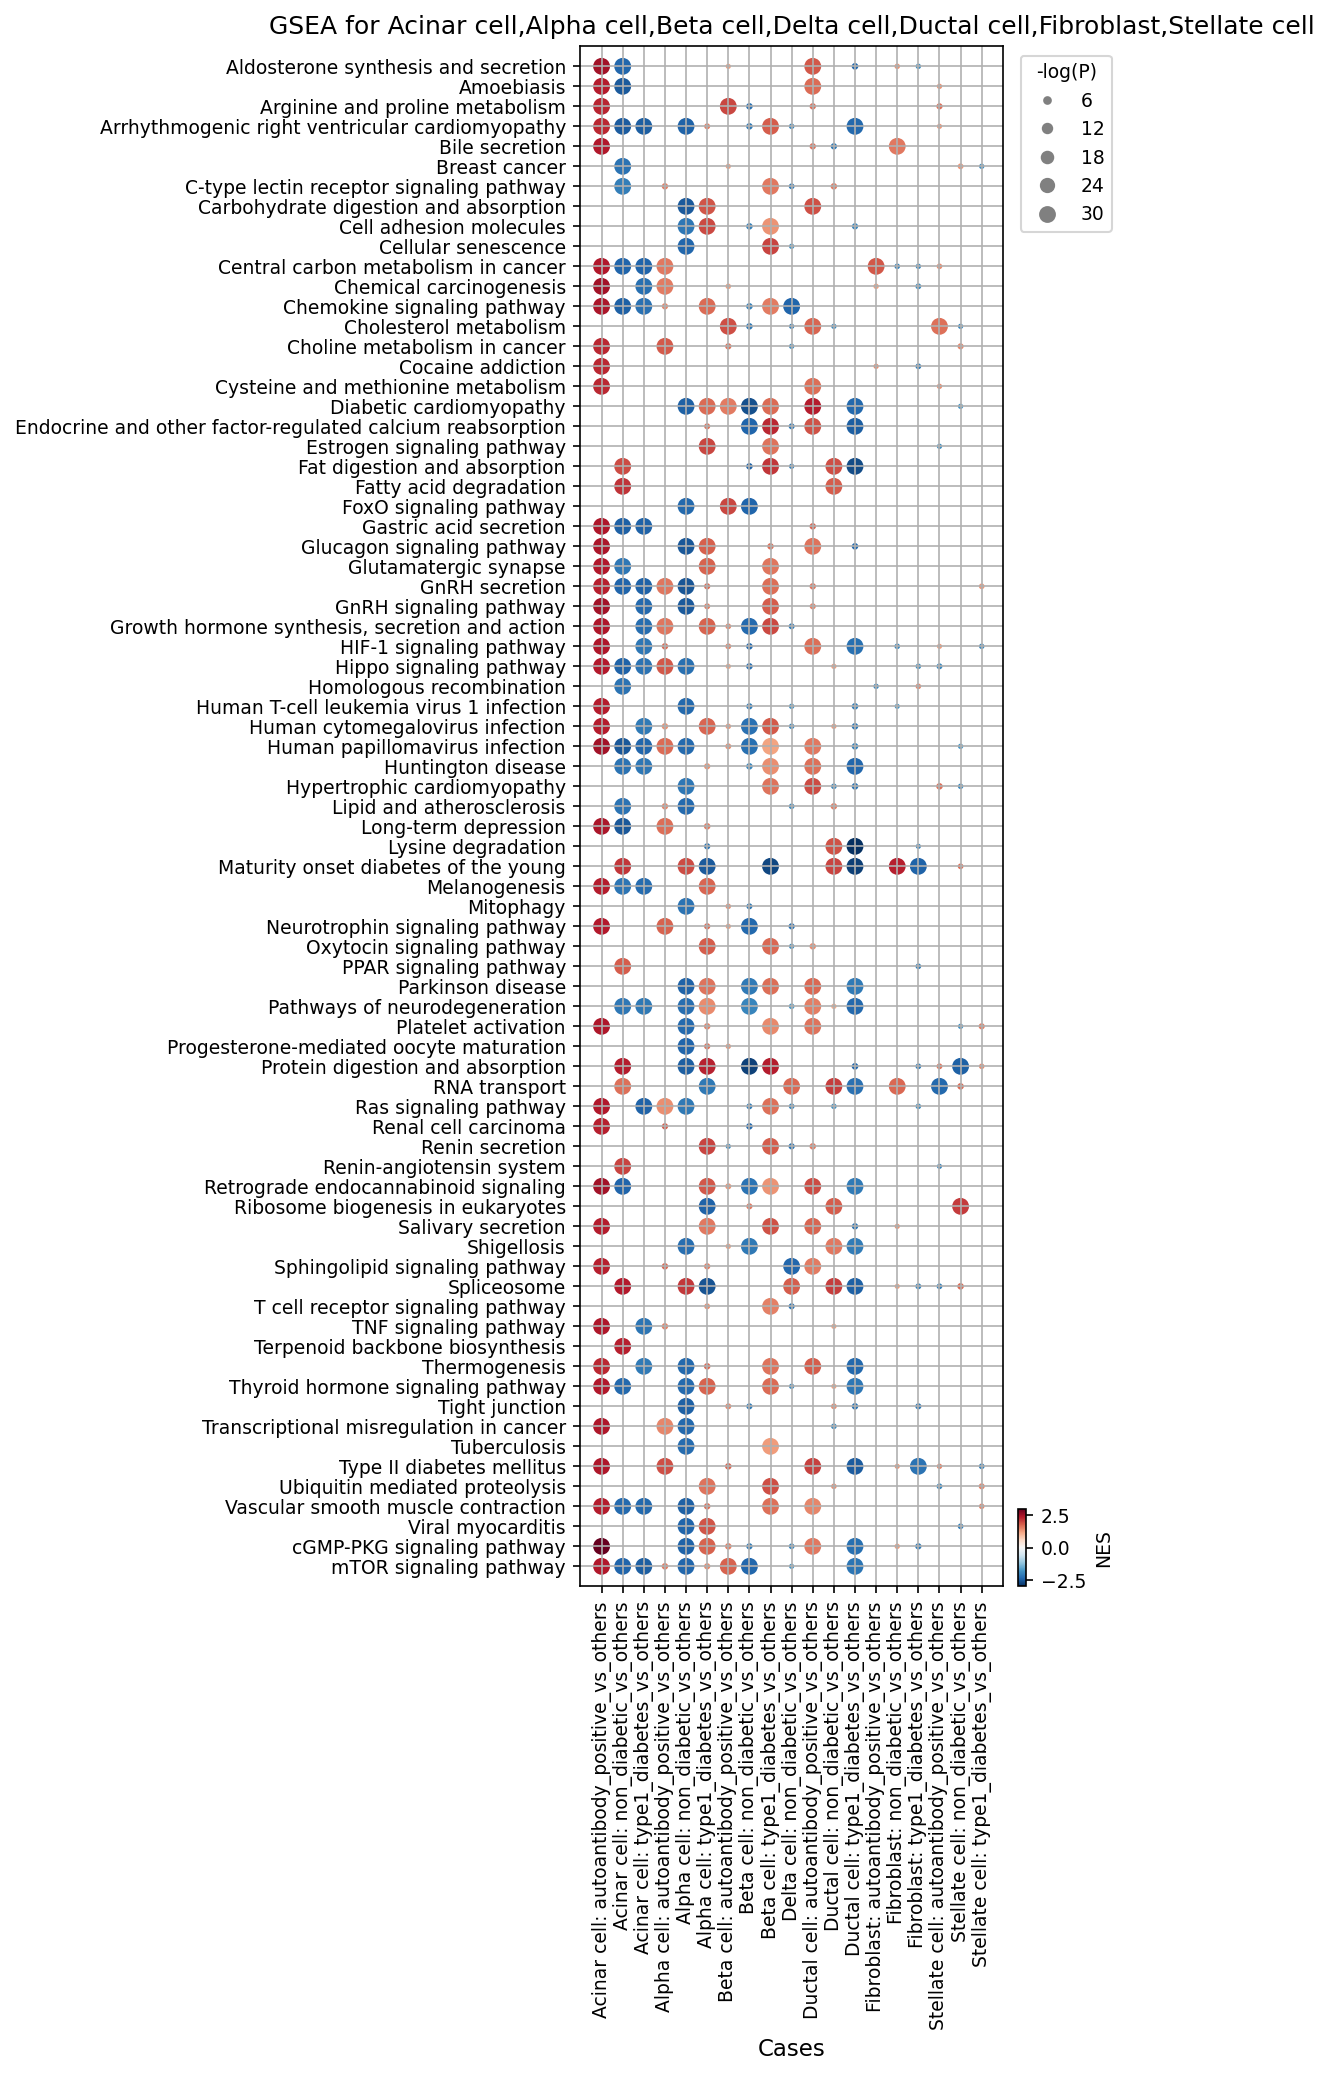
10. Gene Set Enrichment Analysis Reveals Widespread Pancreatic Dysfunction and Inflammatory Activation in Type 1 Diabetes and Autoantibody-Positive States
[Analysis Visualization Results]...
Analysis Overview
This analysis presents Gene Set Enrichment Analysis (GSEA) results across various key pancreatic cell types (Acinar, Alpha, Beta, Delta, Ductal, Fibroblast, Stellate cells) to identify pathways differentially enriched in individuals with Type 1 Diabetes (T1D), Autoantibody-Positive (AAB+) status, or a Non-Diabetic state, compared to all other conditions. The dot plot visualizes the Normalized Enrichment Score (NES) and the significance (-log(p-value)) for the top 80 enriched gene sets (pathways). Red dots indicate positive enrichment (upregulation) in the target condition, while blue dots indicate negative enrichment (downregulation). The size of the dot reflects the statistical significance.
Visual Summary
The dot plot effectively illustrates distinct pathway enrichment patterns associated with the three conditions across different pancreatic cell types. A prominent observation is the pervasive upregulation of immune and inflammatory signaling pathways (e.g., "T cell receptor signaling pathway", "TNF signaling pathway", "Cell adhesion molecules") in both Type 1 Diabetes and Autoantibody-Positive conditions across virtually all examined pancreatic cell types, including exocrine (Acinar, Ductal) and endocrine (Alpha, Beta, Delta) cells, as well as stromal cells (Fibroblast, Stellate). Conversely, these same pathways show negative enrichment in the Non-Diabetic state.
In contrast, a broad spectrum of metabolic, regulatory, and developmental pathways (e.g., "Aldosterone synthesis and secretion", "Arginine and proline metabolism", "Cholesterol metabolism", "Fatty acid degradation", "FoxO signaling pathway", "Glucagon signaling pathway", "Protein digestion and absorption", "Ribosome biogenesis in eukaryotes", "mTOR signaling pathway") exhibit widespread downregulation in T1D and AAB+ conditions, and correspondingly, positive enrichment in the Non-Diabetic group. The significance of these enrichments, as indicated by dot size, is often high, particularly for key inflammatory and metabolic pathways.
Biological Interpretation
Pervasive Inflammatory and Immune Activation in Disease States
- Type 1 Diabetes (type1_diabetes_vs_others): A striking and consistent finding is the strong positive enrichment of "Cell adhesion molecules", "T cell receptor signaling pathway", and "TNF signaling pathway" across *all* pancreatic cell types (Acinar, Alpha, Beta, Delta, Ductal, Fibroblast, Stellate cells). This indicates a widespread, robust inflammatory and autoimmune response involving the entire pancreatic microenvironment, not just the insulin-producing beta cells. The T cell receptor signaling pathway is central to adaptive immunity and T-cell mediated destruction characteristic of T1D PubMed search: T cell receptor signaling type 1 diabetes. TNF signaling is a critical mediator of inflammation and cell death, consistent with tissue damage in T1D GeneCards: TNF. Cell adhesion molecules facilitate immune cell infiltration and cell-cell interactions in inflamed tissues PubMed search: Cell adhesion molecules type 1 diabetes. The consistent upregulation across all cell types suggests these pathways are central to the overall pathogenesis in the pancreatic tissue.
- Autoantibody Positive (autoantibody_positive_vs_others): Individuals in this pre-diabetic state also show a distinct, albeit partially overlapping, inflammatory signature. Pathways such as "Chemokine signaling pathway", "C-type lectin receptor signaling pathway", "Cell adhesion molecules", and "TNF signaling pathway" are positively enriched across all cell types. This suggests that immune activation and cellular stress commence early in the disease progression, potentially initiating prior to clinical symptoms. Chemokine signaling, in particular, is crucial for recruiting immune cells to the islets, a hallmark of early insulitis PubMed search: Chemokine signaling type 1 diabetes. The shared activation of "Sphingolipid signaling pathway" in both T1D and AAB+ conditions across multiple cell types further suggests altered lipid metabolism and cellular stress responses in disease progression PubMed search: Sphingolipid signaling diabetes.
Widespread Metabolic and Functional Impairment
- Both T1D and AAB+ conditions show broad downregulation of numerous metabolic and regulatory pathways across multiple cell types. These include pathways involved in lipid metabolism ("Fatty acid degradation", "Cholesterol metabolism"), amino acid metabolism ("Arginine and proline metabolism", "Cysteine and methionine metabolism"), and various signaling networks ("FoxO signaling pathway", "Hippo signaling pathway", "mTOR signaling pathway"). This widespread suppression suggests a general state of cellular dysfunction, metabolic reprogramming, and impaired maintenance across pancreatic cells in the context of autoimmune attack.
- The "Ribosome biogenesis in eukaryotes" pathway shows upregulation in T1D, potentially indicating an altered protein synthesis demand under stress or a compensatory mechanism.
Cell-Type Specific Insights
- Beta Cells: In T1D beta cells, the "Glucagon signaling pathway" is significantly downregulated. While beta cells do not produce glucagon, this pathway can influence beta cell function, survival, and glucose sensing, suggesting a critical disruption in glucose homeostasis beyond insulin deficiency itself PubMed search: Glucagon signaling beta cell function. Conversely, this pathway is upregulated in non-diabetic beta cells, indicating its importance for healthy beta-cell function.
- Stromal Cells: Pancreatic Fibroblasts and Stellate cells, which contribute to the pancreatic microenvironment and respond to inflammation, consistently show activation of immune and inflammatory pathways (e.g., "T cell receptor signaling pathway", "TNF signaling pathway") in T1D and AAB+ states. This highlights their active participation in the pathogenesis of autoimmune diabetes, potentially contributing to extracellular matrix remodeling or influencing immune cell infiltration.
Healthy Pancreas Signatures
- Non-Diabetic (non_diabetic_vs_others): As expected, this condition shows a reversal of the disease-associated patterns. Pathways related to normal cellular metabolism, secretion, and physiological maintenance are positively enriched, while the inflammatory and immune pathways observed in T1D and AAB+ states are negatively enriched, reflecting a healthy, non-inflamed pancreatic environment.
Clinical or Translational Implications
- Biomarkers for Early Disease and Progression: The distinct inflammatory and metabolic pathway signatures identified in AAB+ individuals, particularly those consistently altered across multiple pancreatic cell types, could serve as novel multi-cellular biomarkers for identifying individuals at high risk of progressing to T1D, or for monitoring early disease activity and response to immunomodulatory therapies.
- Novel Therapeutic Targets: The pervasive and significant upregulation of specific immune signaling pathways (e.g., T cell receptor signaling, TNF signaling, Chemokine signaling, Cell adhesion molecules) across a broad range of pancreatic cell types in T1D and AAB+ suggests that interventions targeting these pathways may have broader efficacy in modulating the autoimmune process and preserving pancreatic function, rather than solely focusing on beta-cell specific approaches.
- Understanding Disease Heterogeneity: The detailed pathway enrichment across different cell types provides a comprehensive view of how T1D impacts the entire organ, not just the islets. This holistic understanding is crucial for developing therapies that address the full spectrum of pancreatic dysfunction and inflammation, potentially leading to more effective disease management and prevention strategies.
11. Discussion
The single-cell analysis of human pancreatic tissue provides a comprehensive view of the cellular and molecular dynamics underlying Type 1 Diabetes (T1D) pathogenesis. A central finding is the clear and significant reduction in Beta cell populations in T1D, a hallmark of the disease, while Beta cell proportions are relatively preserved in the autoantibody-positive (AAB+) state. This confirms the utility of the dataset for studying T1D pathology at single-cell resolution.
Beyond Beta cell loss, the study reveals a striking and pervasive immune and inflammatory activation across *all* major pancreatic cell types—exocrine (Acinar, Ductal), endocrine (Alpha, Beta, Delta), and stromal (Fibroblast, Stellate cells)—in both AAB+ and T1D conditions. Gene Set Enrichment Analysis (GSEA) consistently shows upregulation of T cell receptor, TNF, and chemokine signaling pathways, indicating a broader pancreatic involvement in the autoimmune process than often solely focused on islet-specific damage. This pan-pancreatic inflammatory milieu likely contributes to a hostile environment for islet cells and could influence overall pancreatic function.
Cell-cell interaction (CCI) analysis highlights a dramatic disruption of communication networks, particularly involving Alpha and Beta cells, in established T1D, reflecting the severe loss and dysfunction of the endocrine compartment. Conversely, the pre-diabetic AAB+ state maintains a robust communication network but exhibits distinct alterations, such as an expanded and more diverse TGF-beta signaling profile involving ductal and 'unassigned' cells. The 'unassigned' cell populations, enriched in T1D and AAB+ UMAP clusters and actively participating in TGF-beta signaling, warrant further investigation as potential immune infiltrates or novel stress-induced pancreatic cell states.
Furthermore, fibroblasts in T1D show strong activation, evidenced by the high expression of FAP, a key marker of fibrotic processes. This suggests that stromal remodeling and fibrosis may play a significant role in T1D progression and impaired pancreatic function. In the AAB+ state, fibroblasts display markers associated with immune and inflammatory engagement, indicating their early involvement in the autoimmune process. Gene Ontology (GSA) results also reveal prominent Endoplasmic Reticulum (ER) stress and cellular senescence pathways in Alpha and Beta cells during T1D, pointing to intrinsic cellular dysfunction and death mechanisms. The consistent enrichment of infection-related pathways (e.g., 'Coronavirus disease') in AAB+ and T1D islets suggests activation of broad innate immune responses, potentially triggered by inflammation or viral exposures, which could contribute to disease etiology or progression.
Collectively, these findings synthesize a dynamic picture of T1D pathogenesis: an early, widespread immune and inflammatory engagement affecting diverse pancreatic cell types, leading to a profound disruption of islet communication, activation of stromal cells, and cellular stress responses that ultimately culminate in Beta cell destruction and overall pancreatic dysfunction. This multi-cellular and multi-faceted view extends beyond solely Beta cell-centric models, highlighting the importance of the entire pancreatic microenvironment in disease initiation and progression.
Hypotheses:
- The 'unassigned' cell population enriched in type 1 diabetes and autoantibody-positive conditions represents infiltrating immune cells that actively drive pancreatic inflammation and islet destruction.
- The widespread inflammatory and immune activation observed across all pancreatic cell types in autoantibody-positive individuals establishes a critical pre-diabetic microenvironment that contributes to disease progression beyond direct beta-cell targeting.
- Fibroblast activation, characterized by FAP upregulation in type 1 diabetes, actively contributes to islet fibrosis and impaired pancreatic endocrine and exocrine function.
- Dysregulation of TGF-beta signaling, particularly involving 'unassigned' cells and ductal cells in the autoantibody-positive state, modulates immune responses and pancreatic tissue remodeling, influencing the pace of type 1 diabetes onset.
- Endoplasmic Reticulum (ER) stress and cellular senescence pathways are key intrinsic drivers of beta and alpha cell dysfunction and demise in established type 1 diabetes.
- Changes in GABAergic and glutamate signaling identified in non-diabetic islets are essential for healthy islet function and their disruption contributes to impaired glucose homeostasis in type 1 diabetes.
Potential therapeutic targets:
- FAP (Fibroblast Activation Protein): FAP is highly upregulated in fibroblasts from type 1 diabetes patients, indicating a pro-fibrotic and inflammatory phenotype. Targeting FAP could mitigate pancreatic fibrosis, a known contributor to islet damage and impaired organ function. Evidence: Section 8 shows FAP is exceptionally highly expressed in 'type1_diabetes' fibroblasts, suggesting active fibroblast activation and its role in disease pathology. Validation: Test FAP inhibitors in mouse models of type 1 diabetes or human pancreatic organoid models to assess reduction in fibrosis markers, preservation of islet architecture, and improved metabolic outcomes.
- TGF-beta signaling pathway (specifically TGFB1/2 and their receptors): TGF-beta signaling is distinctly expanded and involves unique cell populations ('unassigned', ductal) in the autoantibody-positive pre-diabetic state. Modulating this pathway could intervene early in disease progression by altering immune responses or tissue remodeling. Evidence: Section 6 demonstrates a distinct and more extensive pattern of TGF-beta interactions (TGFB1_TGFBR3, TGFB1_TGFbeta_receptor1, TGFB2_TGFbeta_receptor2) in autoantibody-positive samples, particularly involving 'unassigned' and Ductal cells, compared to non-diabetic or T1D conditions. Validation: Investigate the effects of TGF-beta pathway modulators (agonists/antagonists) in early-stage type 1 diabetes models, focusing on preventing immune cell infiltration into islets and preserving beta cell mass and function. Characterize the 'unassigned' cell population to understand their specific contribution to TGF-beta dynamics.
- Pathways involved in ER stress and Cellular Senescence: ER stress and cellular senescence are significantly upregulated in alpha and beta cells in type 1 diabetes, contributing to islet cell dysfunction and demise. Interventions to alleviate ER stress or clear senescent cells could preserve residual islet function. Evidence: Section 9 highlights strong and significant upregulation of 'Protein processing in endoplasmic reticulum' and 'Cellular senescence' pathways in Alpha and Beta cells from 'type1_diabetes' individuals. Validation: Evaluate the efficacy of ER stress modulators or senolytic agents in preclinical models of type 1 diabetes to reduce markers of stress/senescence, enhance islet cell survival, and improve glucose regulation.
- Pan-pancreatic inflammatory signaling (e.g., T cell receptor, TNF, Chemokine signaling pathways): Widespread and robust activation of inflammatory and immune signaling pathways across virtually all pancreatic cell types in autoantibody-positive and type 1 diabetes conditions suggests that dampening this broad inflammation could protect the entire pancreatic microenvironment. Evidence: Section 10 shows strong positive enrichment of 'T cell receptor signaling pathway', 'TNF signaling pathway', and 'Chemokine signaling pathway' across Acinar, Alpha, Beta, Delta, Ductal, Fibroblast, and Stellate cells in both 'type1_diabetes' and 'autoantibody_positive' conditions. Validation: Test broad anti-inflammatory or immunomodulatory drugs (e.g., TNF-alpha inhibitors, chemokine receptor blockers) in models of type 1 diabetes to assess their impact on overall pancreatic inflammation, islet preservation, and disease progression.
Follow-up validation ideas:
- Perform spatial transcriptomics or high-plex immunostaining on human pancreatic sections from non-diabetic, autoantibody-positive, and type 1 diabetes donors to precisely localize 'unassigned' cells and validate their immune or stromal identity and proximity to islets.
- Utilize in vitro pancreatic islet or organoid models to perturb key cell-cell interactions (e.g., TGF-beta, NRG-ERBB, GABA signaling) identified as dysregulated in disease conditions, and assess their functional impact on cell survival, insulin/glucagon secretion, and inflammatory responses.
- Conduct flow cytometry or mass cytometry (CyTOF) on dissociated pancreatic cells to quantify and phenotype the 'unassigned' population using a comprehensive panel of immune cell markers, confirming their role in the autoimmune process.
- Employ specific FAP inhibitors in pre-clinical models of type 1 diabetes to evaluate if mitigating fibroblast activation reduces pancreatic fibrosis, preserves islet mass, and improves glucose homeostasis.
- Validate ER stress markers (e.g., CHOP, GRP78) and senescence markers (e.g., p16, SA-beta-Gal) in human T1D pancreatic sections via immunostaining and quantitative PCR, and investigate the effect of senolytics on islet function in diabetic models.
- Perform targeted functional studies on purified pancreatic cell types (e.g., Alpha, Beta cells) to confirm altered metabolic pathways (e.g., sphingolipid signaling, fatty acid degradation) observed in GSEA and their impact on cell health and function.
Limitations:
This report is based on single-cell RNA-seq data, which provides transcriptomic snapshots and infers cell-cell interactions; these findings require experimental validation at the protein level and in functional assays. The 'unassigned' cell population, though implicated in key interactions and pathways, lacks specific phenotypic characterization and warrants further investigation. While the data suggests pervasive inflammation, the precise immune cell types and their direct causal contributions to islet destruction cannot be fully determined from this dataset alone. Furthermore, the cross-sectional nature of the data limits direct inference of causality or the dynamic progression of disease in individual patients.
12. Query List
- Show UMAP plots including condition, sample, major cell type, and minor cell type in 2 columns and save.
- Show expression of CD3D, CD4, CD8A, CD79A, MS4A1, MZB1, CD14, LYZ, FBLN1, NOTCH3, EPCAM, MUC1, CD34 genes on UMAP with minor cell type annotation. Set ncols=4 and save.
- Show the overall Celltype_subset marker expression dot plot and save it. Keep target_cell as None and keep the other arguments at their default values.
- Show population bar plot for minor cell types and save.
- Show cell-cell interactions by condition and save the result. Select at most 80 cell-cell interactions for each condition.
- Filter genes related to immune checkpoint and cell cycle pathways and show cell-cell interactions for these genes and save.
- Find statistically significant differences in cell-cell interactions by condition for key pancreatic cell types and show them as a dot plot and save. Set max_n_items_per_group = 25.
- Extract condition-specific markers for Fibroblast cells and show them as a dot plot and save. Include only surfaceome markers, up to 50 markers per condition.
- Show Gene Ontology (GSA) analysis results as a bar plot for Acinar cell, Ductal cell, Alpha cell, Beta cell, and Delta cell and save.
- Show Gene set enrichment analysis results as a dot plot for key pancreatic cell types and save. Set color map to RdBu_r and n_pws_to_show = 80.